IT Service Delivery Consultant
As an IT service delivery consultant, Mike optimizes teams and processes. He has found using visuals helps to identify gaps and inefficiencies and to present new and improved processes.
Contact salesKey benefits
- DISCOVER
- Mike uses Lucidchart to map out the team's current process while with the client, gathering feedback in real time.
- OPTIMIZE
- Putting the client's information in a visual format helps Mike identify inefficiencies hurting the company's current processes.
- PRESENT
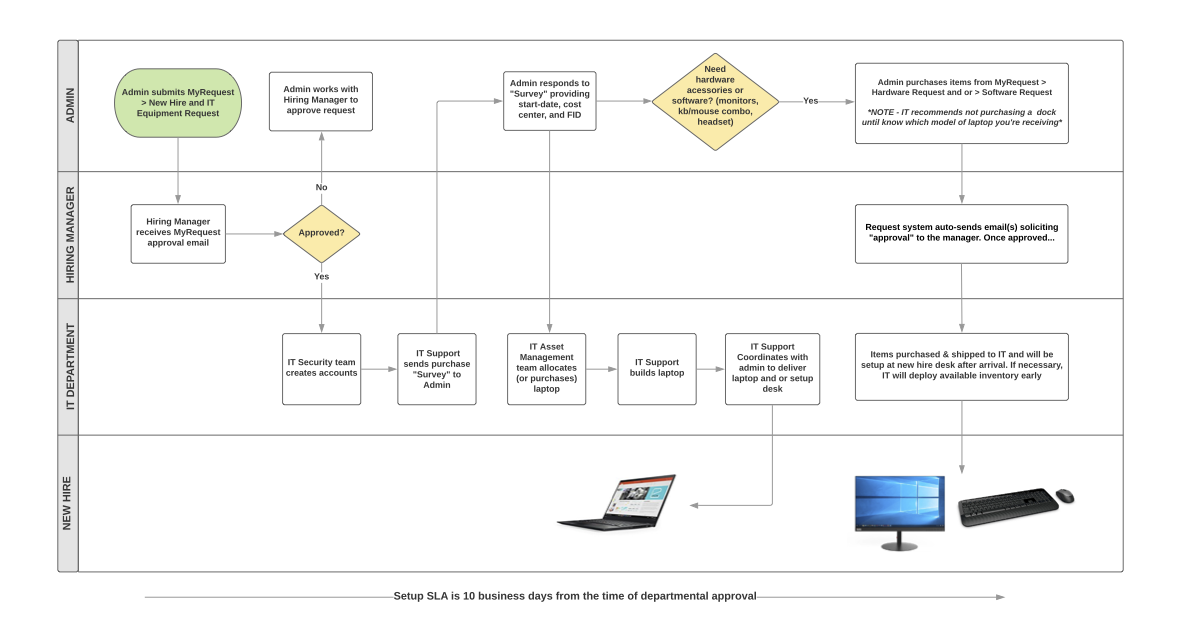
- Mike is able to give the client a diagram mapping the to-be process and supporting documentation. The client can refer to the visual as they implement the new process.

Mike Doane can work magic when it comes to revitalizing a team—he has a knack for finding what’s broken and patching it up. His secret to revealing the holes in teams, processes, and systems? Using diagrams.
Mapping the current process in real time
Mike is an IT service delivery consultant for Taco Bell. He’s been in IT service delivery for 20 years, so he’s worked on his fair share of inefficient company processes.
When he comes into an organization, his first step is to dig deep. He wants to know absolutely everything about the team and how they function so that nothing is left to the imagination. After this information-gathering process, his next step is to map it all out.
Before discovering Lucidchart, Mike mapped out processes in Visio after his meetings with the customer—he didn’t have time to try and actually create his Visio diagram in front of the customer. The result was a disconnect between the information gathering and the diagramming.
With Lucidchart, these previously separate activities have become one efficient process. Mike schedules a meeting with the team and pulls up Lucidchart right away. As he and the team discuss their current processes and systems, Mike maps everything out on the fly right in front of the customer. “Lucidchart is much more intuitive and much, much, much quicker to use,” says Mike.
Mike is able to gather feedback instantaneously rather than emailing versions of the diagrams back and forth after the meeting. He says having this visual element front and center has “changed the conversation.” It helps remove mental blocks and get everyone talking. By going through the diagram together, both Mike and the clients can find the disconnects and inefficiencies hurting the company’s current processes.
 Mike explains the benefits of having visuals:
“Generally, processes exist in each person's mind in a different way. There are misunderstandings, but when you get everyone in the same room and you project it up on the screen and everyone's looking at it from a visual process or perspective, then you're able to have breakthroughs that you wouldn't have otherwise."
Presenting a polished process
After the meeting, Mike can spend time digesting the information he has gathered so he can design new and improved processes. His final deliverable usually consists of as-is and to-be diagrams with accompanying documentation, which allows the client to clearly understand the proposed changes.
And diagramming in Lucidchart versus Visio has been a game changer. Mike explains, “Lucidchart works the way that my brain always wanted Visio, Google Drawings, or SmartDraw to work.”

Finding the missing hyphen
Mike has completed this exercise for a variety of companies. In one instance, he was working with an IT support team that had a terrible reputation. Mike was brought in to turn things around, and at first he was stumped—the team seemed sharp and easy to work with, but customers kept complaining about their unresponsiveness.
So Mike gathered the team in a room and asked them to go through every single way they can receive a support request and the person responsible for monitoring each of these channels. He began mapping out every incoming method in and the responsible party in Lucidchart.
In the course of building this diagram, Mike and the team realized there was one email address that wasn’t being monitored. Mike gained access to the mailbox and found thousands of unread emails requesting support—the issue had been going on for around two years. He also discovered that the email had been put into an IT department letterhead that was used to send departmental updates. The address looked very similar to the email address the team was monitoring—it included just one extra hyphen. Mike explains:
“You would think someone should have caught that. But they never did. There were so many different ways that people could request support. One little hyphen was causing all these problems. We were able to fix it just by mapping everything in Lucidchart with everyone in a room talking. Lucidchart helps get people to break through mental barriers and identify blind spots that exist in processes.”
Diagrams that live on
Mike’s clients love his diagrams. Delivering solutions through Lucidchart is different than his just talking through the process and throwing out his ideas on what to change. According to Mike, that method just doesn’t quite push it across the finish line. Lucidchart helps the team understand new processes more easily and implement them successfully.
As Mike travels from company to company improving processes, you’ll find a trail of diagrams in his wake. Mike says:
“The cool thing about Lucidchart is that you’re able to give a finished product that lives on even after I leave the team. Hopefully they’re still using the Lucidchart documents today—that’s my goal."