Обеспечение совместной работы ИТ-команд с системами
Проектирование, документирование и оптимизация технологической инфраструктуры в пакете приложений Lucid. Обеспечьте каждому инструменты, необходимые для достижения успеха.
Разработка и внедрение эффективных решений
Обсуждение и планирование с заинтересованными сторонами развертывания сложного аппаратного и программного обеспечения. Согласовывайте приоритеты и сроки.
Как ИТ-команды используют Lucid
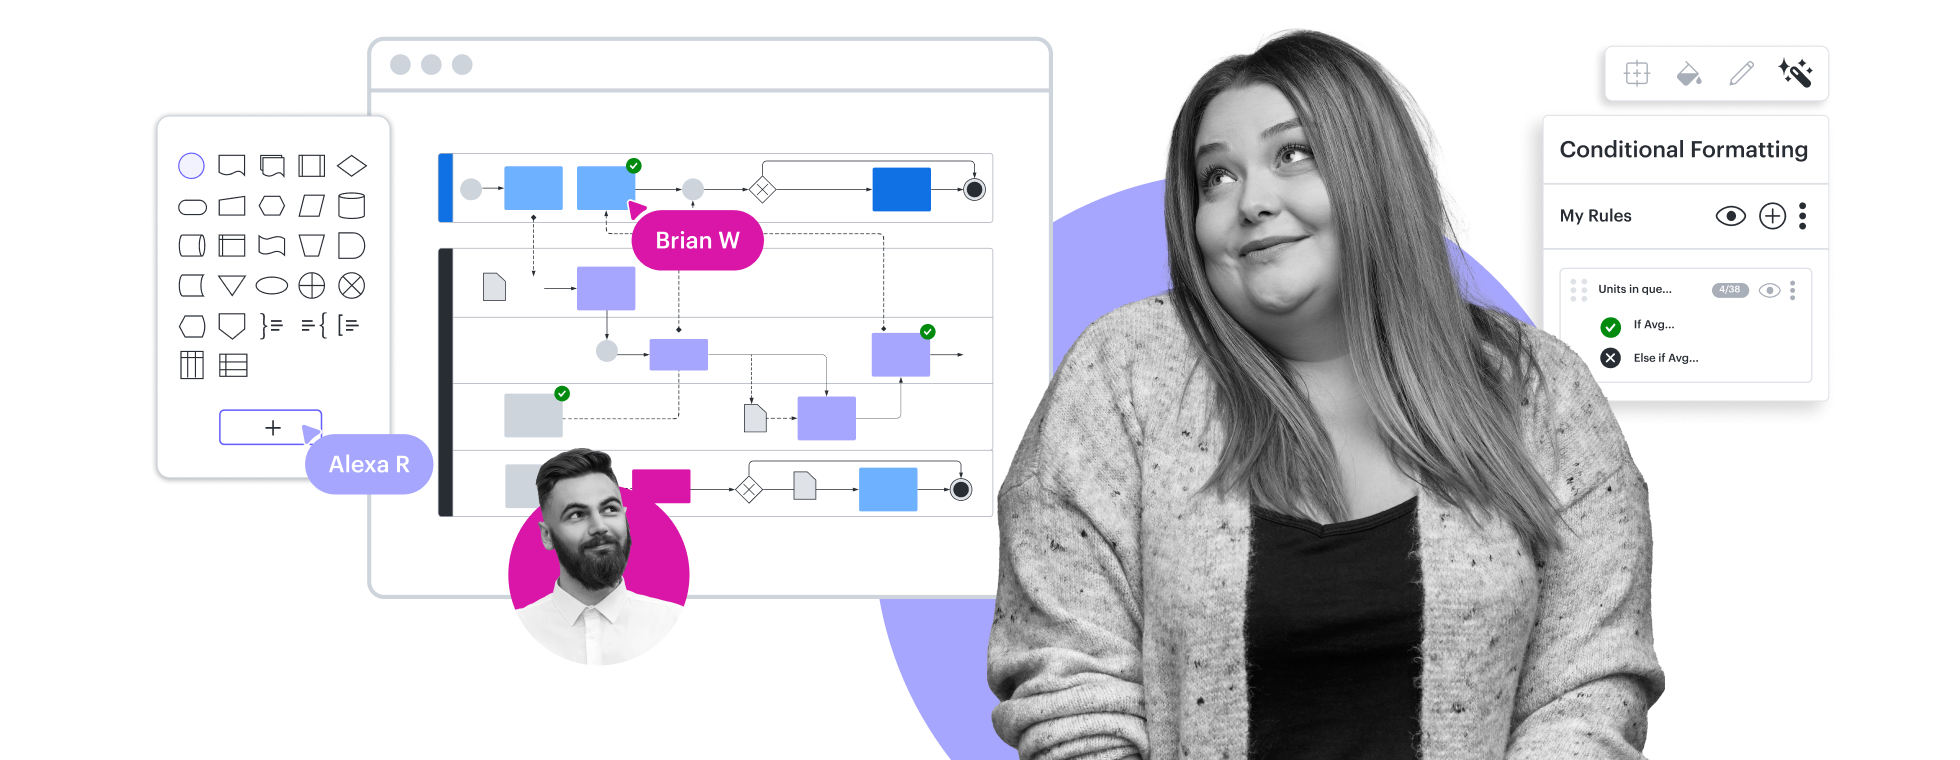
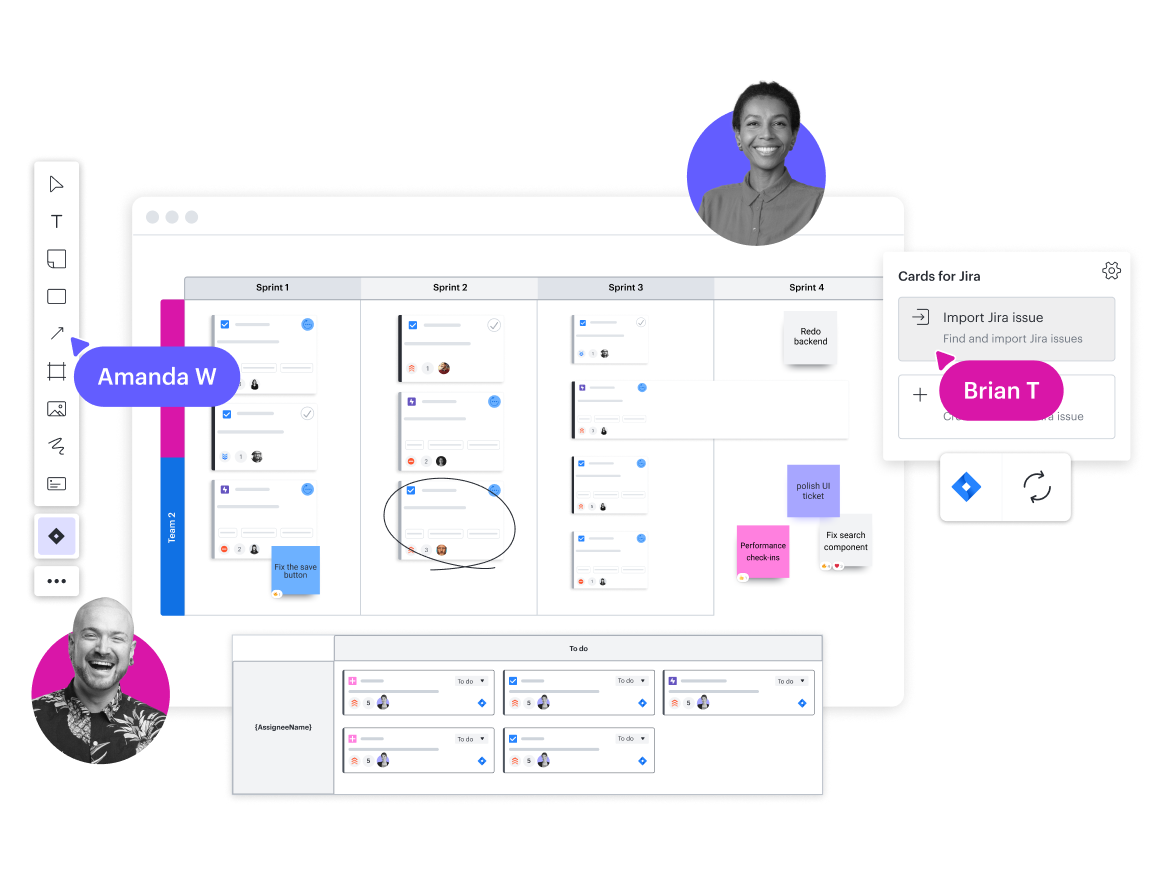
Разработка процессов подачи заявки на проведение работ
Визуализируйте поток с помощью пользовательских фигур для введения в курс дела новых сотрудников. Совершенствуйте процесс с помощью комментариев и задач.
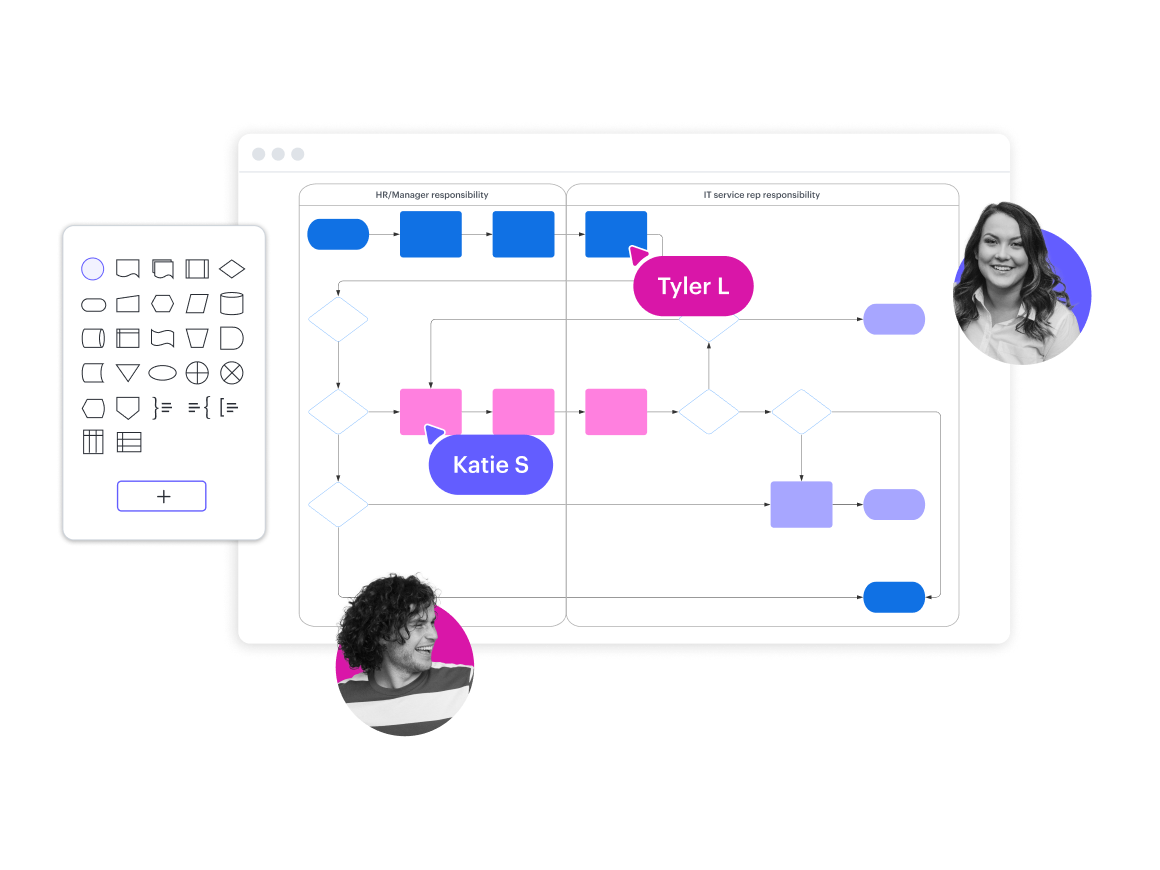
Создание дорожных карт
Работайте с кросс-функциональными командами, чтобы приоритизировать проекты и устанавливать сроки. Упростите планирование с помощью интеграций Jira и Azure DevOps.
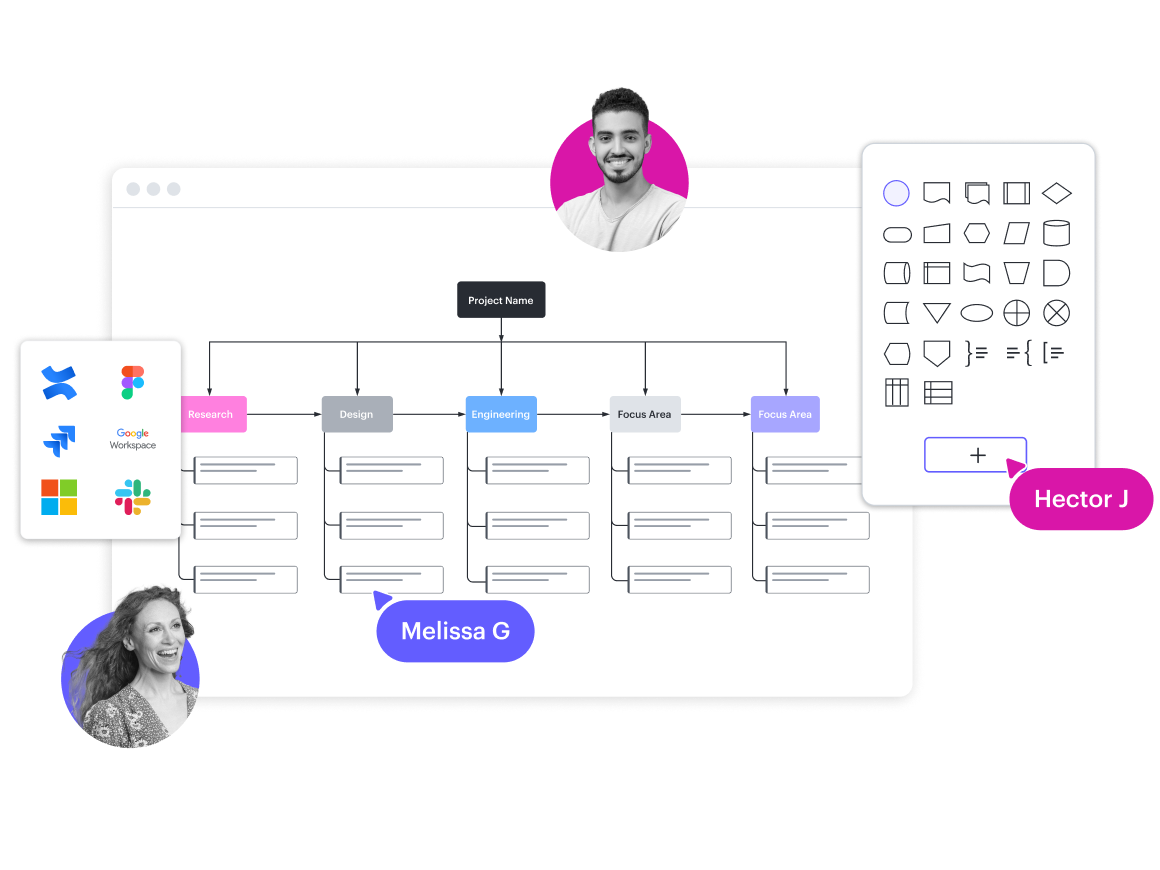
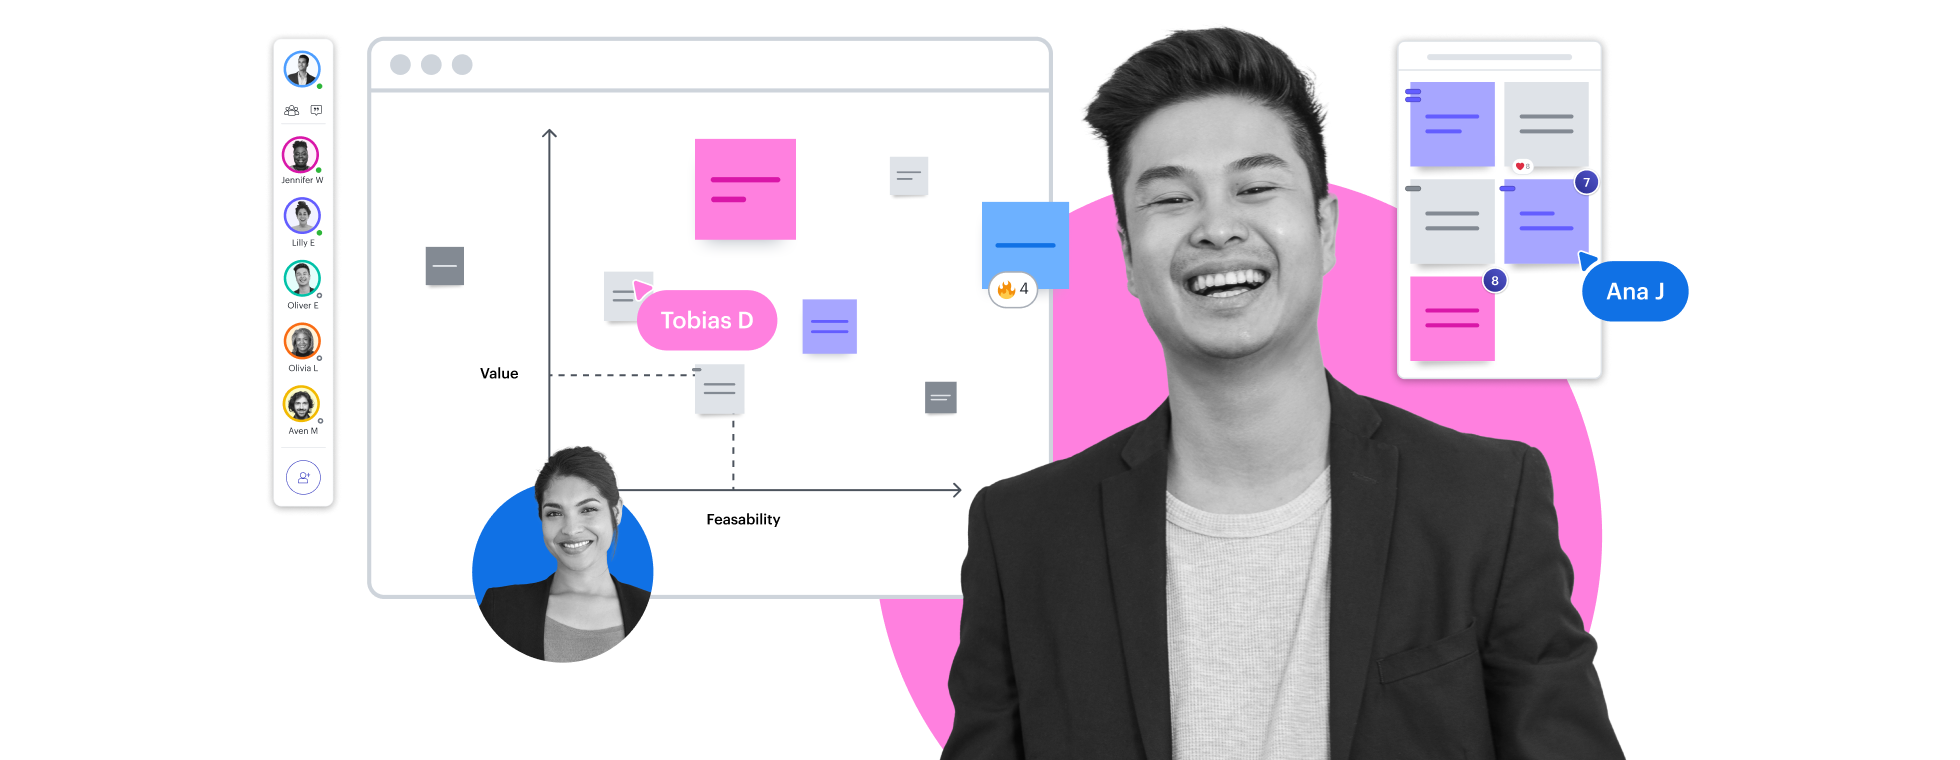
Оптимизируйте стратегическое планирование
Используйте визуальные опросы для ранжирования приоритетов и достижения консенсуса. Разбивайте сложные проекты на простые задачи с помощью карточек Lucid.
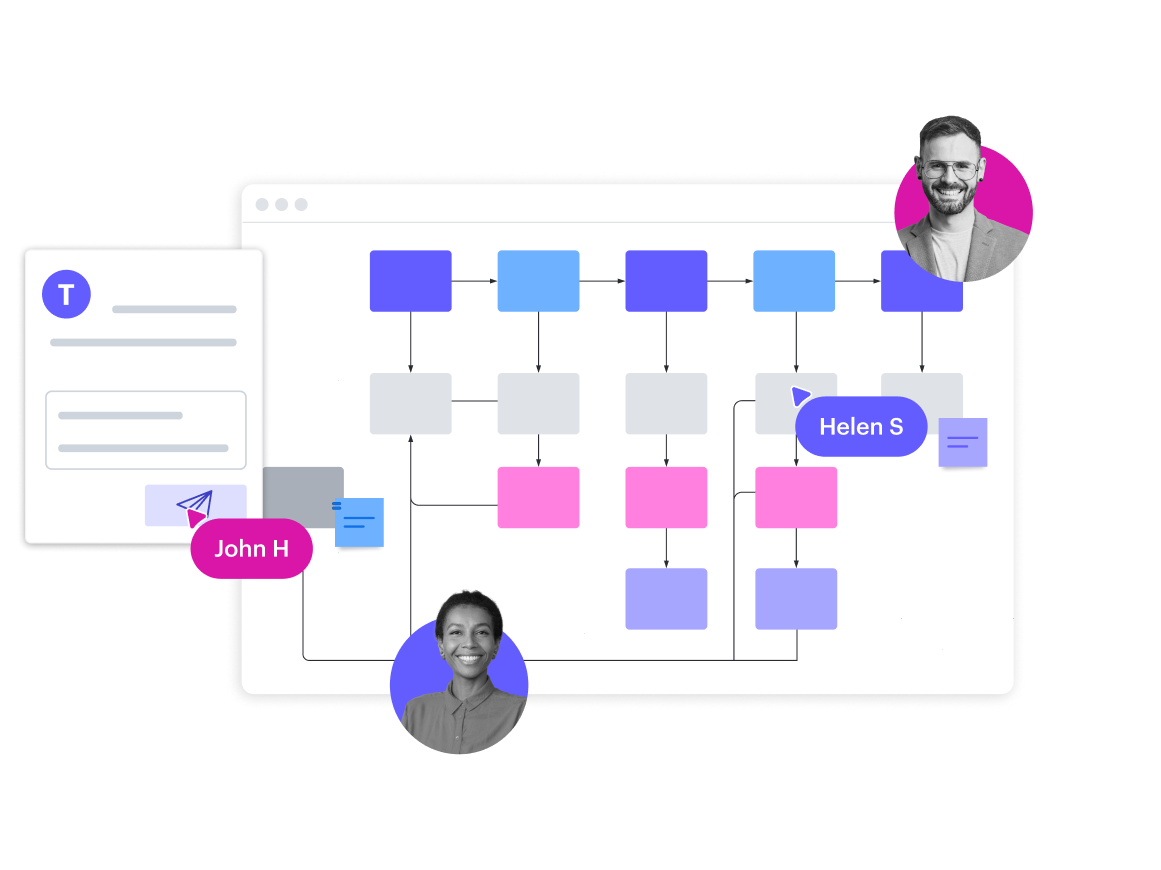
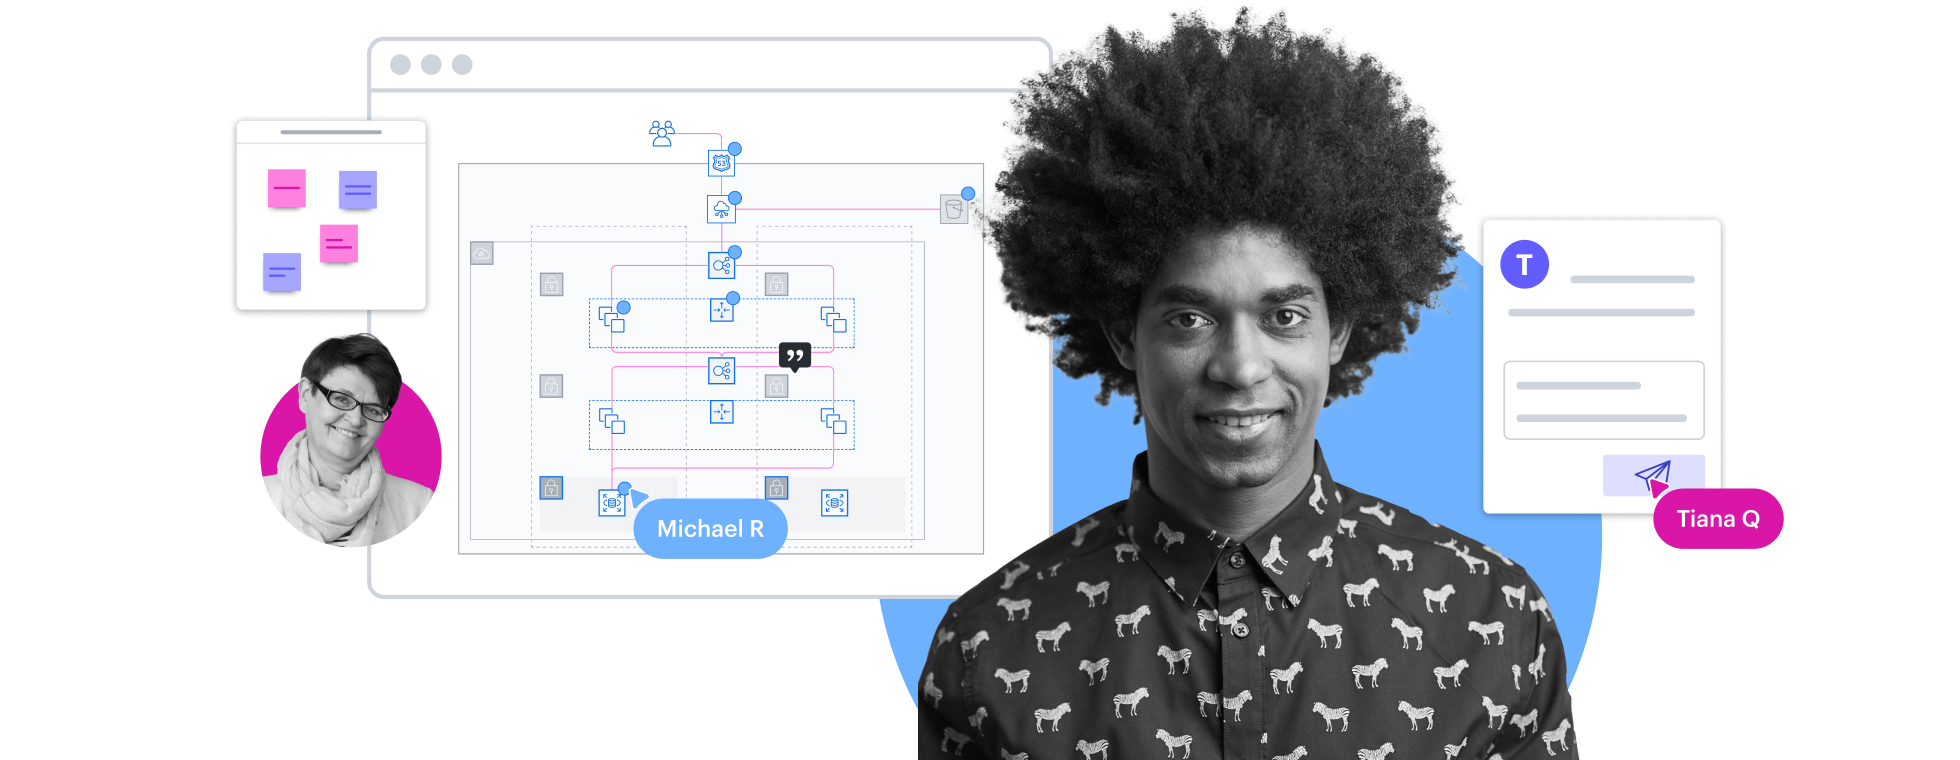
Оптимизация конвейера CI/CD
Визуализируйте путь развертываемой единицы для непрерывной интеграции и доставки, чтобы легко выявлять улучшения.
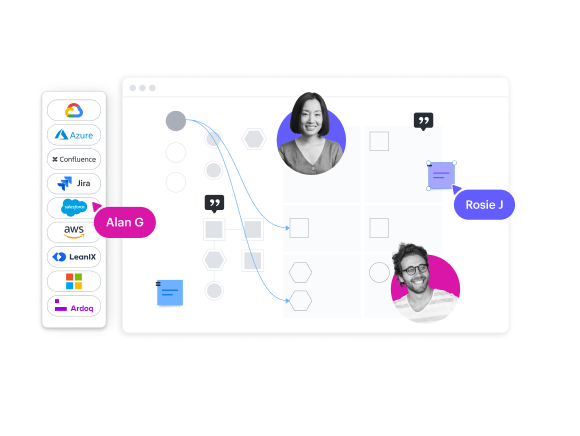
Создание документации для проверок безопасности
Подключитесь к поставщику облачных услуг (AWS, Azure или Google Cloud), чтобы автоматически создавать схемы облачной инфраструктуры для ежегодной проверки безопасности.
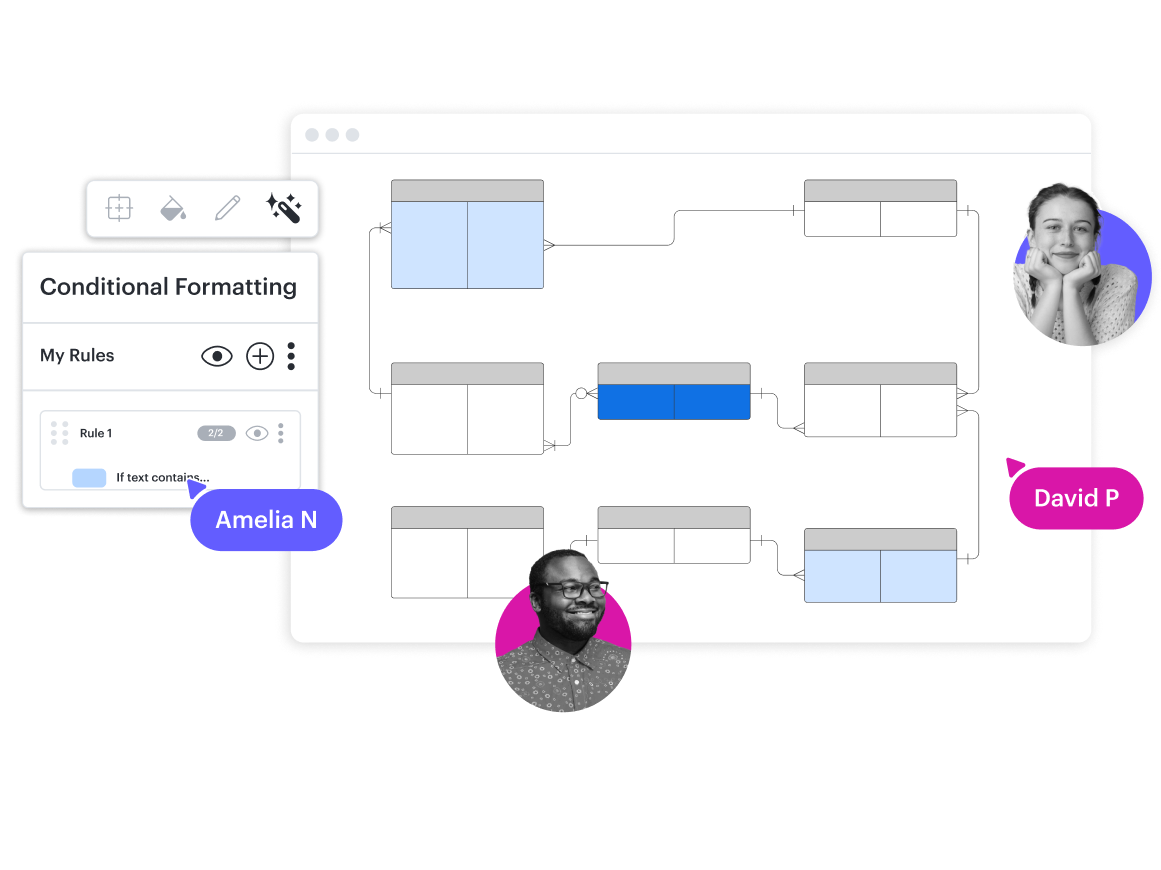
Визуализация связей между сущностями
Схематизируйте и документируйте связи между внутренними инструментами. Используйте интеграцию Confluence для встраивания схем в базу знаний.
«Нам важно, чтобы индивидуальные наработки консультантов и результаты успешных проектов не затерялись где-нибудь среди папок. Дело в том, что для работы над каждым проектом консалтинговые компании, как правило, собирают отдельную команду, на чьи плечи ложится титанический труд. Но как только проект заканчивается, команда тут же переключается на следующую задачу, а про прежние наработки все забывают».