Zorg ervoor dat IT-teams en -systemen samenwerken
Ontwerp, documenteer en optimaliseer je technologische infrastructuur binnen het pakket voor visuele samenwerking van Lucid. Zorg ervoor dat iedereen over de benodigde tools beschikt om te slagen.

Ontwikkel en implementeer effectieve oplossingen
Werk samen met belanghebbenden om te brainstormen en complexe hardware- en software-implementaties te plannen. Stem prioriteiten en tijdlijnen onderling af.
Hoe IT-teams Lucid gebruiken
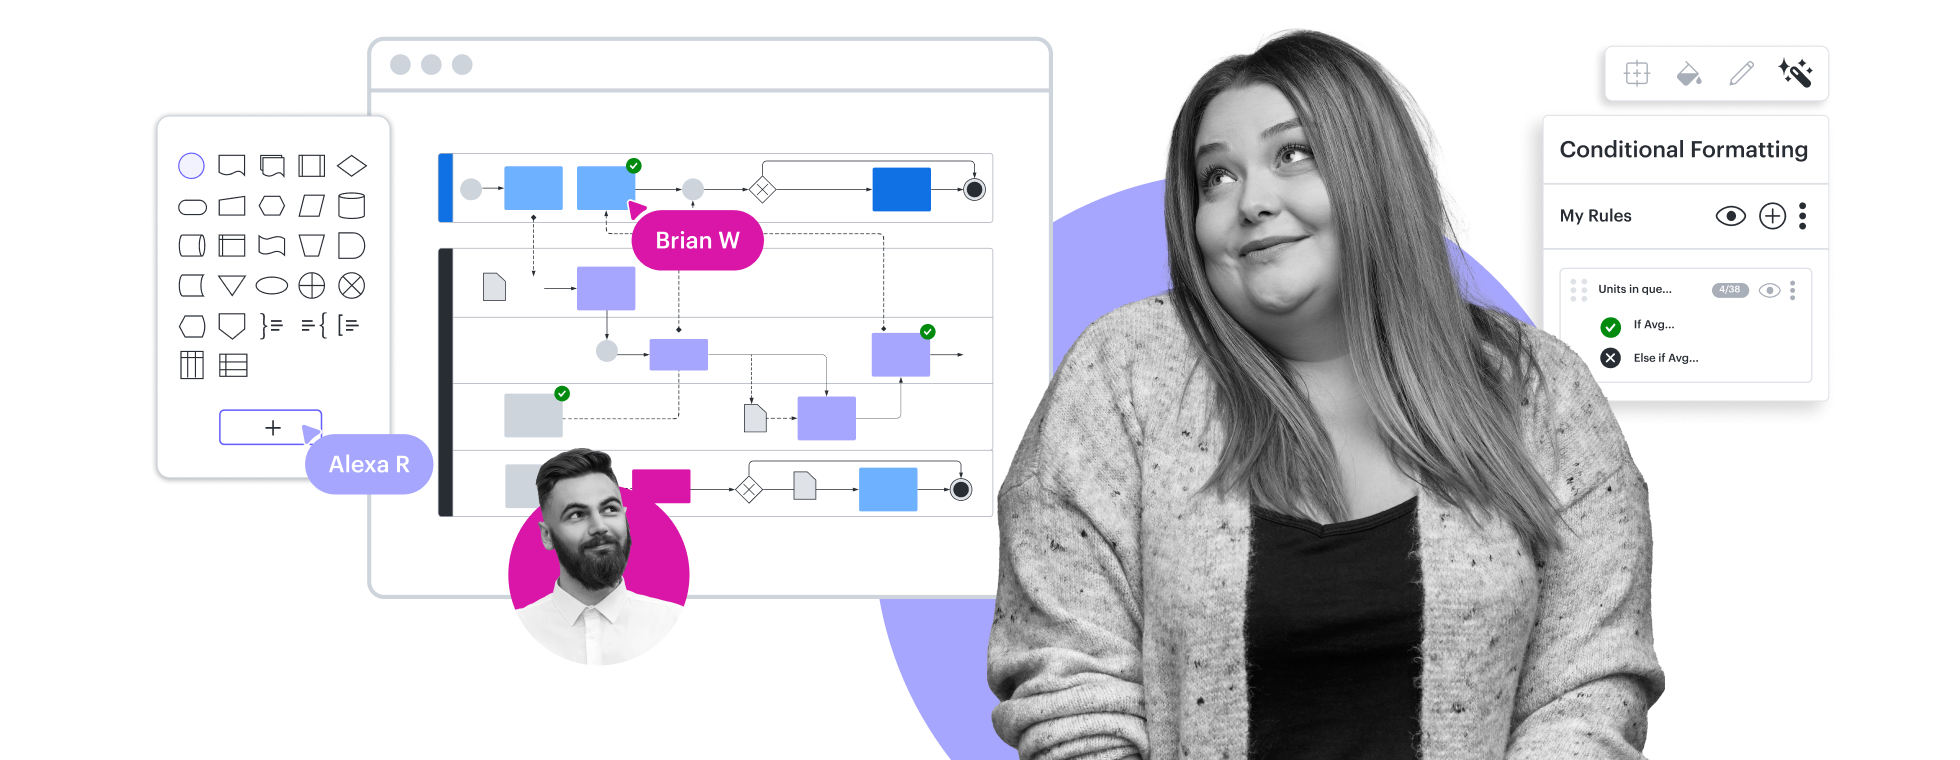
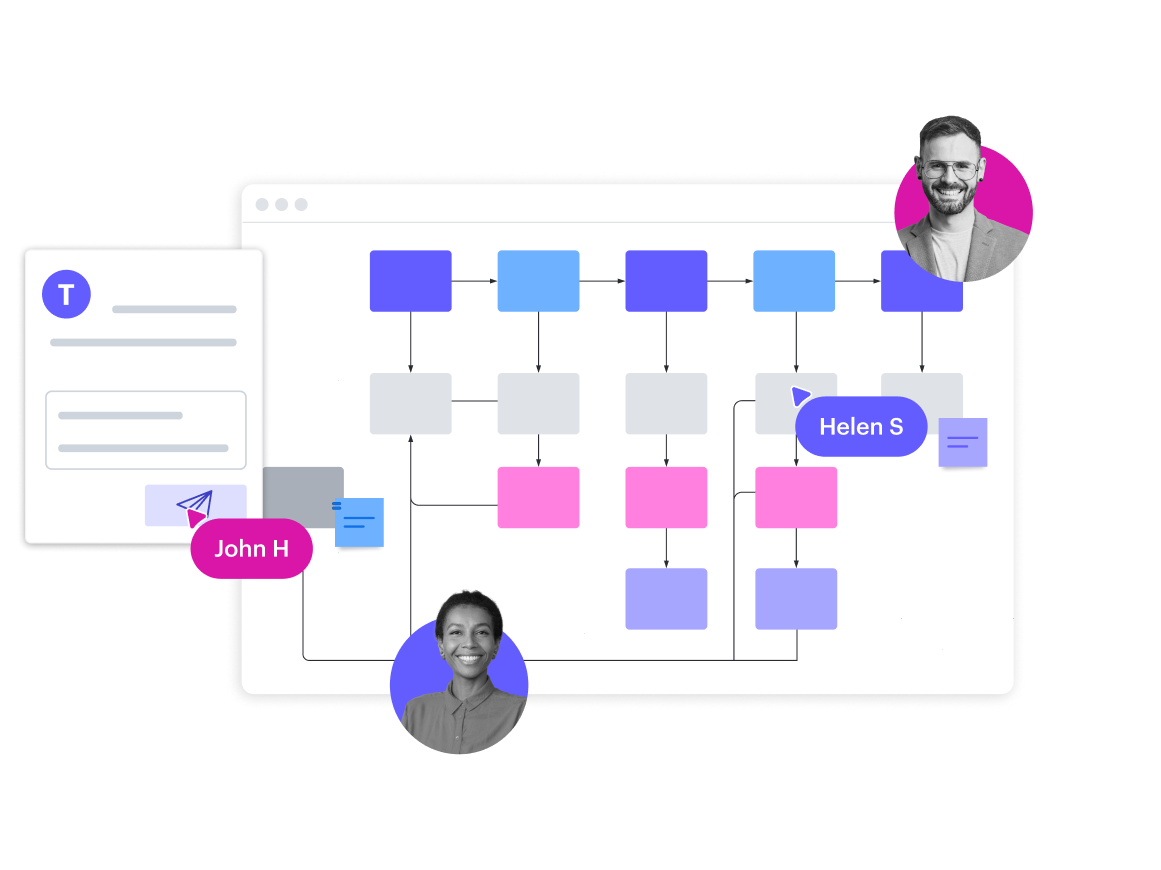
Werkorderprocessen ontwerpen
Gebruik aangepaste vormen om een stroom voor de onboarding van nieuwe medewerkers te visualiseren. Verbeter je proces door opmerkingen achter te laten en taken toe te wijzen.
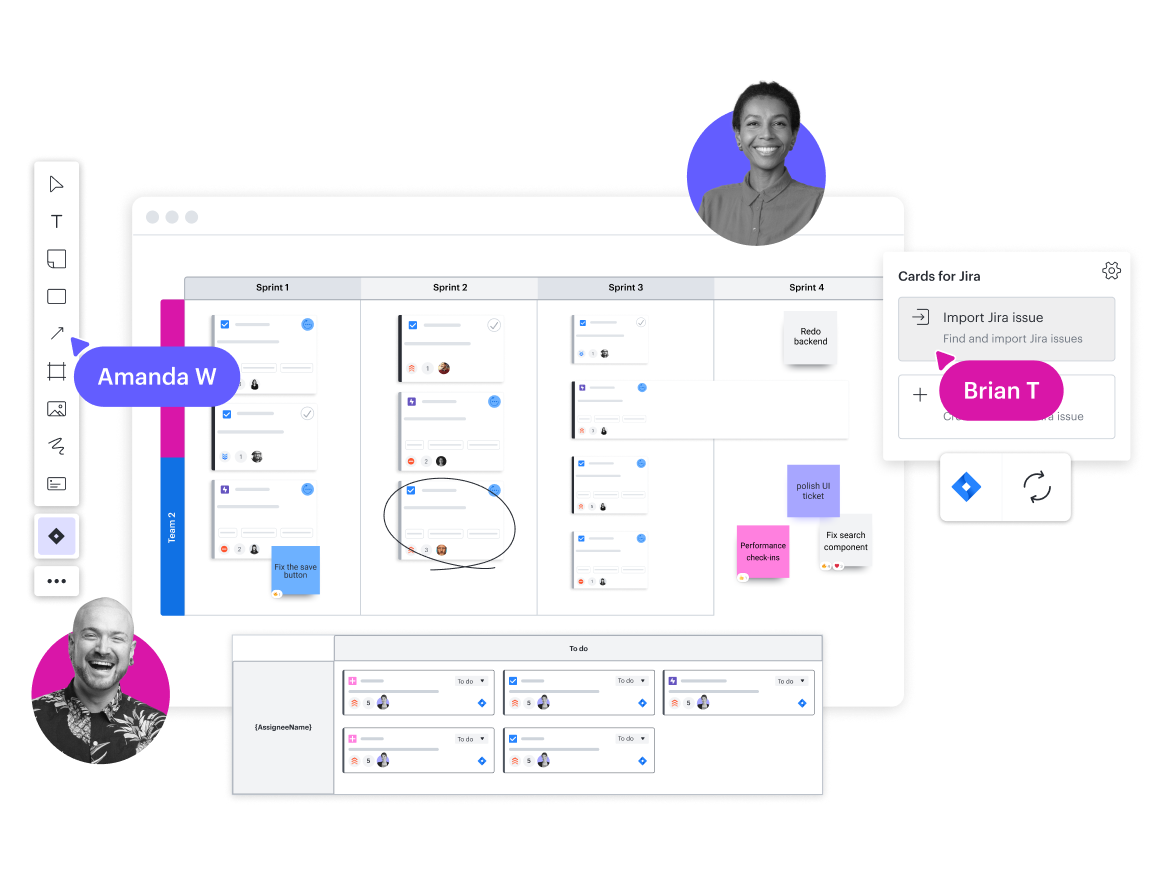
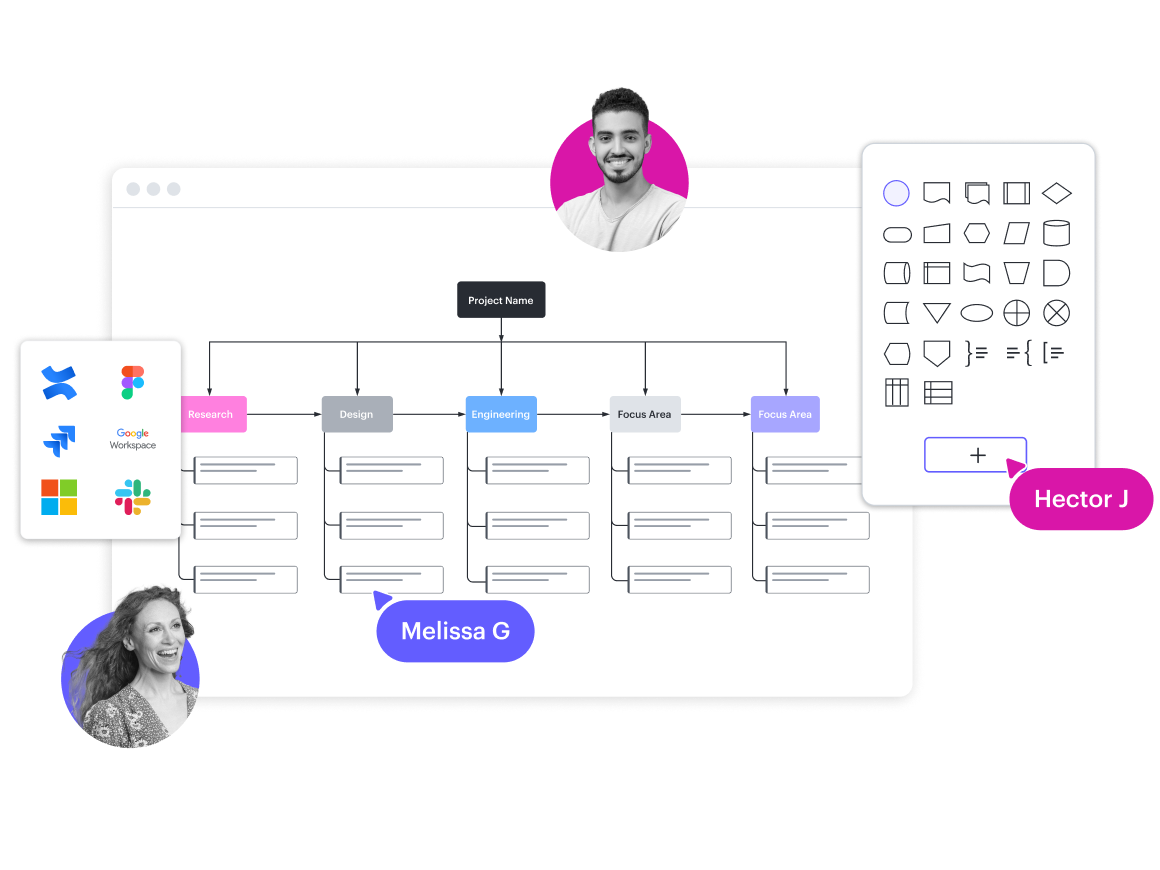
Roadmaps maken
Werk samen met functieoverschrijdende teams om prioriteiten te stellen aan projecten en tijdlijnen te maken. Maak naadloos plannen met Jira- en Azure DevOps-integraties.
Stroomlijn strategische planning
Gebruik visuele activiteiten om prioriteiten te rangschikken en consensus te bereiken. Verdeel complexe projecten in beheersbare taken met Lucid kaarten.
Optimaliseer je CI/CD-pijplijn
Visualiseer het pad met inzetbare eenheden voor continue integratie en continue levering, zodat je eenvoudig verbeteringen kunt identificeren.
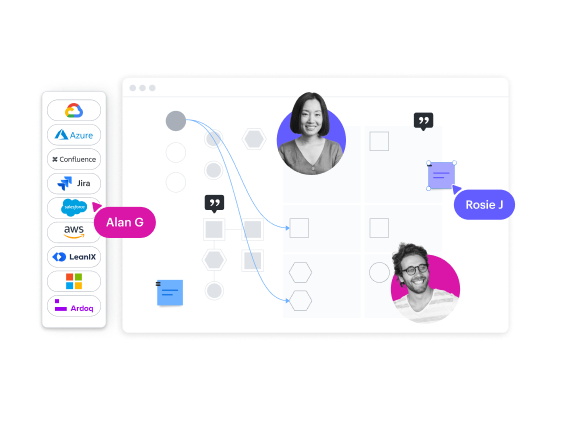
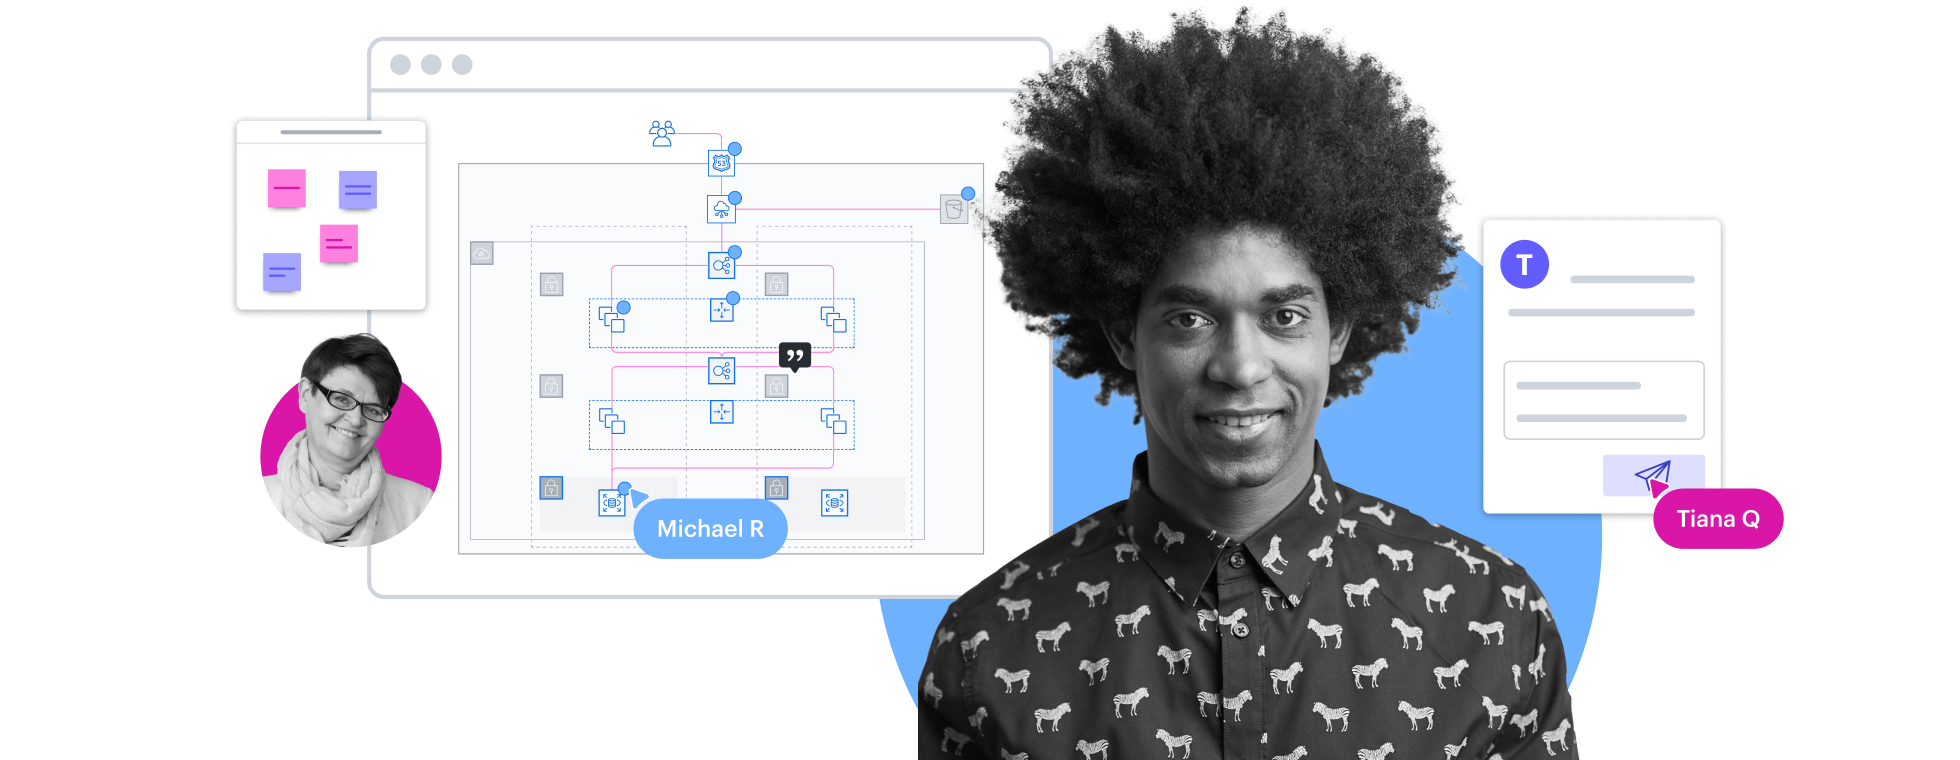
Maak documentatie voor beveiligingsaudits
Maak verbinding met je cloudprovider—AWS, Azure of Google Cloud—om automatisch een diagram te maken van je cloudinfrastructuur voor jaarlijkse beveiligingsaudits.
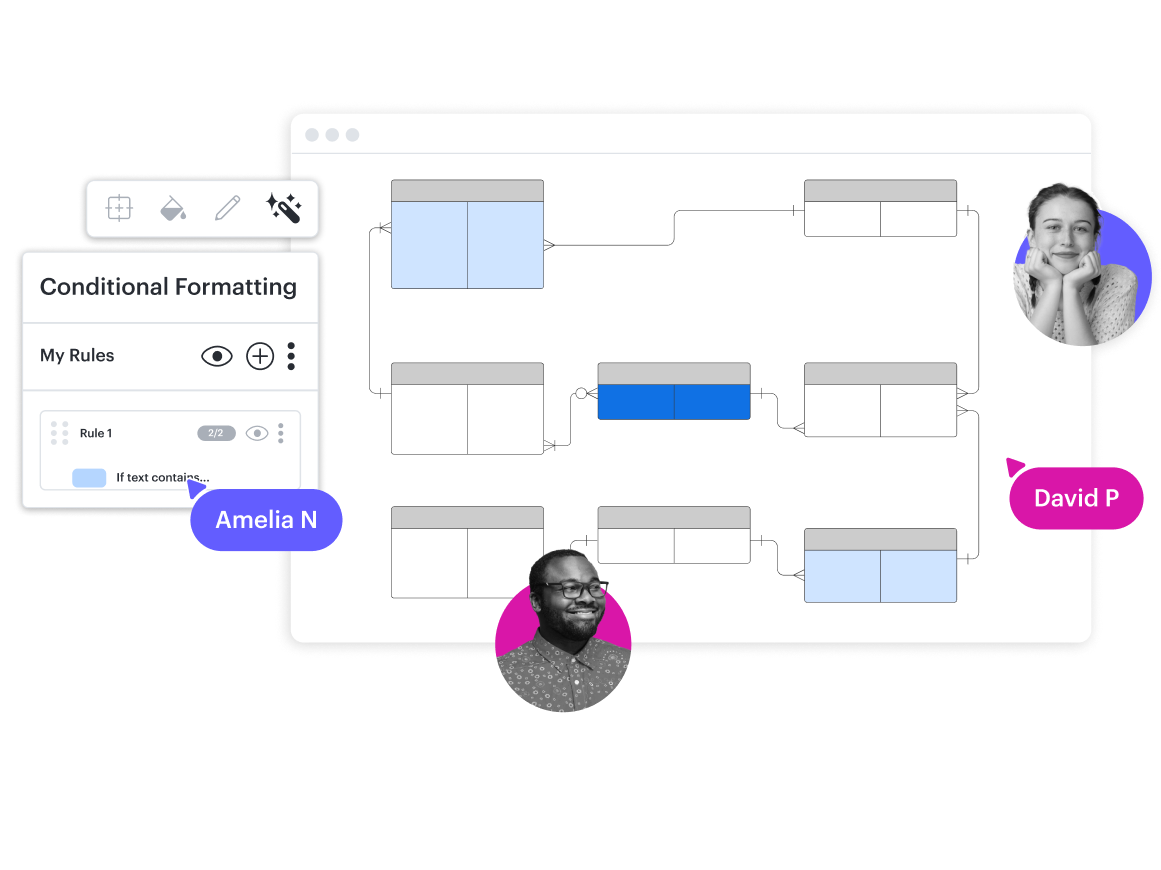
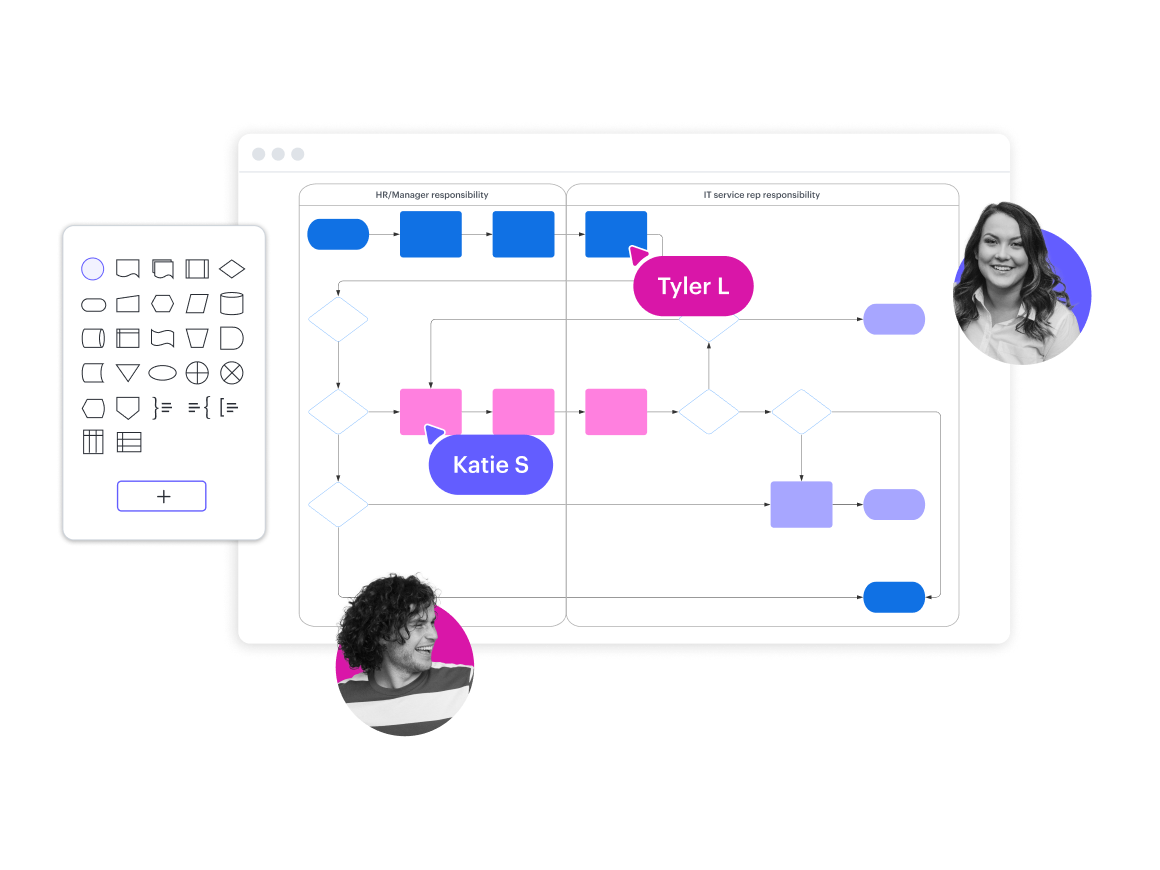
Visualiseer relaties tussen entiteiten
Maak een diagram en documenteer de relatie tussen interne tools. Integreer met Confluence om diagrammen in je kennisbank op te nemen.
"We probeer ervoor te zorgen dat verworven kennis van een individuele consultant of uit een succesvol project niet verloren gaat. Wat er bij een adviesbureau meestal gebeurt is dat een team heel hard aan de slag gaat met een project, en nadat het project voltooid is, gaan ze verder met het volgende. De leerpunten en uitkomsten worden vergeten."