Se till att IT-team och system arbetar tillsammans
Designa, dokumentera och optimera den tekniska infrastrukturen i Lucids visuella samarbetssvit. Se till att alla har verktygen de behöver för att lyckas.

Utveckla och implementera effektiva lösningar
Samarbeta med intressenter för att brainstorma och planera komplexa utrullningar av maskin- och programvara. Samlas kring prioriteringar och tidslinjer.
Hur IT-team använder Lucid
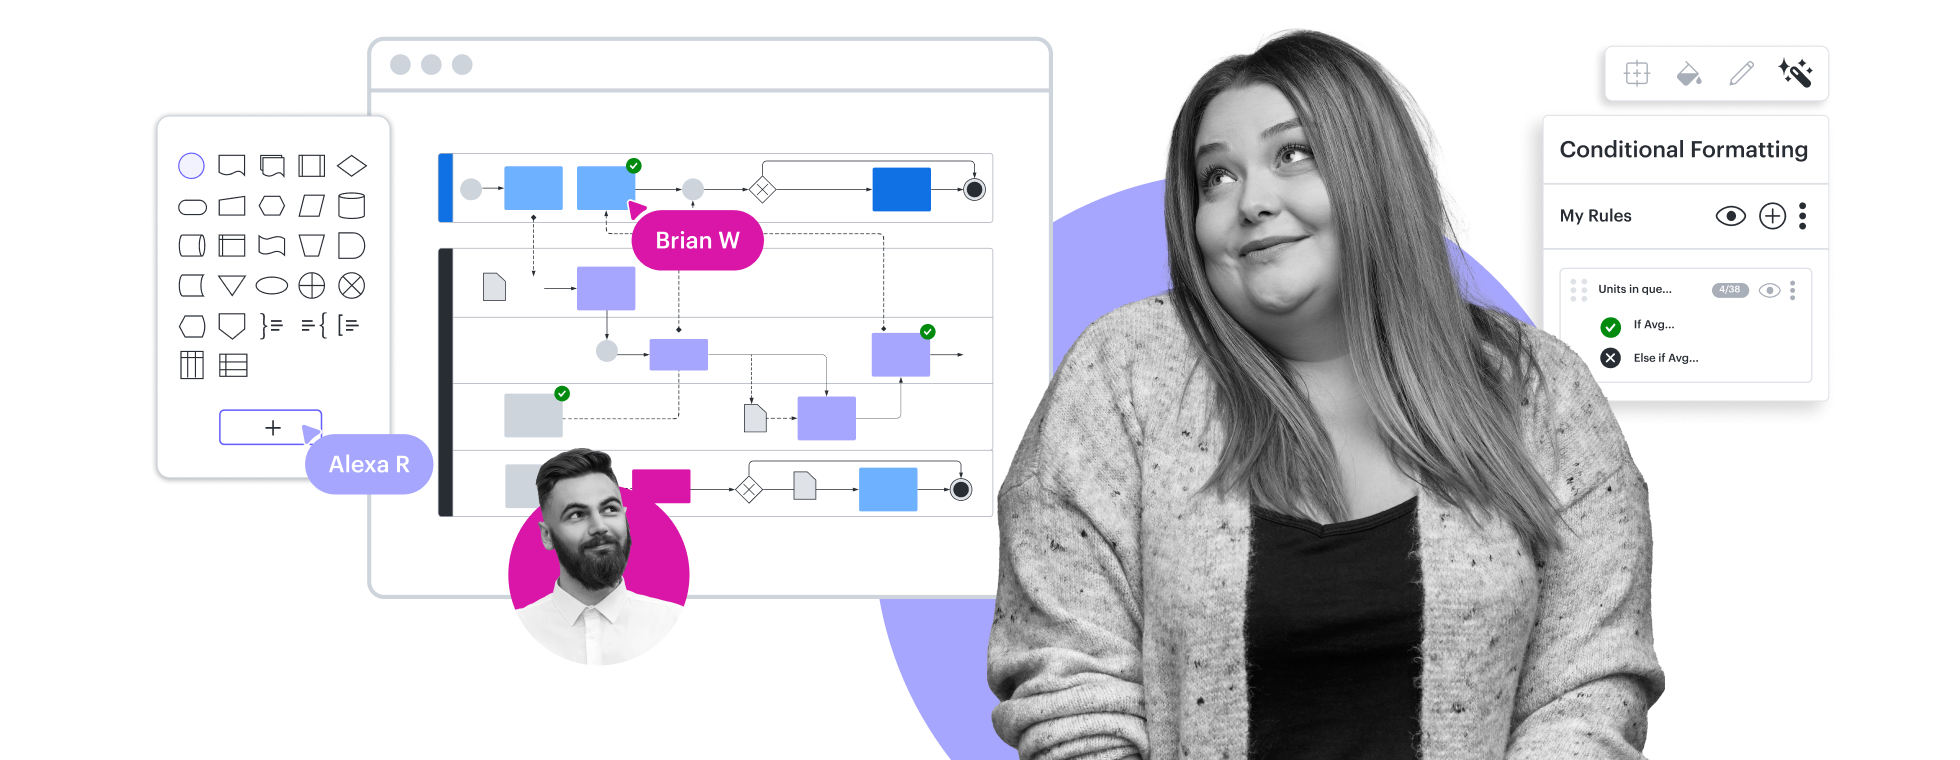
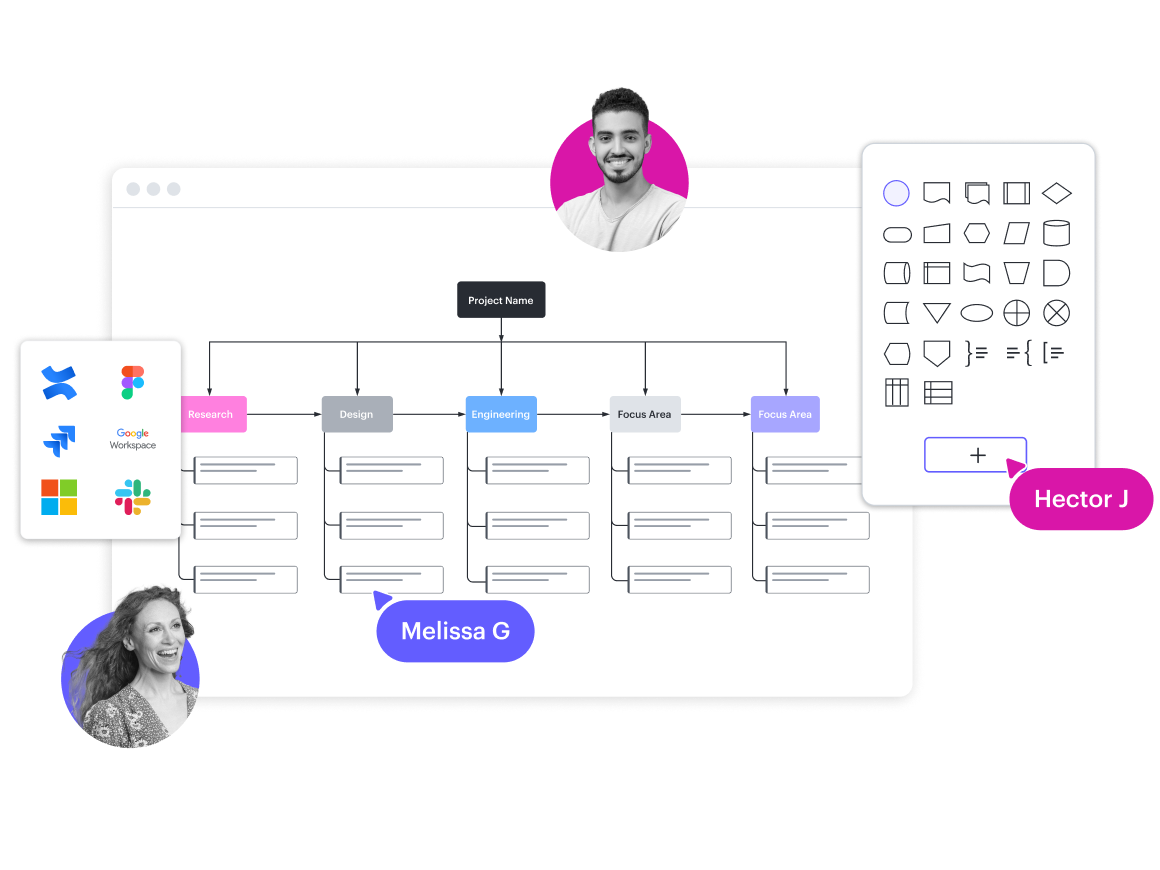
Utforma processer för arbetsorder
Använd anpassade former för att visualisera ett flöde för introduktion av nya medarbetare. Förbättra din process med kommentarer och uppgifter.
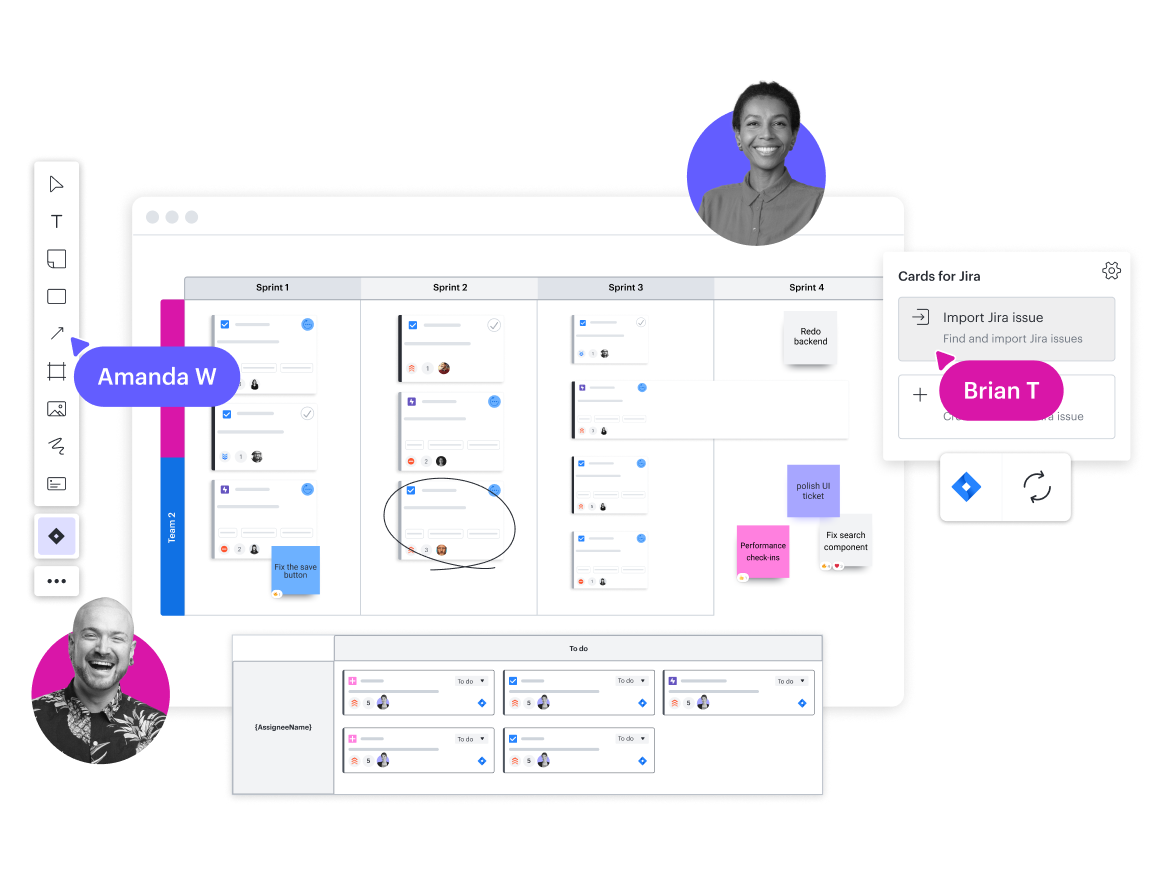
Skapa färdplaner
Arbeta med tvärfunktionella team för att prioritera projekt och skapa tidslinjer. Gör planeringen smidig med Jira- och Azure DevOps-integrationer.
Effektivisera den strategiska planeringen
Använd visuella aktiviteter för att rangordna prioriteringar och nå konsensus. Dela upp komplexa projekt i hanterbara uppgifter med Lucid-kort.
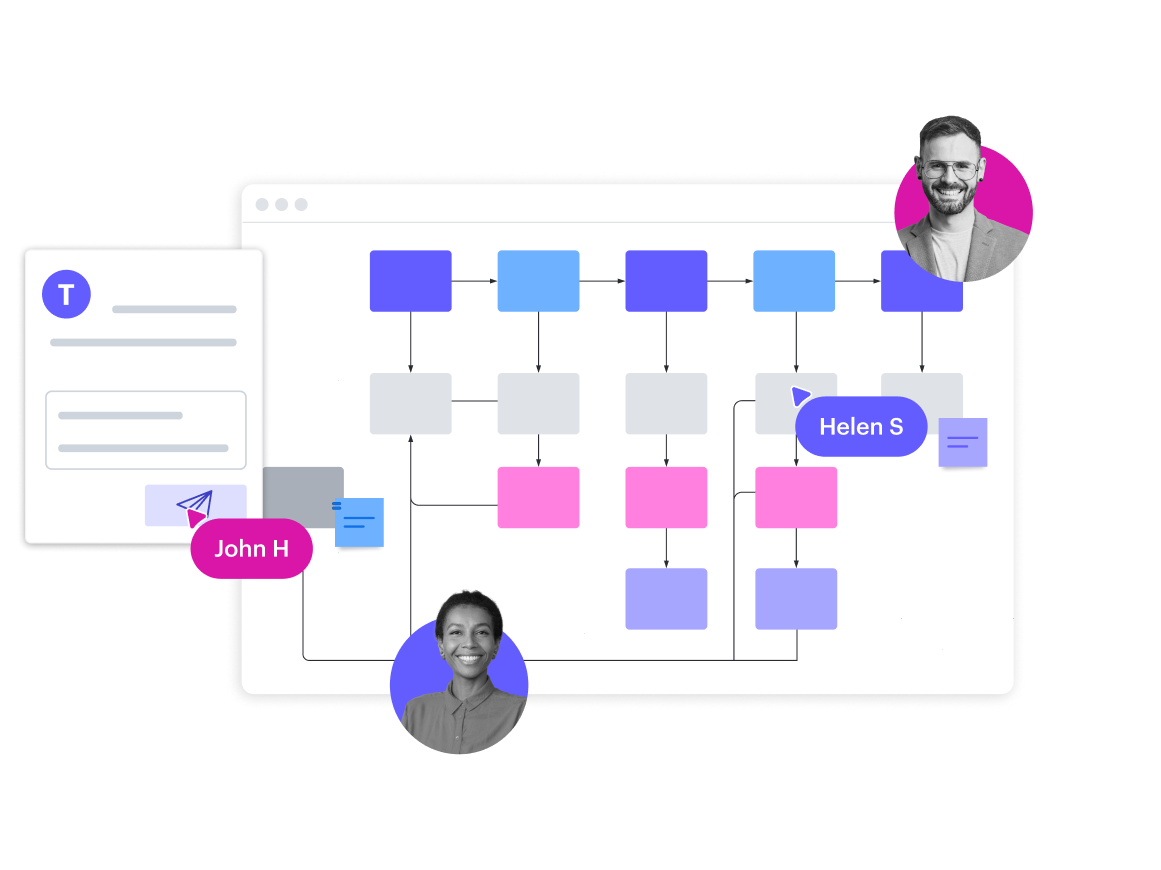
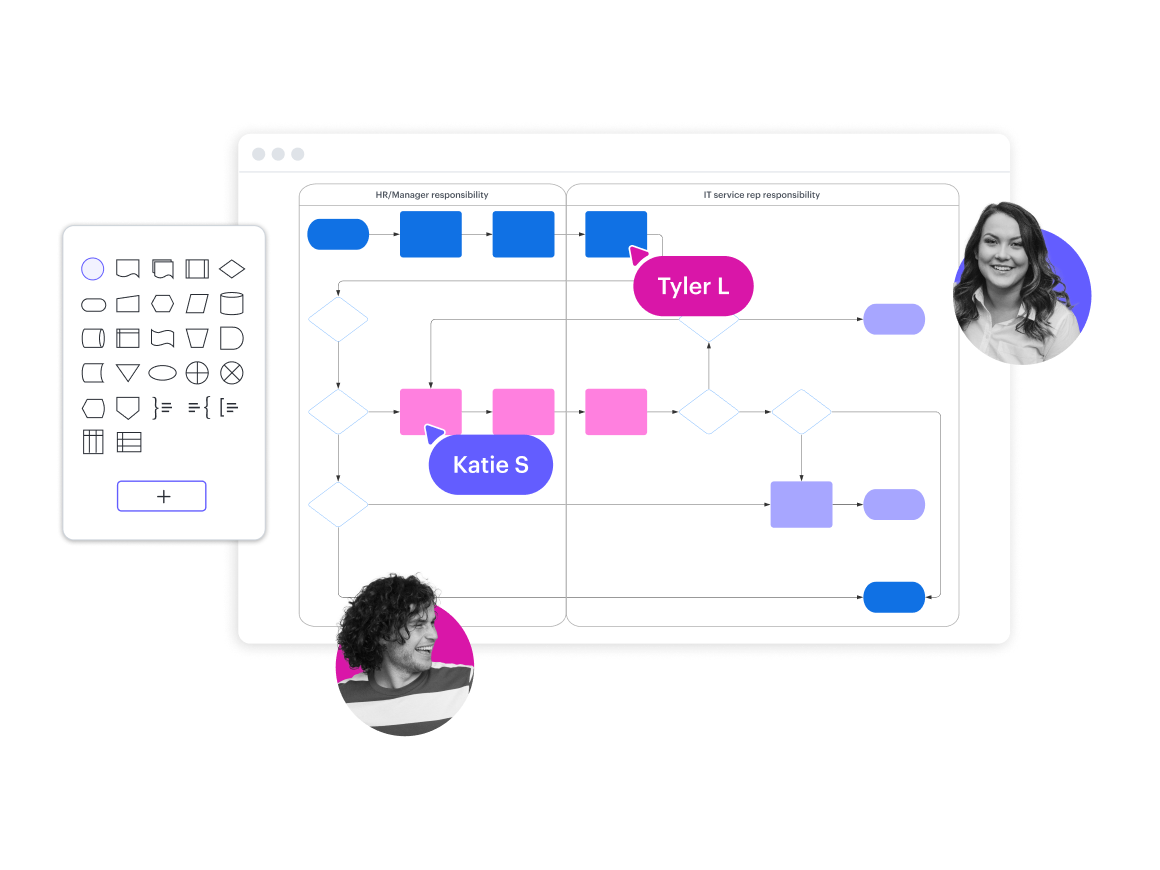
Optimera din CI/CD-pipeline
Visualisera processen för att distribuera enheter för kontinuerlig integration och kontinuerlig leverans i syfte att enkelt identifiera möjliga förbättringar.
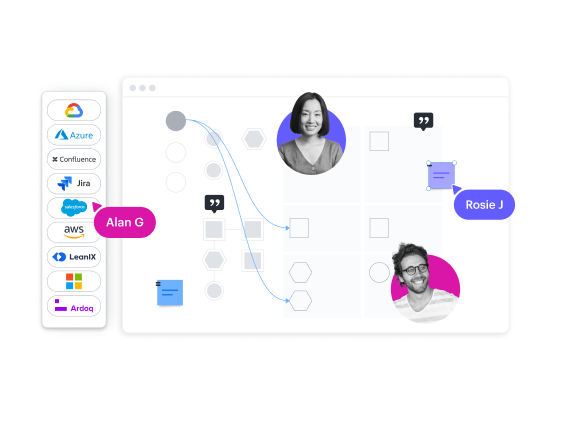
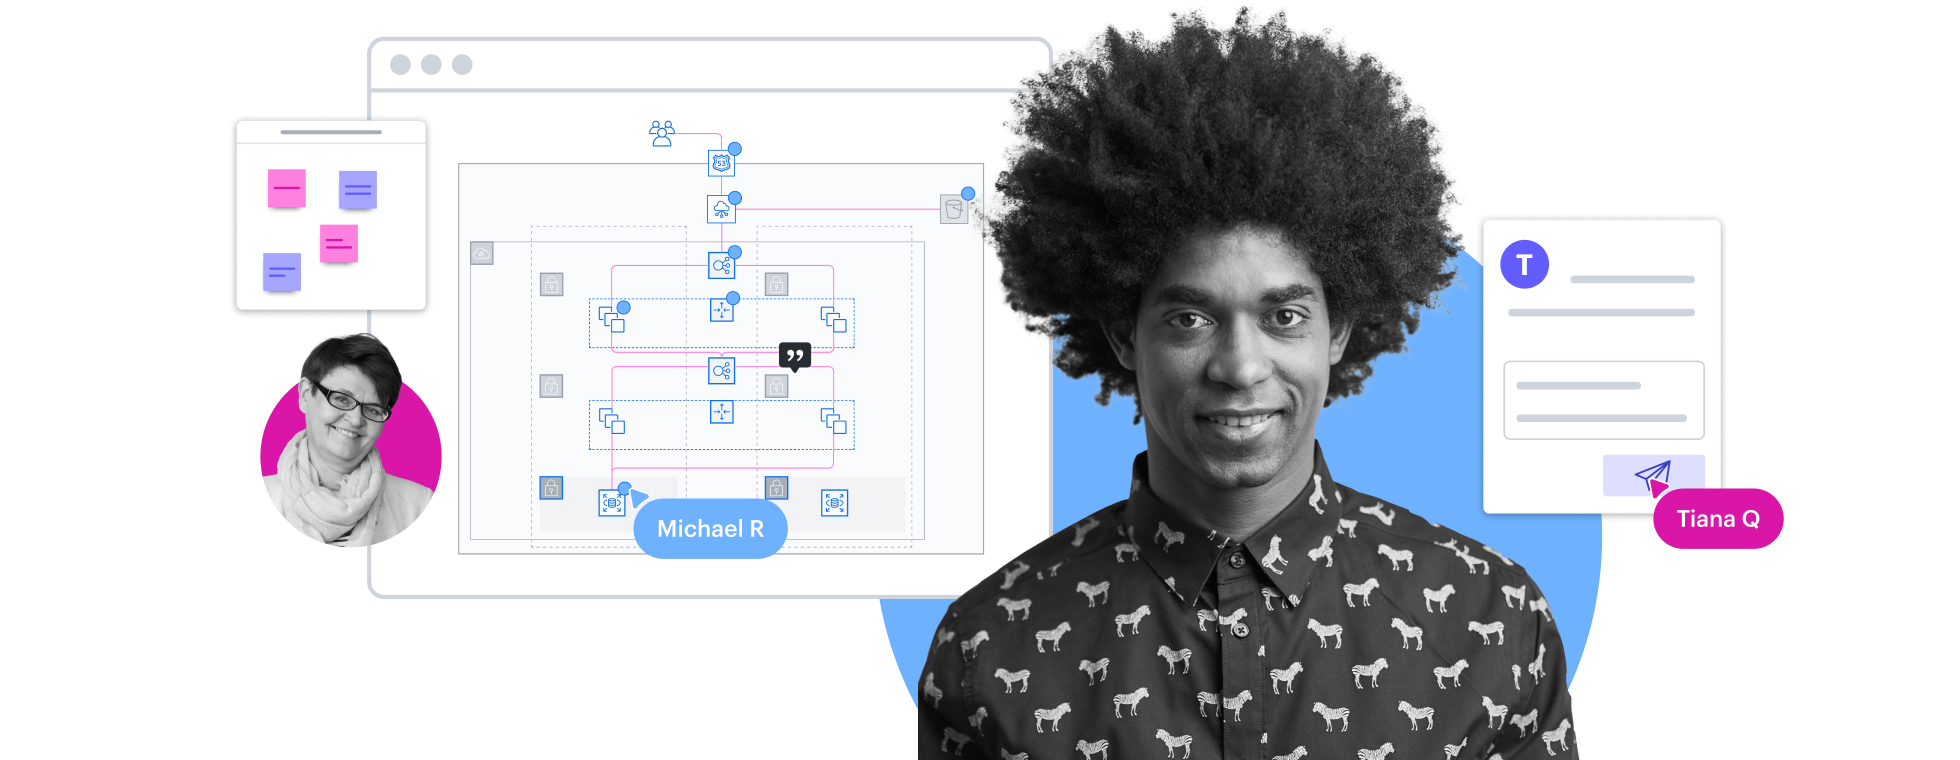
Skapa dokumentation för säkerhetsrevisioner
Anslut till din molnleverantör – AWS, Azure eller Google Cloud – för att automatiskt skapa diagram över din molninfrastruktur för årliga säkerhetsrevisioner.
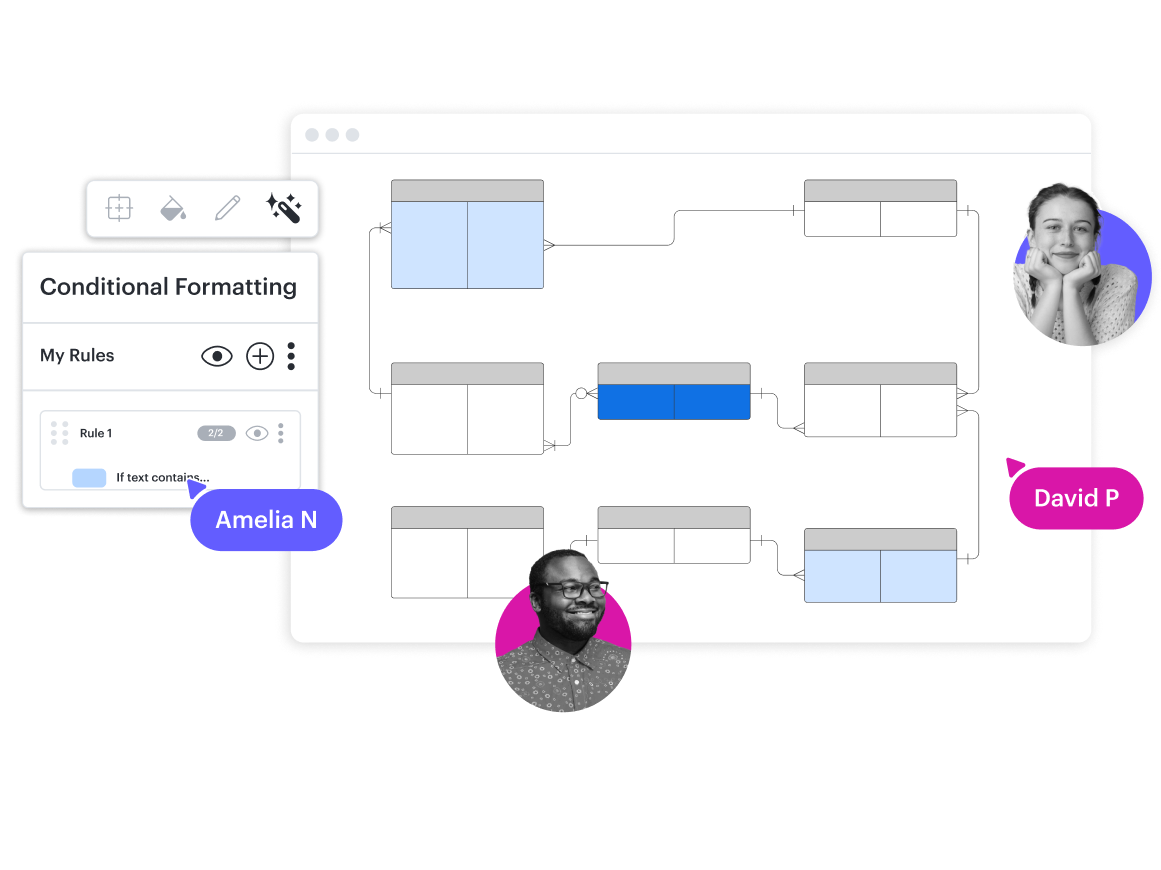
Visualisera relationer mellan enheter
Kartlägg och dokumentera förhållandet mellan interna verktyg. Integrera med Confluence för att bädda in diagram i din kunskapsbas.
”Vi försöker se till att lärdomarna från en enskild konsult eller resultatet av ett framgångsrikt projekt inte bara går förlorade. Inom konsultbranschen finns det en tendens att projektteam arbetar riktigt hårt för att leverera ett projekt, men när projektet är slut så går alla vidare till nästa uppdrag. Lärdomarna och resultaten tappas bort.”