Ge ingenjörsteamet kraft att vara tydliga
Se och förstå flödet av idéer, system och processer i Lucids visuella samarbetssvit. Fatta välgrundade beslut snabbare för att driva innovationer.


Se data och komplexa system i sina sammanhang
Förvandla komplexitet till möjligheter med hjälp av intelligenta bilder. Få en djupare förståelse av problem och deras lösningar.
Hur teknikteam använder Lucid
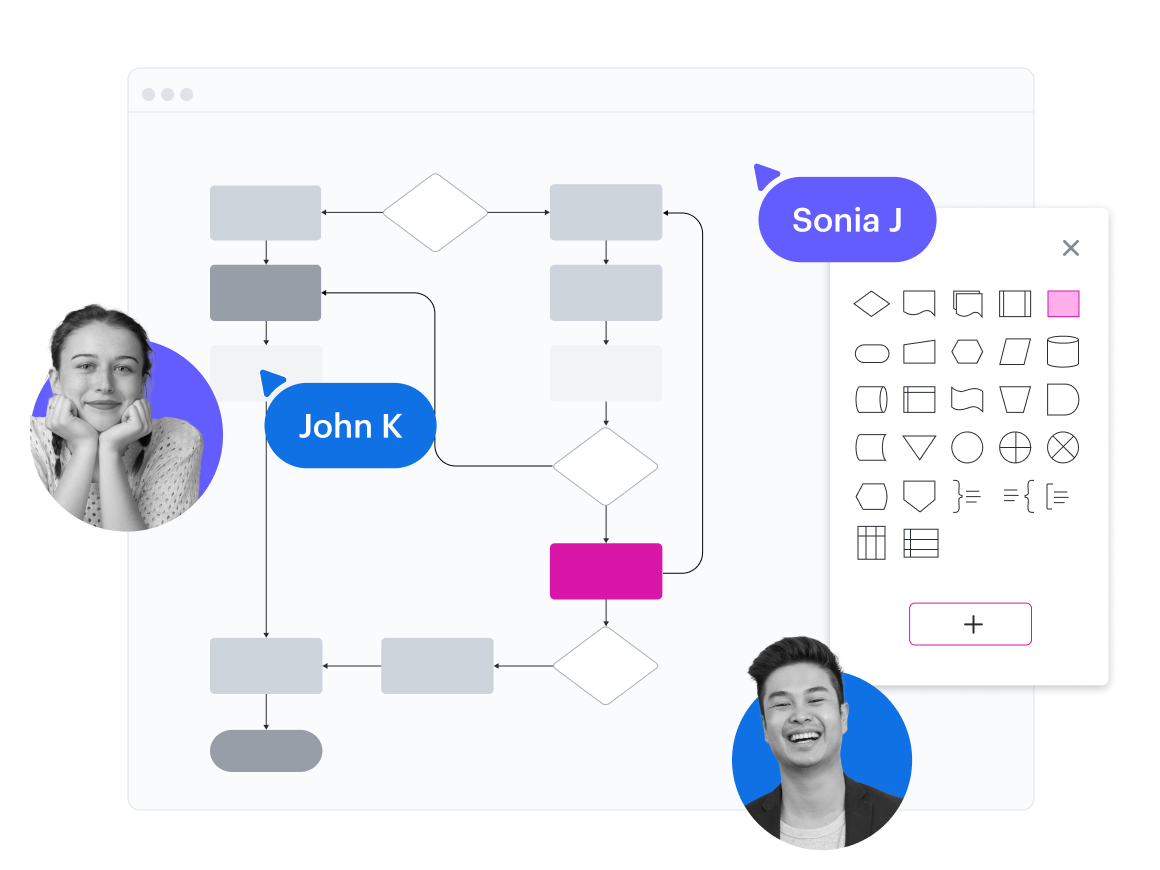
Skapa steg-för-steg-processer
Samarbeta för att brainstorma och rita upp stegen i en algoritm. Använd villkorlig formatering för att lägga till färger och förbättra det visuella stödet.
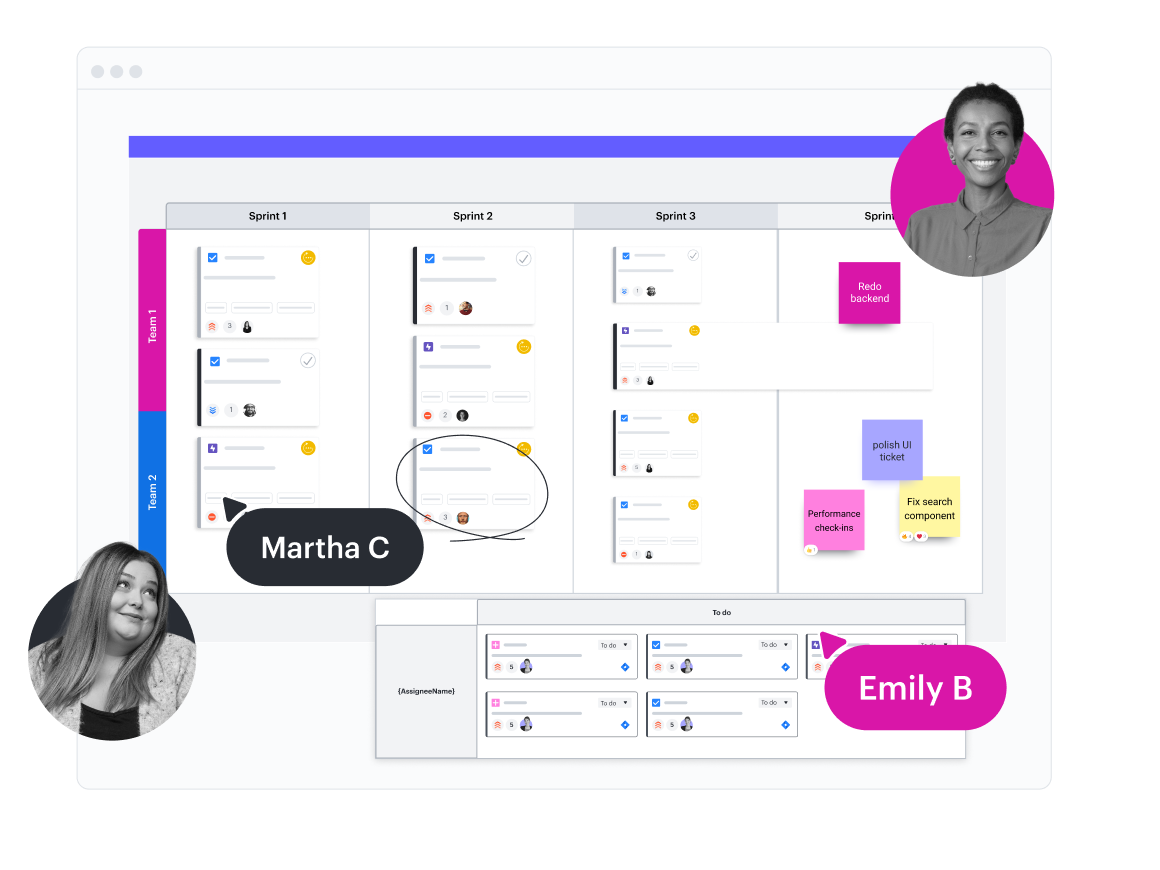
Organisera sprintplanering
Gör varje aspekt av sprinten visuell – från prioritering av uppgifter till att skapa tidslinjer. Effektivisera arbetet med Jira- och Azure DevOps-integrationer.
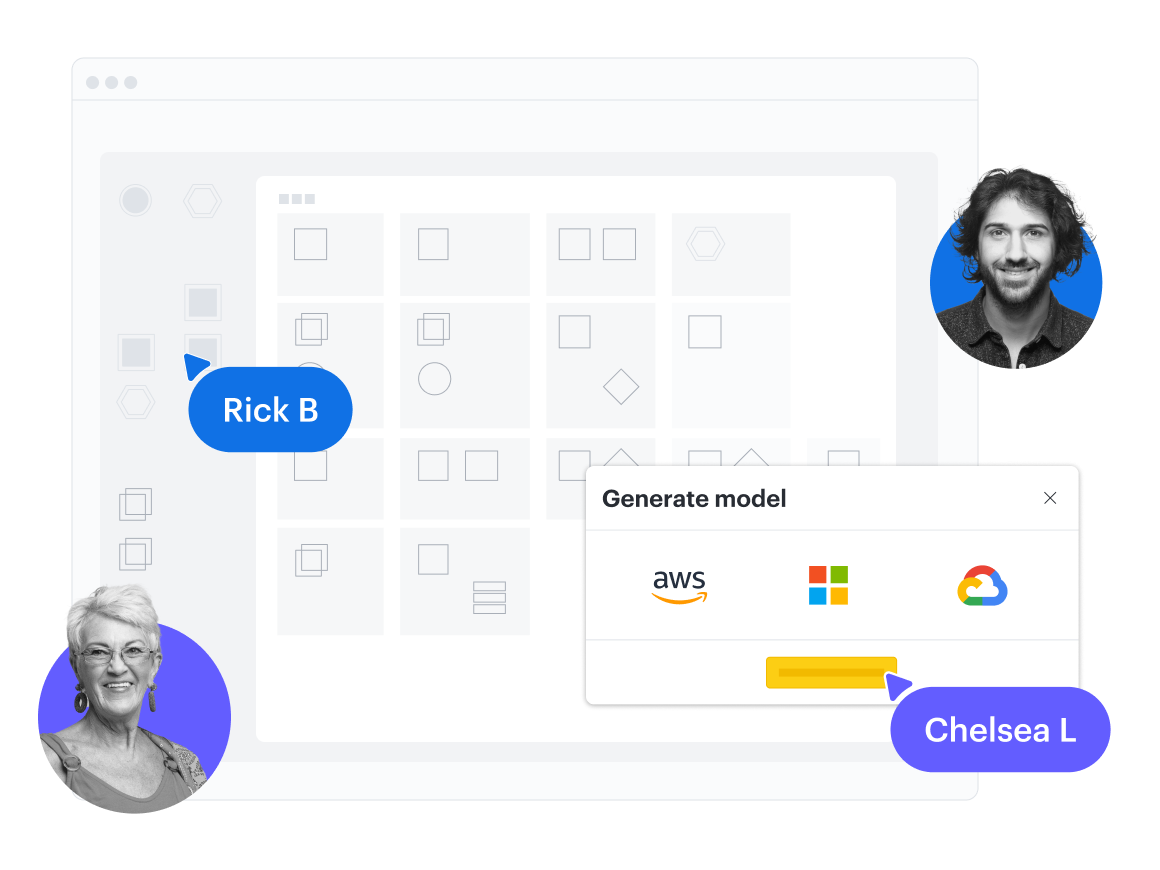
Visualisera din molnarkitektur
Använd formbiblioteken för AWS, Azure och Google Cloud för att utforma och dokumentera molnarkitektur. Skapa mallar för att standardisera diagram.
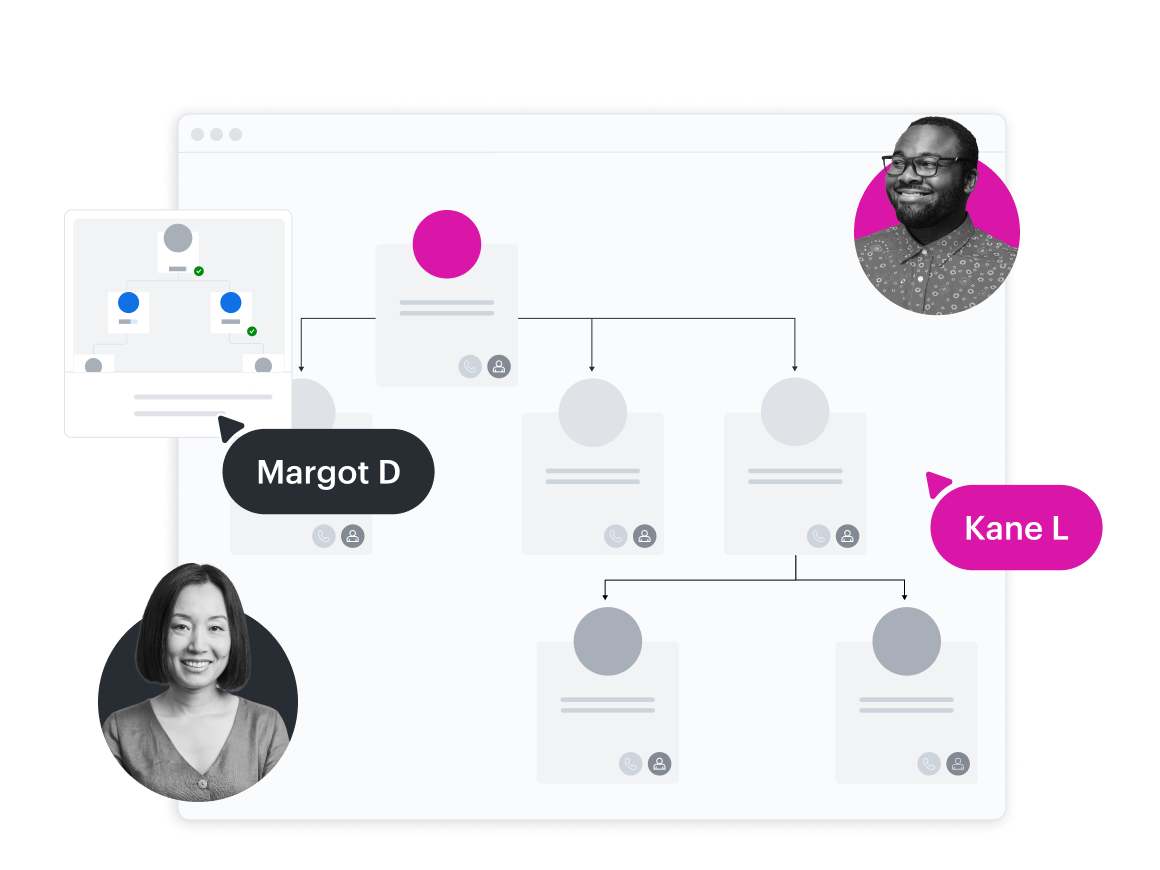
Hantera personal och resurser
Importera HR-data för att skapa, visualisera och hantera scrum-team. Jämför enkelt kompetens, titlar, anställningstid, ansvarsområden med mera.
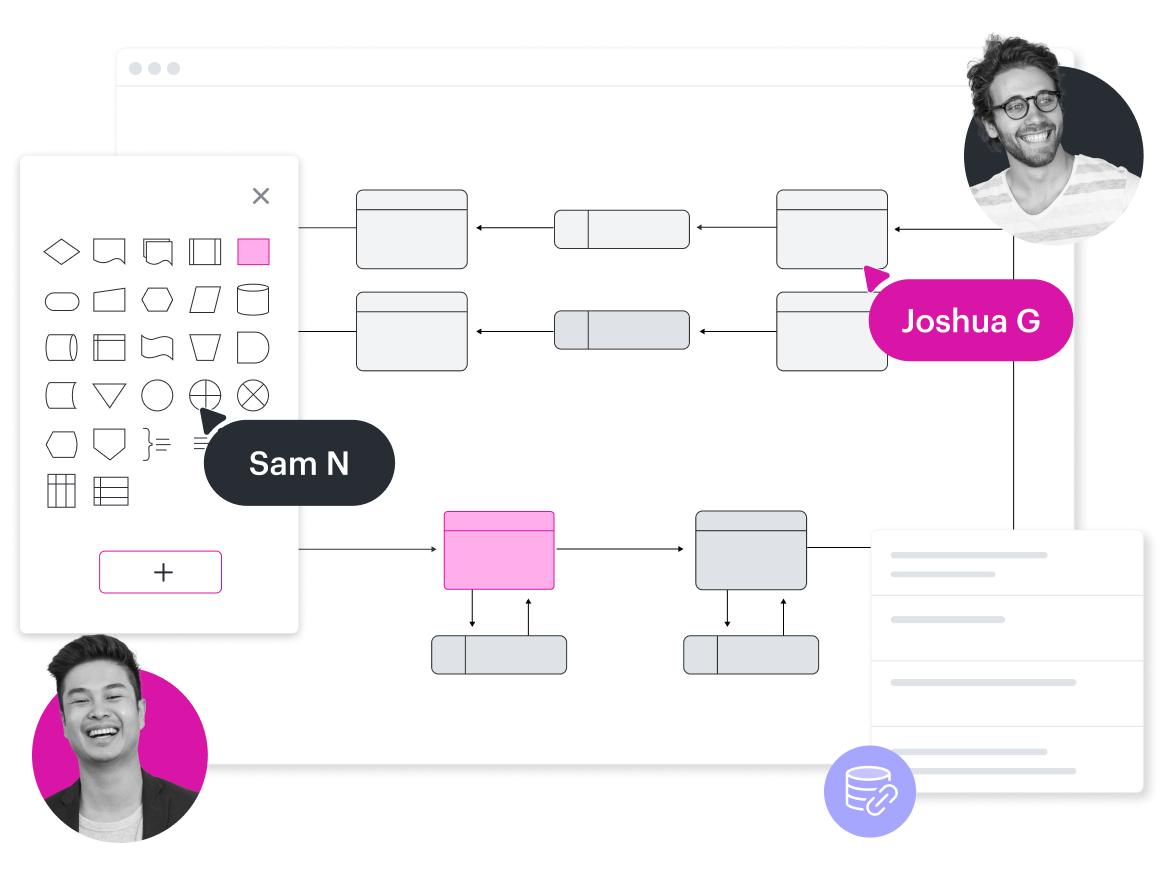
Skapa tekniska diagram
Utnyttja ERD-formbiblioteket för att visualisera hur enheter relaterar till varandra inom ett system. Designa eller felsök enkelt relationsdatabaser.
”Med Lucidchart kan vi få saker genomförda oändligt mycket snabbare. Vi hade aldrig kunnat hantera vår kundbelastning utan Lucidchart.”