Give your engineering team the power of clarity
See and understand the flow of ideas, systems, and processes in the Lucid Visual Collaboration Suite. Make informed decisions faster to accelerate innovation.


View data and complex systems in context
Turn complexity into possibility with intelligent visuals. Gain a deeper understanding of problems and how to solve them.
How engineering teams use Lucid

Create step-by-step processes
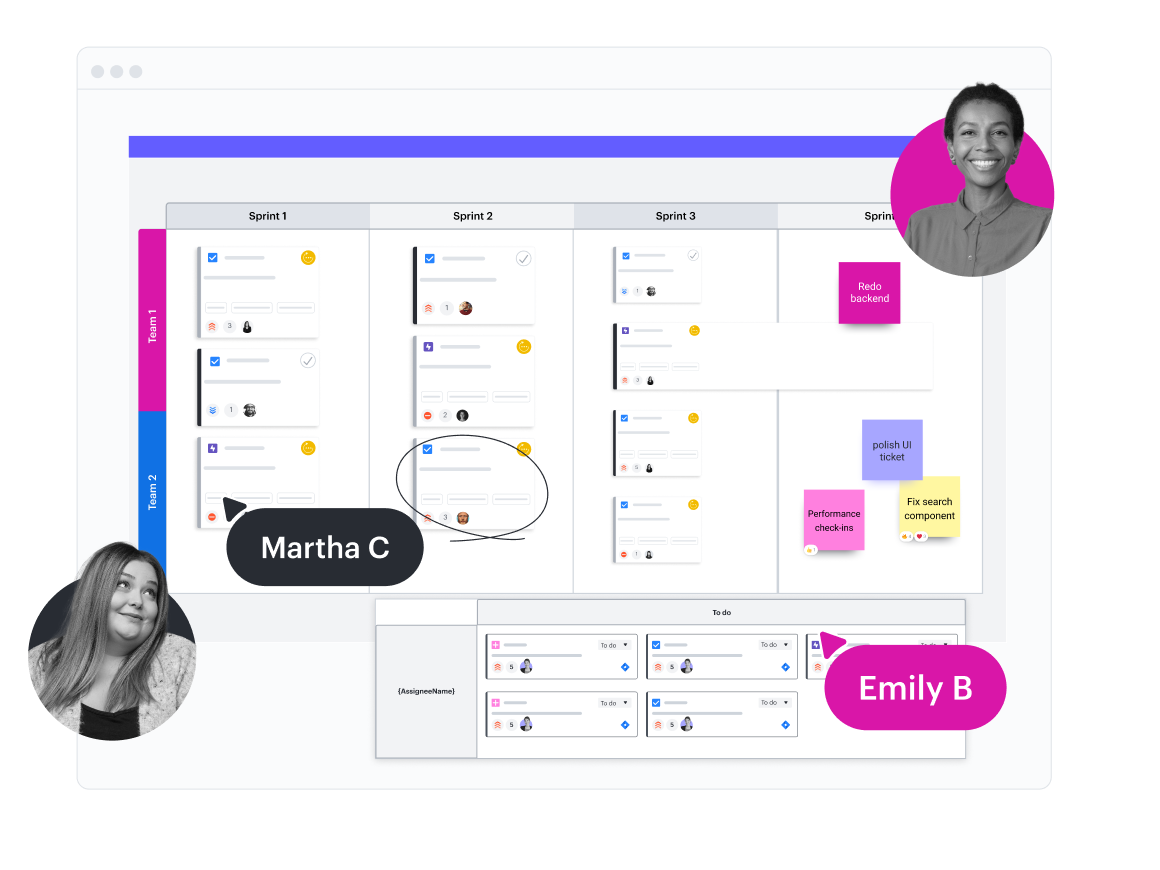
Organize sprint planning

Visualize your cloud architecture

Manage people and resources
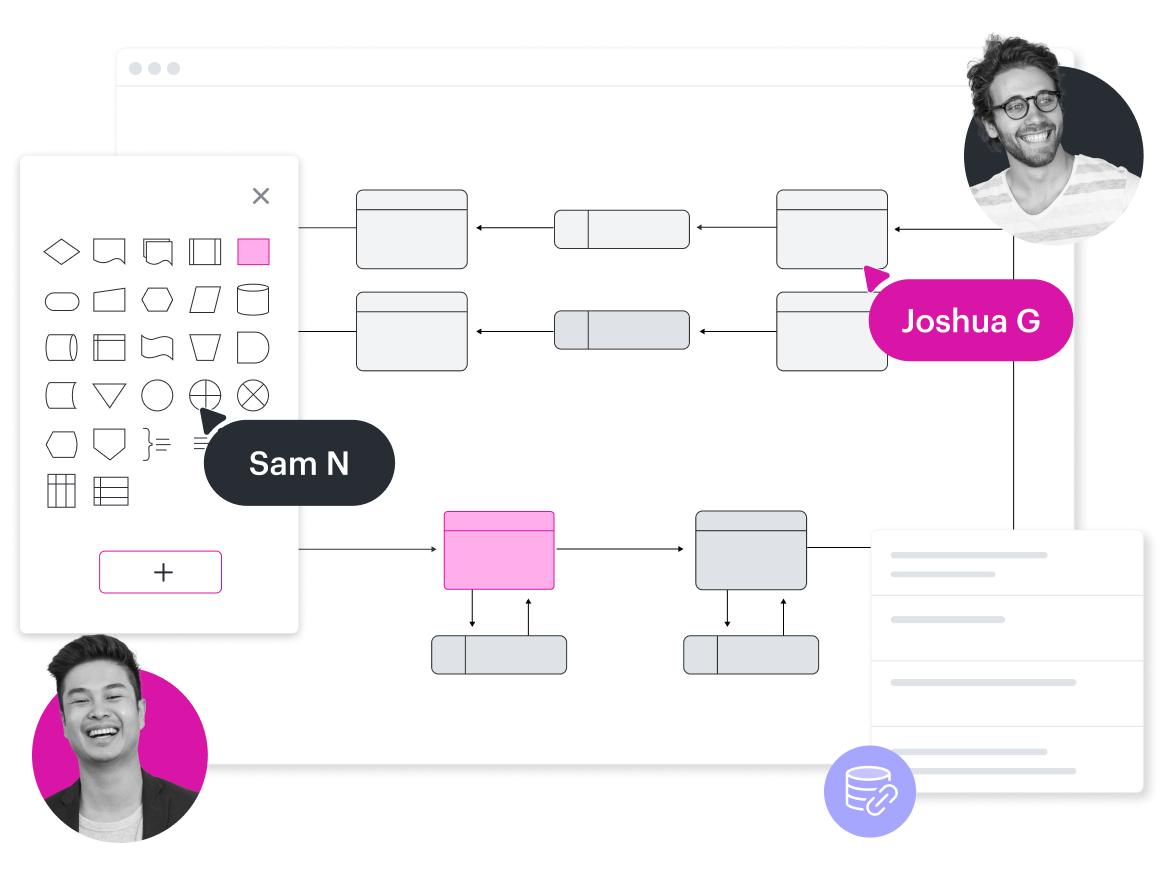
Create technical diagrams
See more solutions
Explore use casesPopular integrations for engineering teams
Connect Lucid with the apps you use most, and keep your teams and systems working together.


Slack
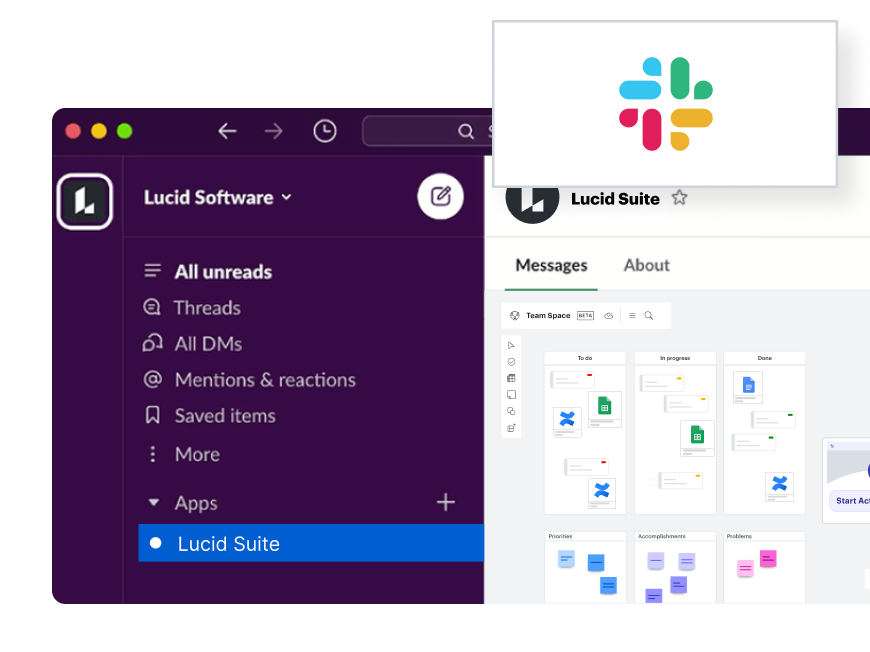
Bring visual collaboration into Slack conversations while easily responding to comments left for you in Lucid
Jira
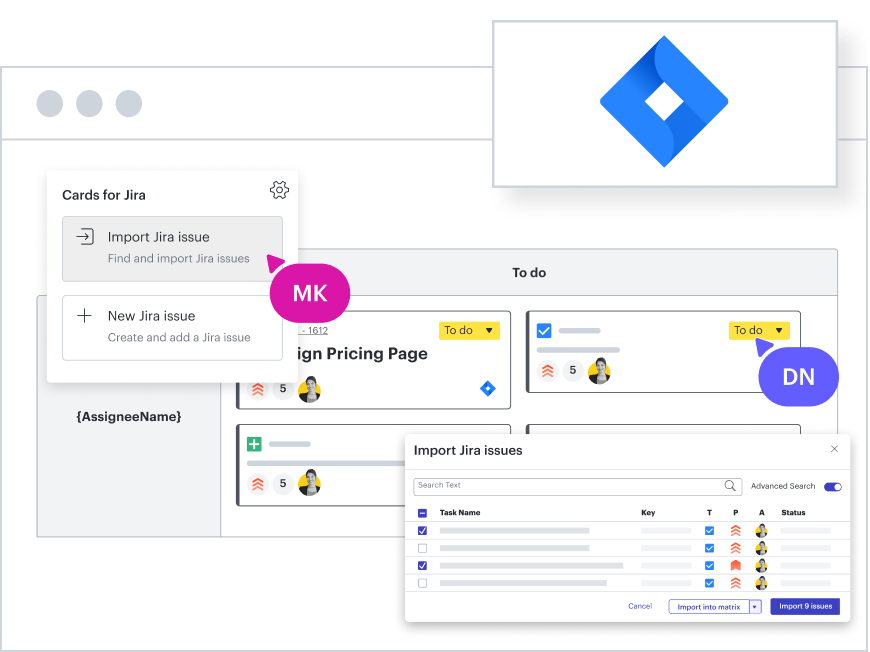
Improve communication and increase clarity by attaching Lucid documents to Jira issues
Lucid Cards for Azure DevOps
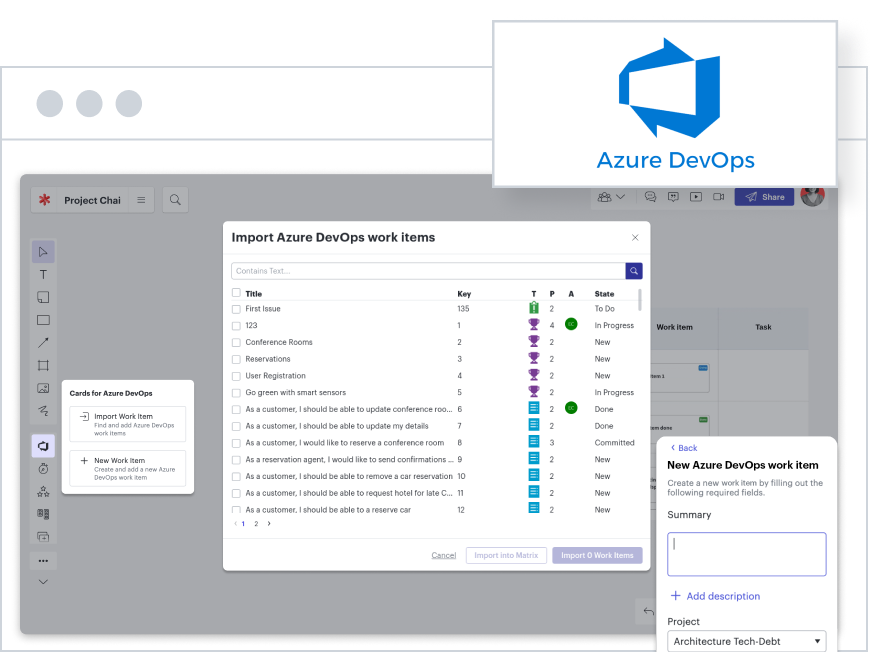
Import or create work items from Azure DevOps Cloud as Lucid Cards. Organize work items in Lucidspark and stay aligned with a bi-directional sync.
Confluence
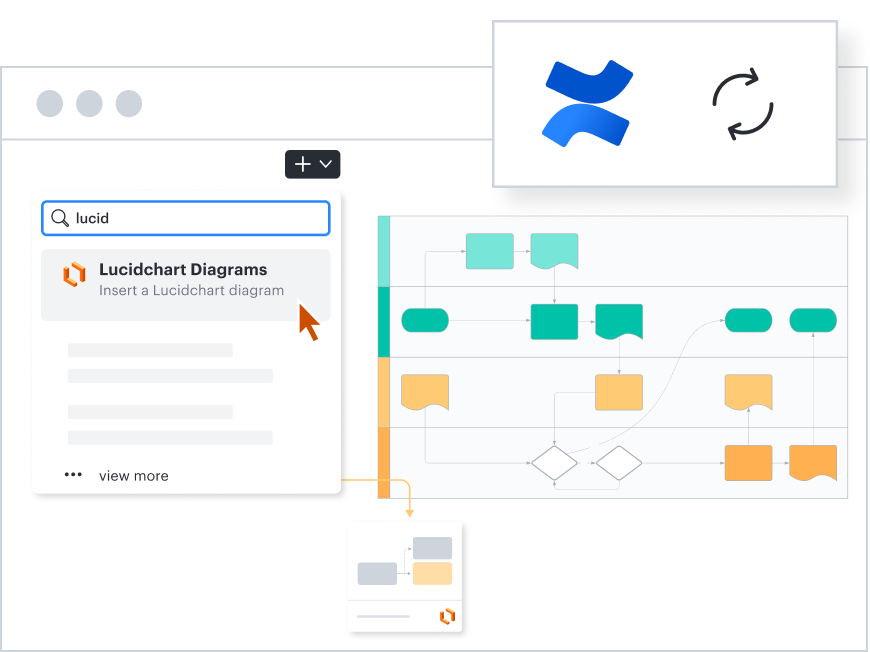
Collaborate and communicate more effectively by adding visuals to Confluence pages
Lucid MCP server
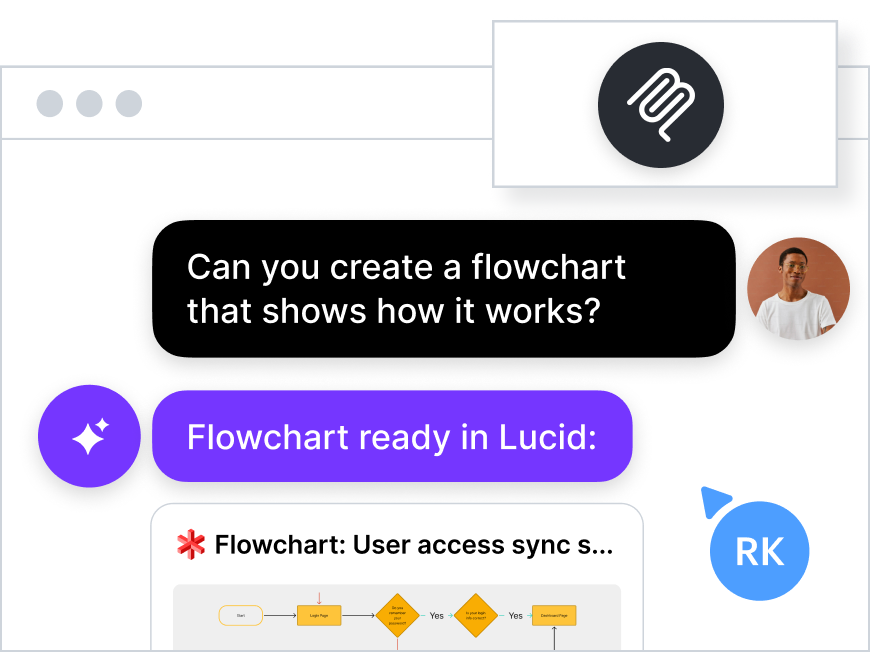
Connect your AI tools to Lucid to intelligently search for files, create visuals, and share with your team.
Slack
Bring visual collaboration into Slack conversations while easily responding to comments left for you in Lucid
Jira
Improve communication and increase clarity by attaching Lucid documents to Jira issues
Lucid Cards for Azure DevOps
Import or create work items from Azure DevOps Cloud as Lucid Cards. Organize work items in Lucidspark and stay aligned with a bi-directional sync.
Confluence
Collaborate and communicate more effectively by adding visuals to Confluence pages
Lucid MCP server
Connect your AI tools to Lucid to intelligently search for files, create visuals, and share with your team.
Additional resources
How Lucid engineers use Lucid blog post
See how our engineers use the software they design and build.
3 ways Lucid accelerates R&D innovation
Move your projects seamlessly from ideation to execution.
Toolkit for effortless documentation
Document engineering systems and processes with ease.
Vandis
"Lucidchart allows us to turn things over infinitely quicker. There was no way we could have handled our client load without Lucidchart."
- Tom Ricardo, Head of Cloud Architecture at Vandis Vandis
Go to case studyTrapeze Group
“We had 16 people on this call. In a physical room, you’d have all 16 crawling over each other to add their items to the whiteboard. With Lucidspark, we created a shared, synchronized workspace where everyone can add their ideas. We were able to get people working efficiently together on a Zoom call.”
- Alex Ni, CTO at Trapeze Group Trapeze Group
Go to case studyWarby Parker
“I use Lucidchart for creating workflows that I share with non-technical people. For example, we have a project process that consists of several stages. To easily display those stages, I create a swimlane diagram to show the different phases within a stage, to identify the owner, to list key decision points within each process, and so on.”
- Janny Wang, Project Manager at Warby Parker Warby Parker
Go to case studyLucid for everyone
Give every team in your organization a better way to work—visually.