Equip solutions engineers to meet customer needs
Leverage the Lucid Visual Collaboration Suite to understand and align on customers’ strategic initiatives. Design, build, and deploy tailored solutions.


Develop informed solutions
Work with technical and non-technical stakeholders to gain a deeper understanding of customer needs, objectives, and expectations.
How solutions engineering teams use Lucid
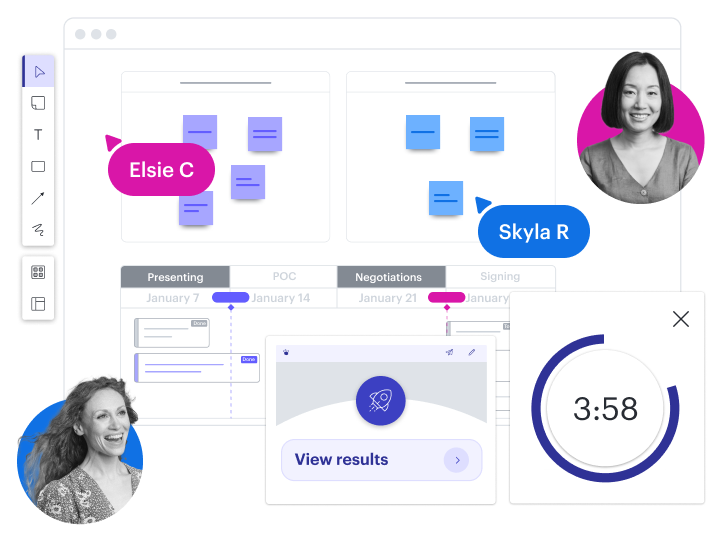
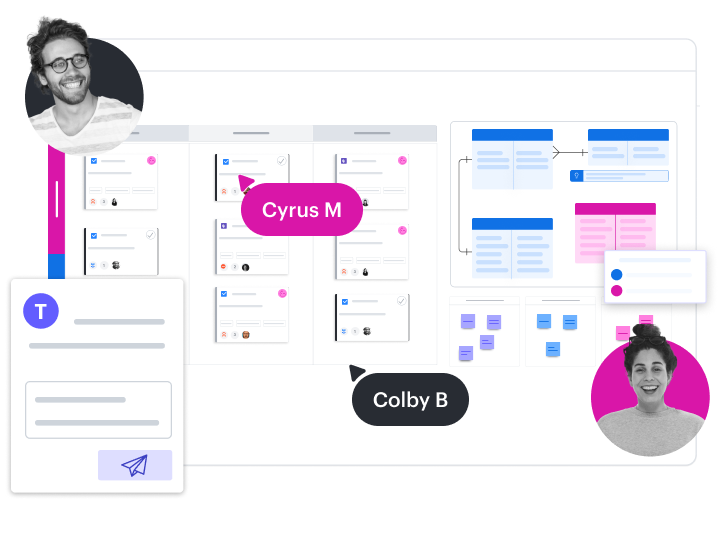
Host discovery workshops
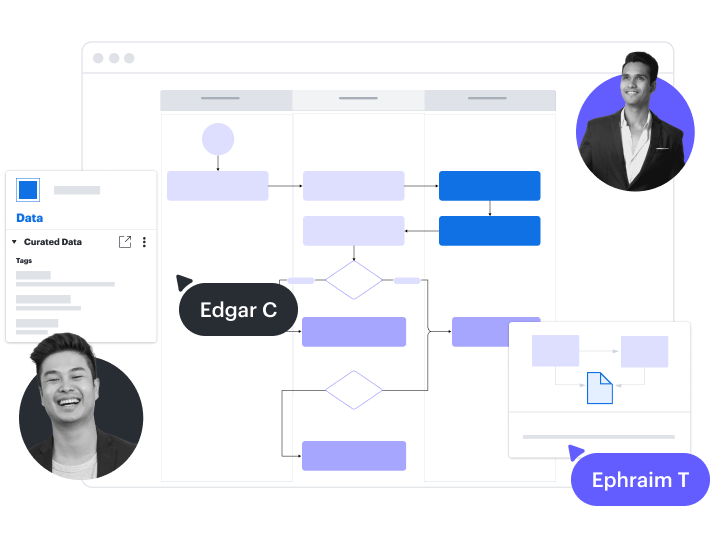
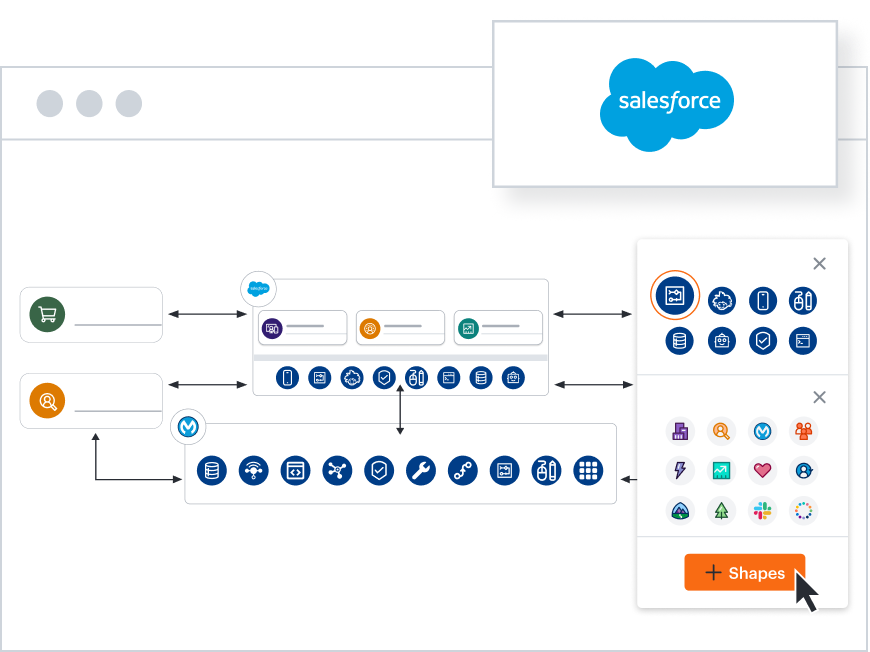
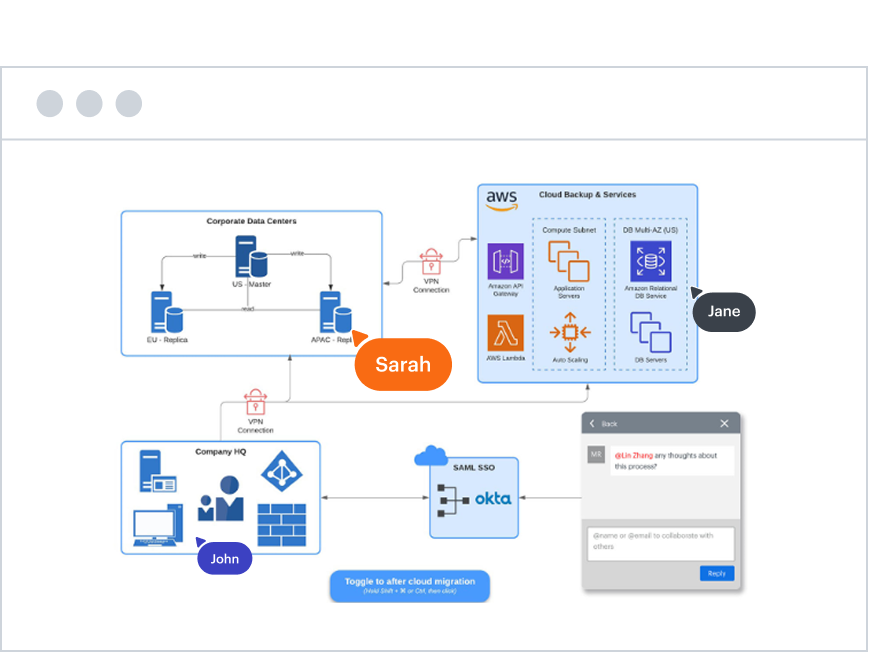
Visualize customer systems
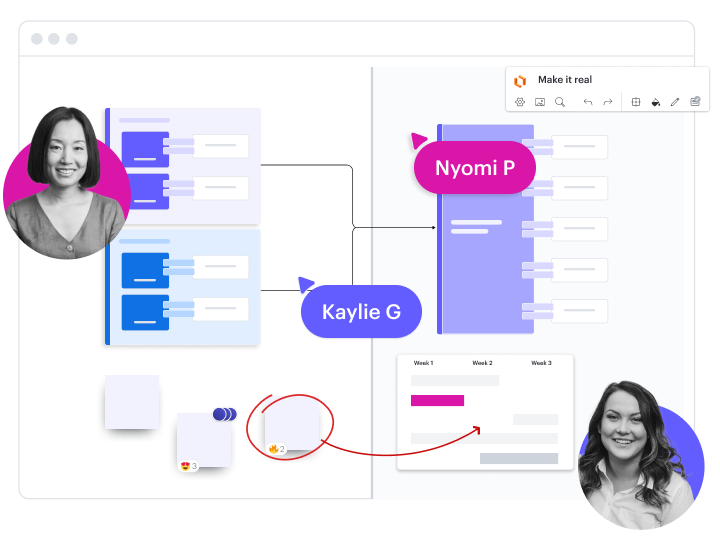
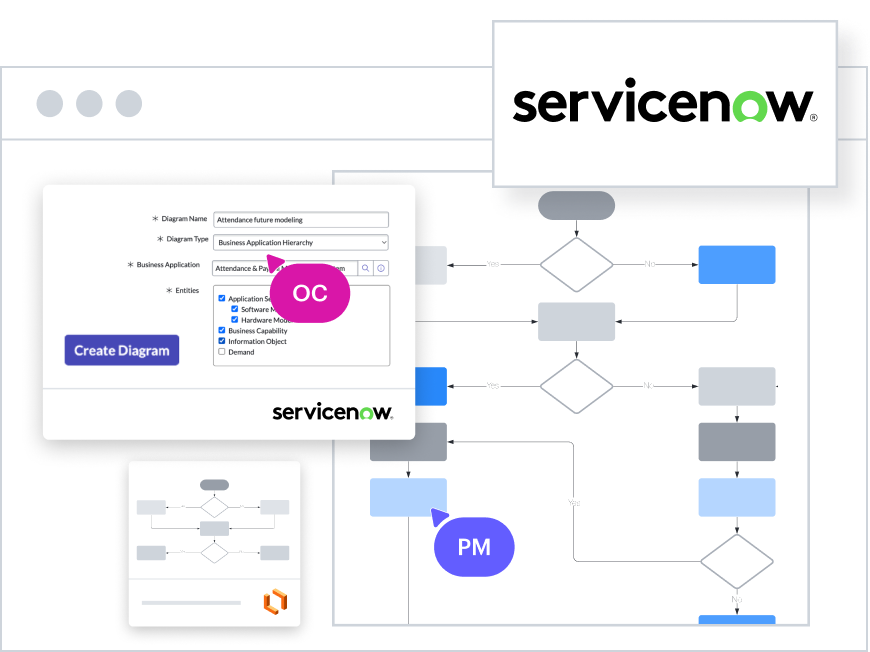
Build future-state proposals
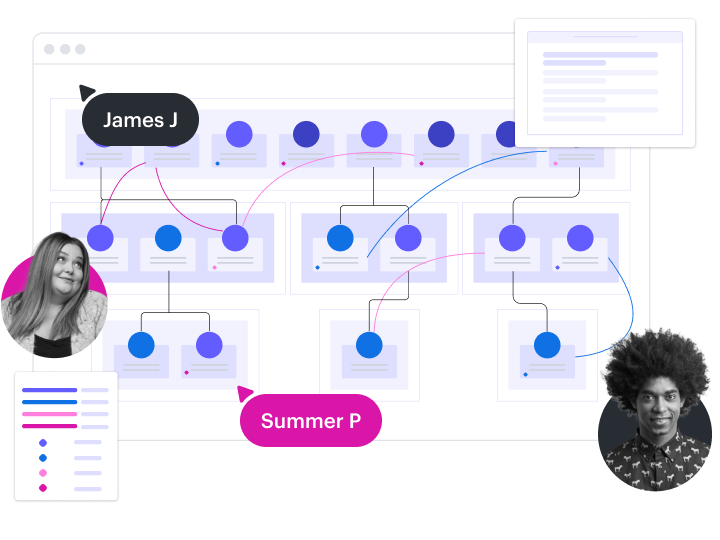
Create account maps
Scale customer resources
See more solutions
Explore use casesPopular integrations for solutions engineers
Connect Lucid with the apps you use most, and keep your teams and systems working together.


Ardoq
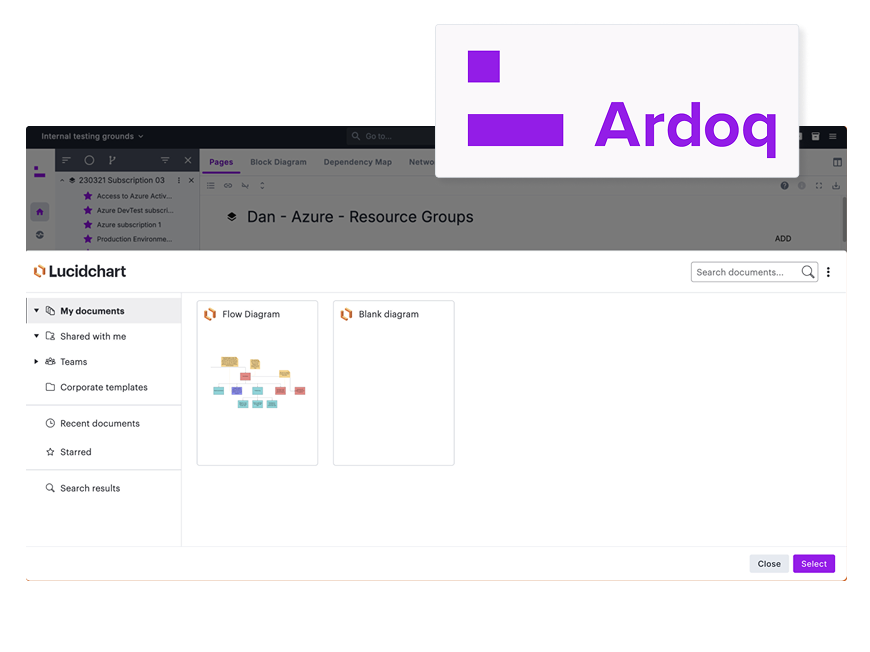
Collaborate on your enterprise architecture insights with intuitive, data-driven Lucidchart diagrams.
Jira
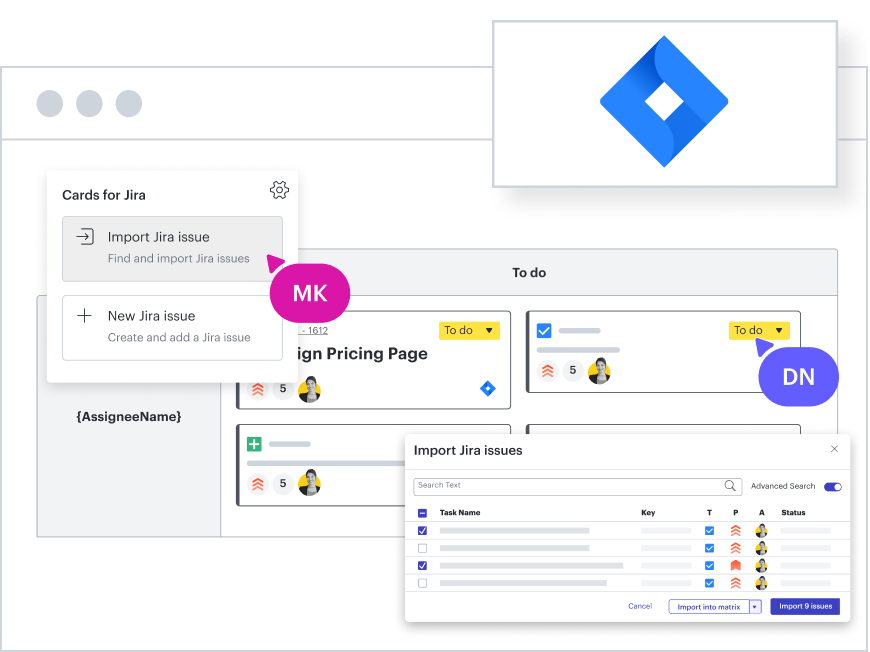
Improve communication and increase clarity by attaching Lucid documents to Jira issues
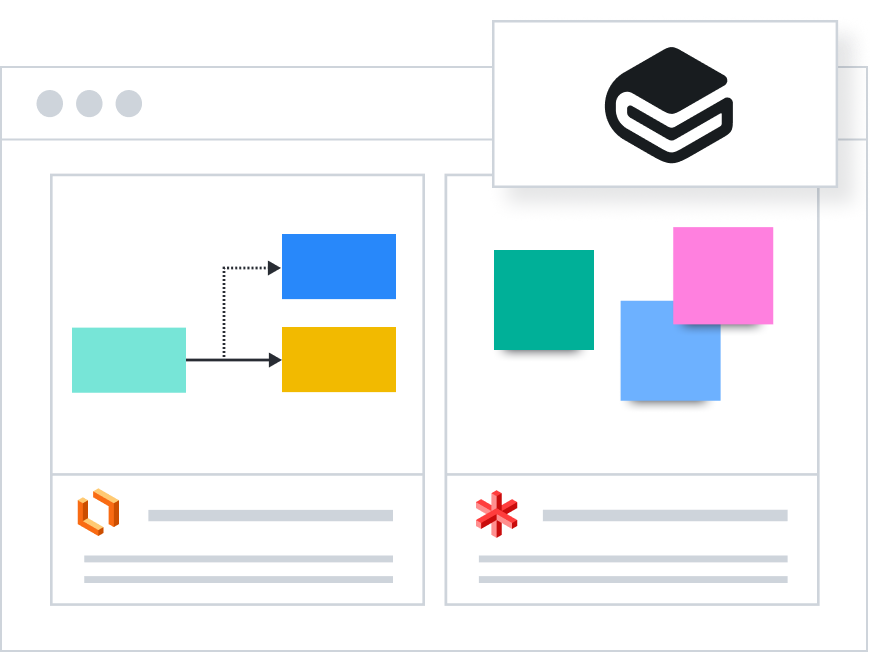
Lucid Cards for Azure DevOps
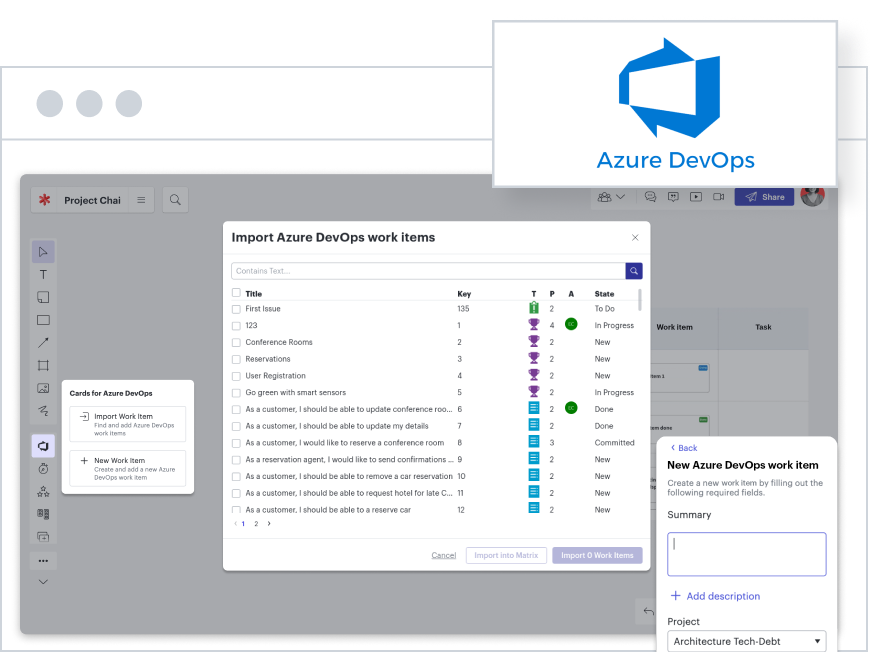
Import or create work items from Azure DevOps Cloud as Lucid Cards. Organize work items in Lucidspark and stay aligned with a bi-directional sync.
AWS
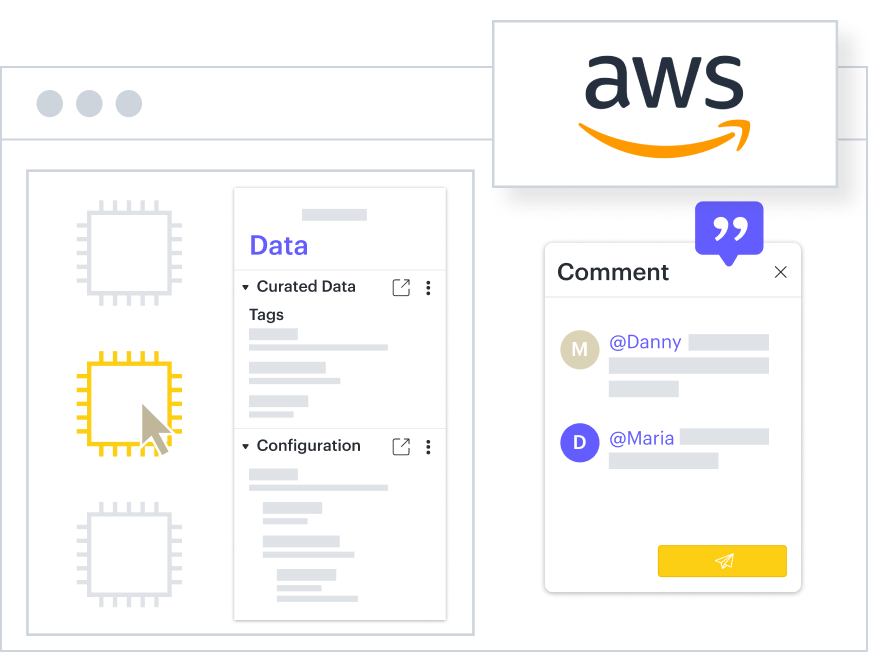
Automatically visualize multiple components of your AWS architecture. See your data in context, and customize views based on cloud data.
Azure
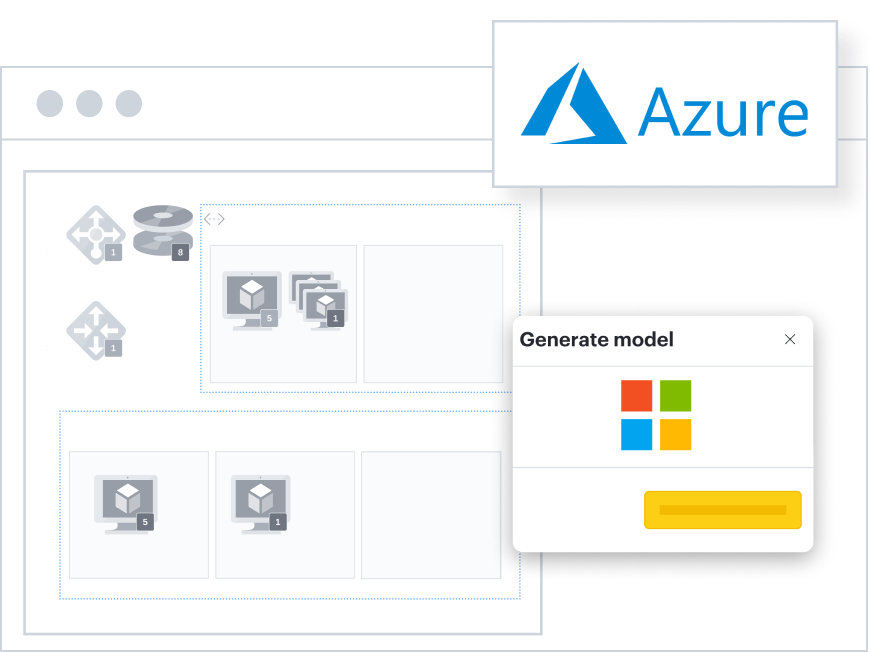
Import Azure cloud data to automatically create accurate, dynamic diagrams of your cloud environment. Visualize and leverage key data.
Google Cloud
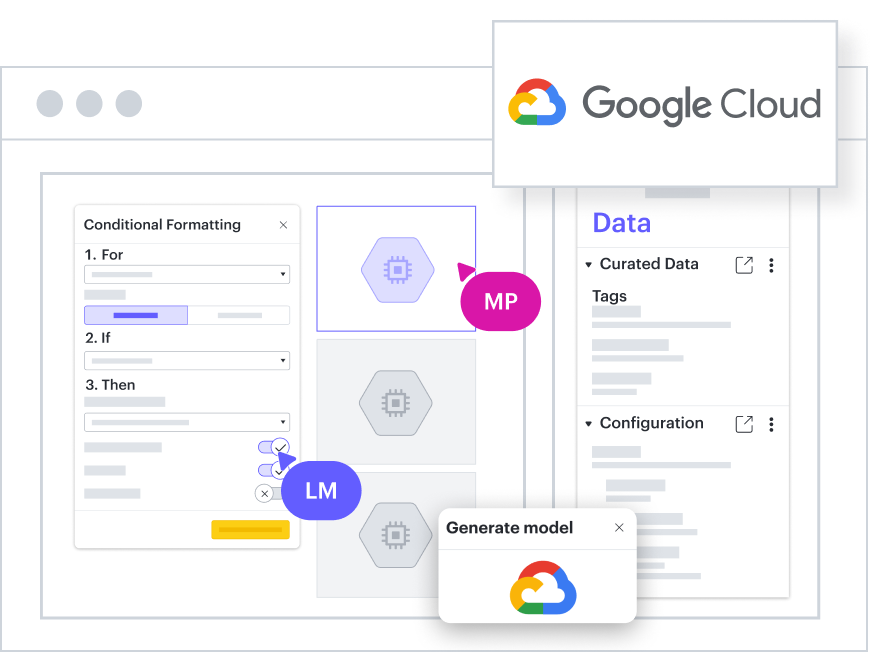
Better govern your cloud by importing data to auto-generate diagrams of your Google Cloud architecture. Focus on specific projects, instance groups, and more.
Lucid MCP server
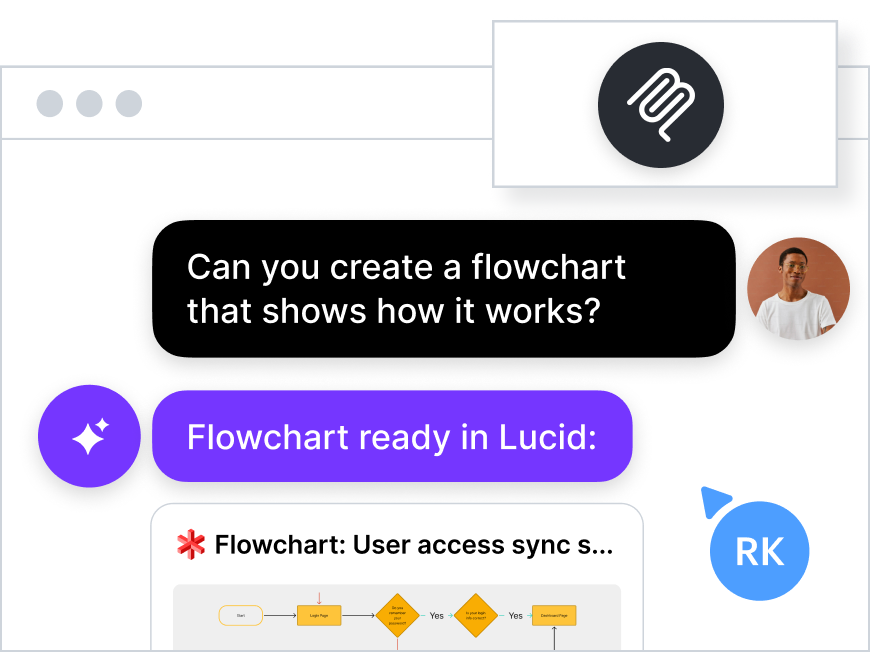
Connect your AI tools to Lucid to intelligently search for files, create visuals, and share with your team.
Ardoq
Collaborate on your enterprise architecture insights with intuitive, data-driven Lucidchart diagrams.
Jira
Improve communication and increase clarity by attaching Lucid documents to Jira issues
Lucid Cards for Azure DevOps
Import or create work items from Azure DevOps Cloud as Lucid Cards. Organize work items in Lucidspark and stay aligned with a bi-directional sync.
AWS
Automatically visualize multiple components of your AWS architecture. See your data in context, and customize views based on cloud data.
Azure
Import Azure cloud data to automatically create accurate, dynamic diagrams of your cloud environment. Visualize and leverage key data.
Google Cloud
Better govern your cloud by importing data to auto-generate diagrams of your Google Cloud architecture. Focus on specific projects, instance groups, and more.
Lucid MCP server
Connect your AI tools to Lucid to intelligently search for files, create visuals, and share with your team.
Additional resources
Time-saving tips for sales engineers
Quickly create presentations and visuals for customers.
Better sales collaboration article
Eliminate barriers to closing deals by working better together.
Okta
"I find that when we're talking to different people, when I am able to use a diagram to show how the Okta Identity Cloud would work for their particular use case, it starts to click so much better than me just trying to articulate on the phone. Because words are very dry and are open to too much interpretation."
- Dan Marma, Sales Architect at Okta Okta
Go to case studyOkta
“We were looking for ways to improve the collaboration and sharing of technical material. Lucidchart enabled us to create shared customer folders that we could share amongst the consulting groups so we could leverage each other’s work. It also allowed us to create templates to share, which are accessible by other consultants and allow them to more quickly create an output.”
- Phil Carolan, Regional Director of Professional Services at Okta Okta
Go to case studyDocuSign
“Providing a diagram makes the conversation easier for the customer. No question. Being able to have this visual diagram of what we can and can't do significantly increases the customer's retention and grasp of the information. It gives them a sense of security that this isn’t our first rodeo.”
- Sam Metzer, Solutions Engineer at DocuSign DocuSign
Go to case studyLucid for everyone
Give every team in your organization a better way to work—visually.