情報システム部とシステムの連携を維持
Lucid ビジュアルコラボレーションスイートでテクノロジーインフラストラクチャを設計、文書化、最適化。成功に必要なツールを全員が確実に持てるようにします。
効果的なソリューションを開発して導入
関係者と協力してブレインストーミングを行い、複雑なハードウェアとソフトウェアの展開を計画。優先順位とタイムラインに関して足並みを揃えられます。
情報システム部による Lucid の活用方法
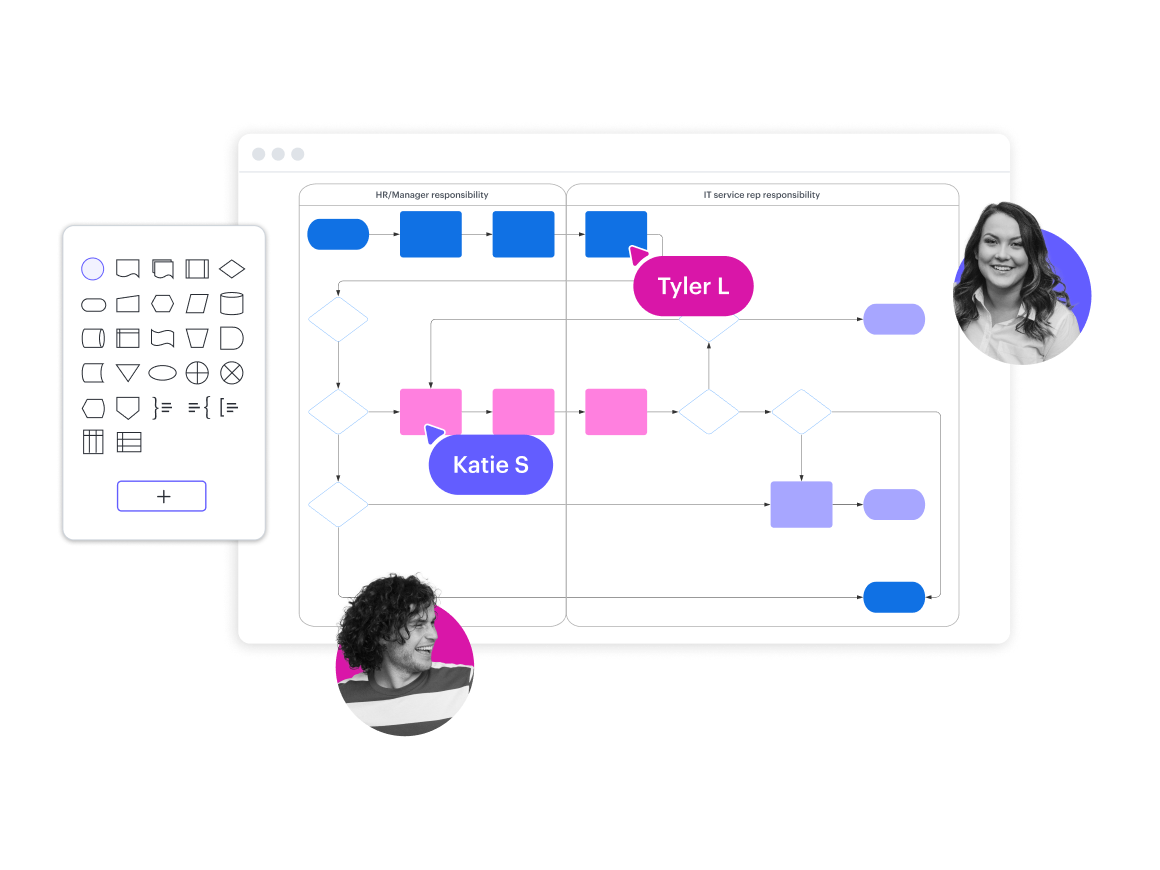
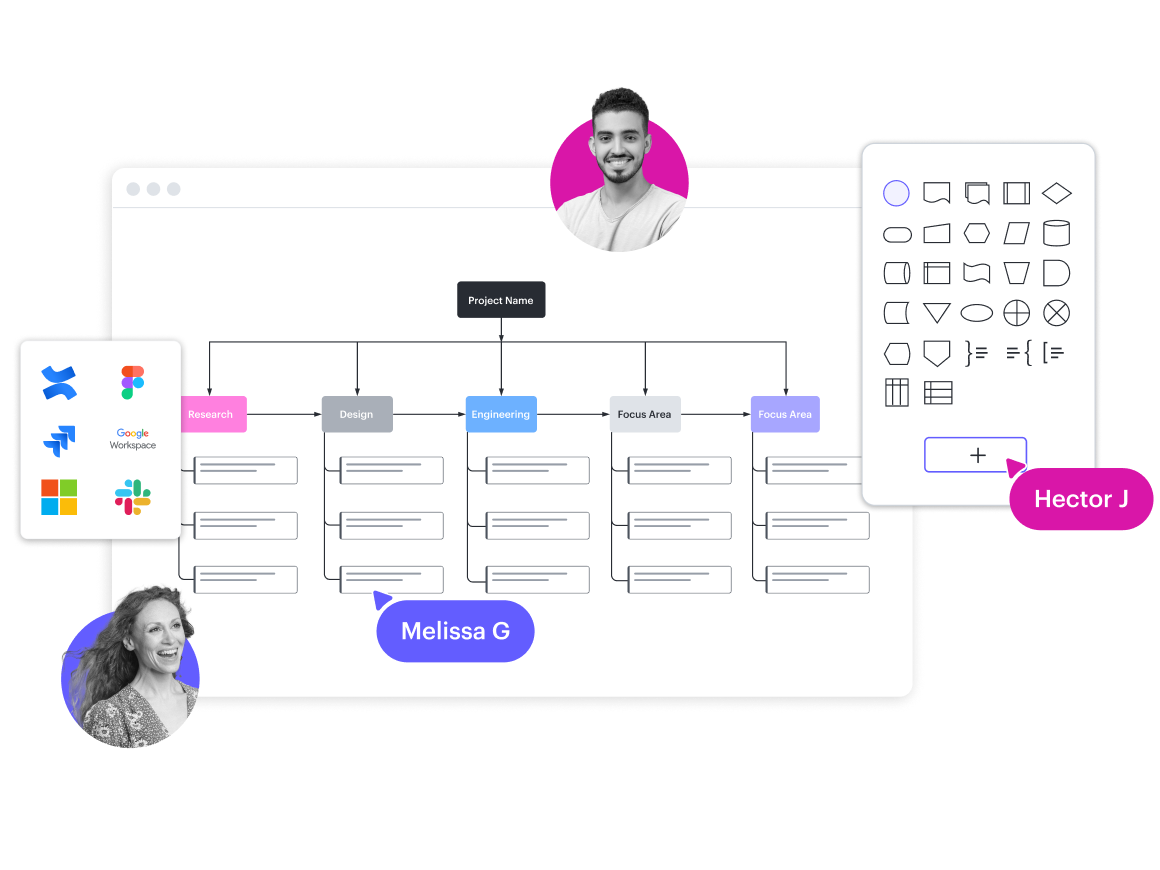
作業指示プロセスを設計
カスタム図形を使用して、新入社員のオンボーディングのフローを視覚化。コメントとタスクの割り当てでプロセスを改善します。
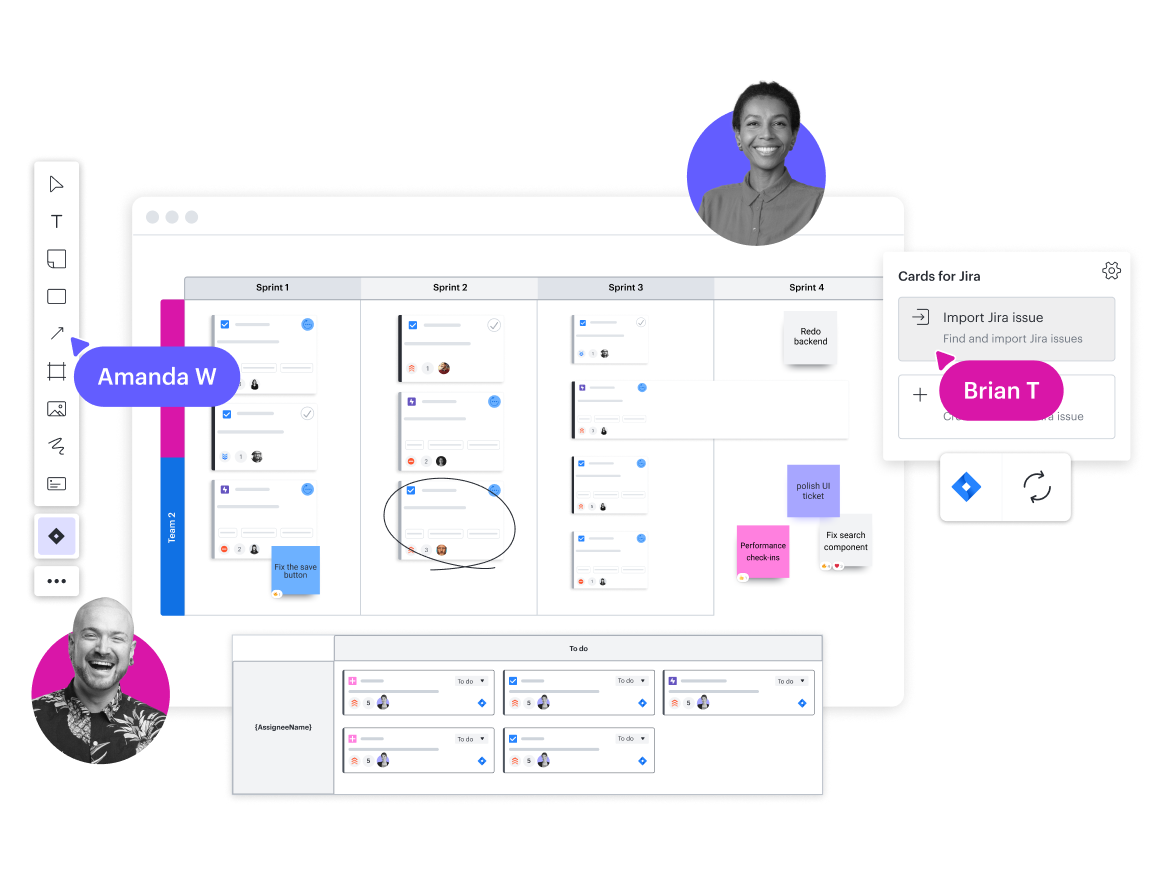
ロードマップを作成
部門横断的なチームと協力し、プロジェクトに優先順位をつけ、スケジュールを作成。Jira と Azure DevOps のインテグレーションで計画をシームレスに行えます。
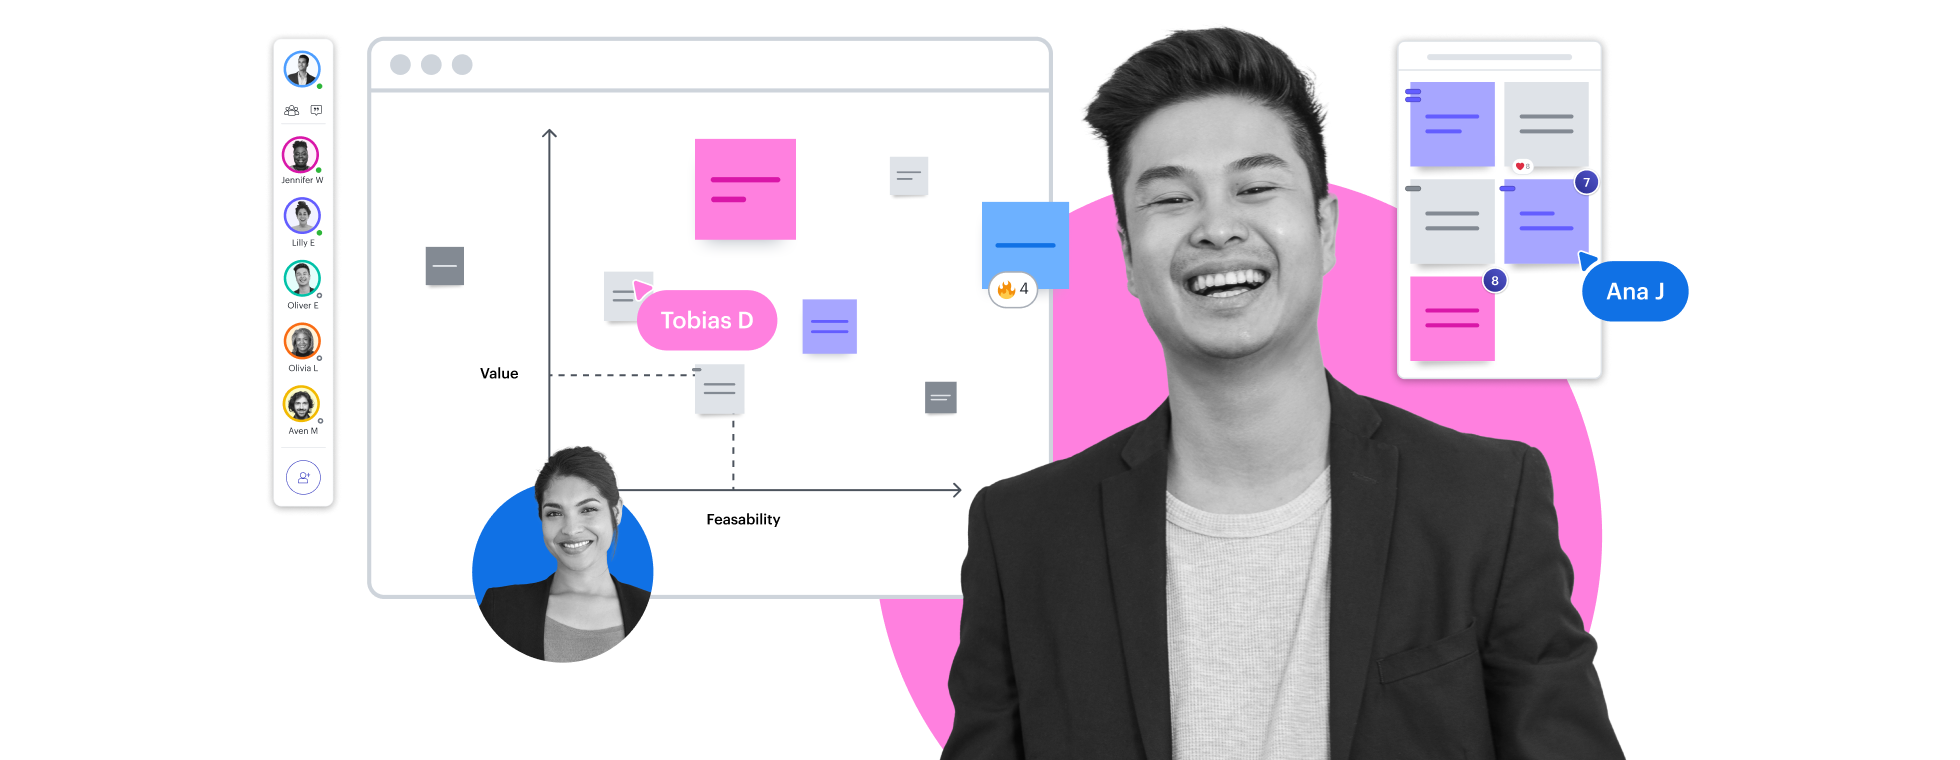
戦略計画を合理化
ビジュアルアクティビティを使用して優先順位を付け、コンセンサスを確立。Lucid カードを使って複雑なプロジェクトを管理可能なタスクに分割します。
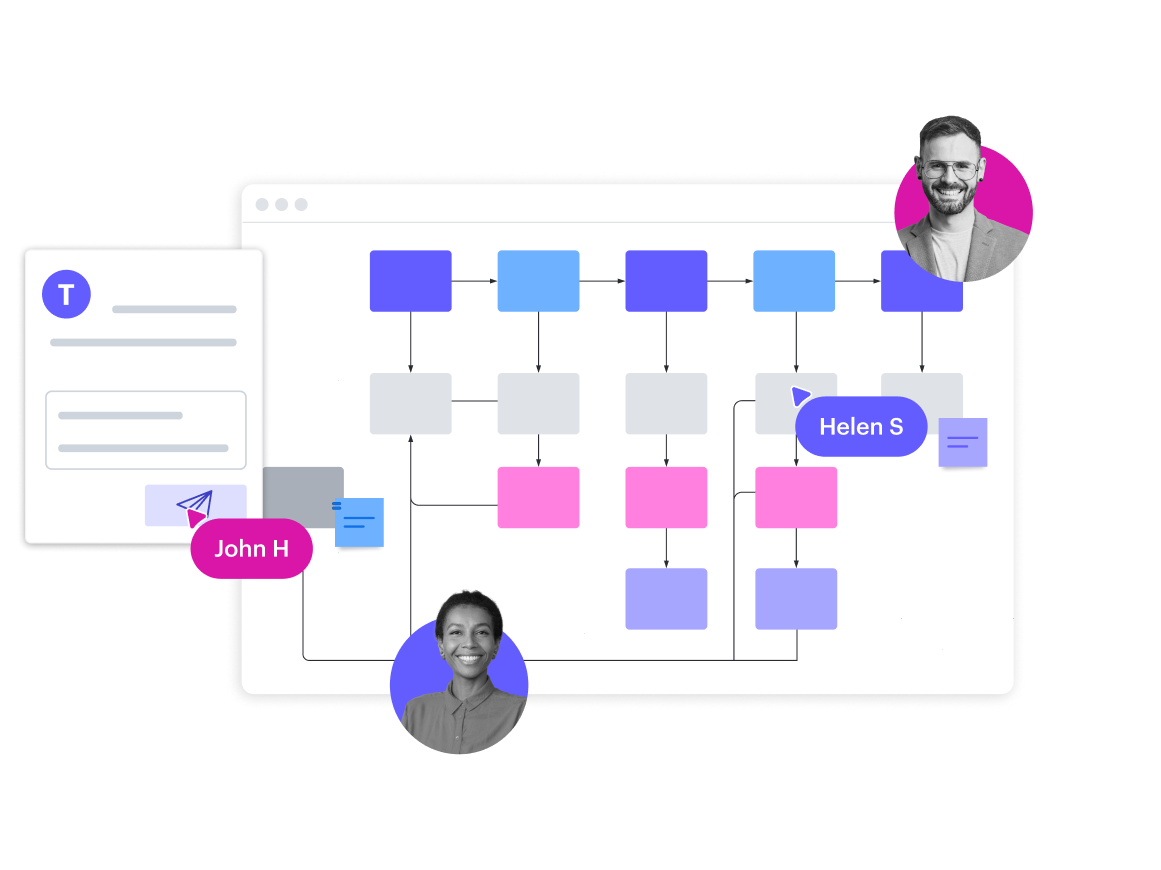
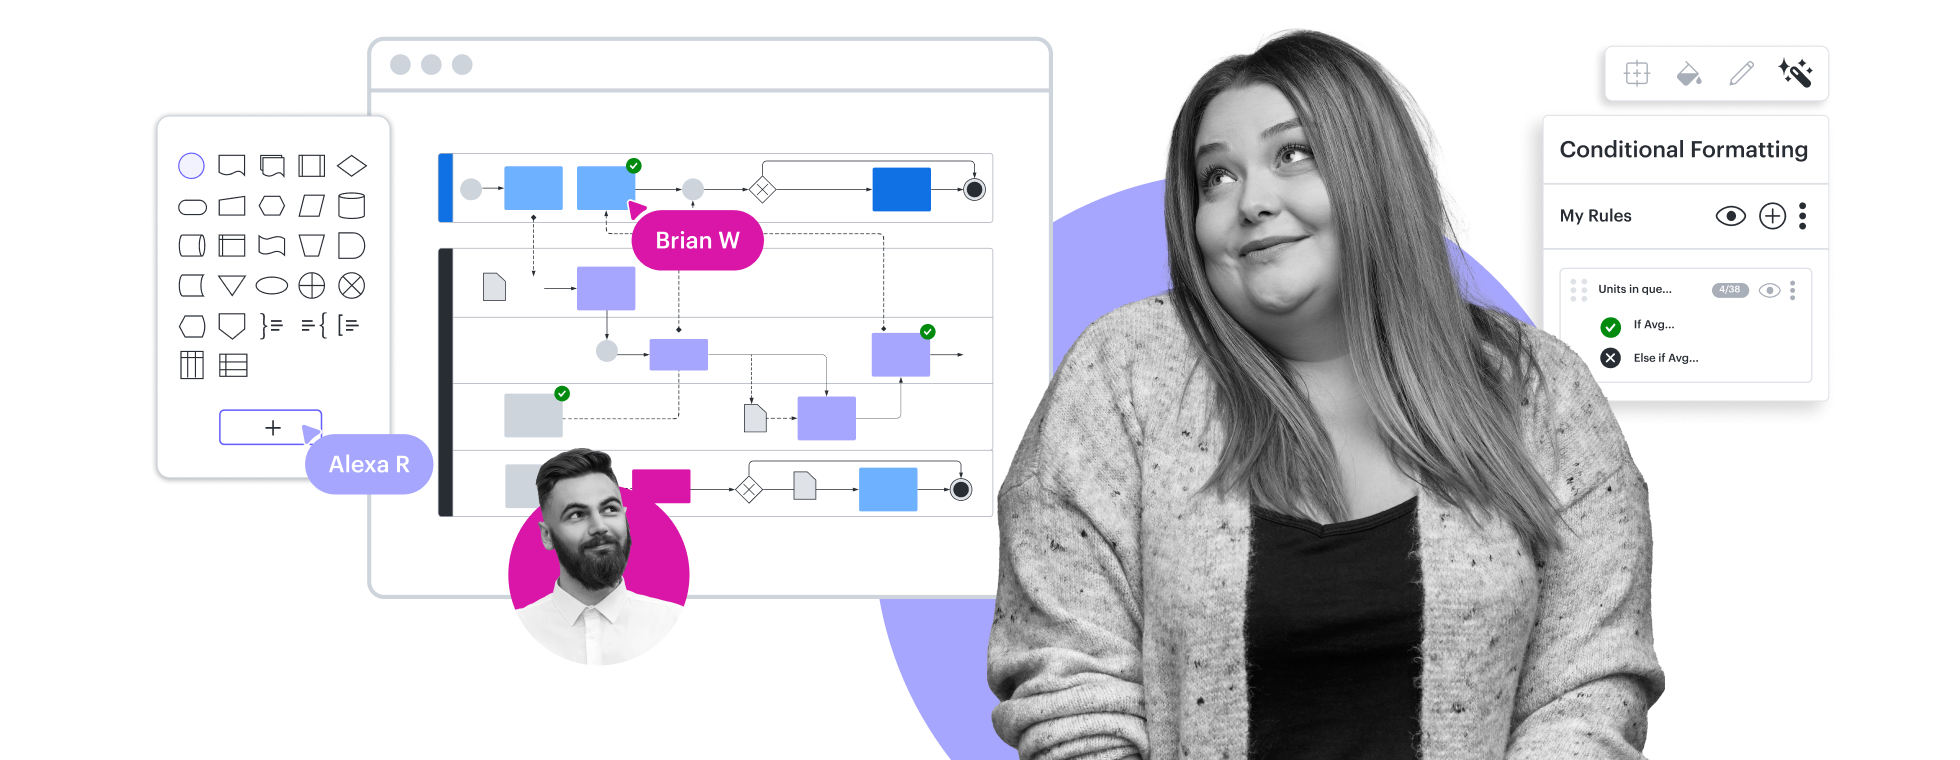
CI/CD パイプラインを最適化
継続的インテグレーションと継続的デリバリーのためにデプロイ可能なユニットのパスを視覚化することで、改善点を簡単に特定できます。
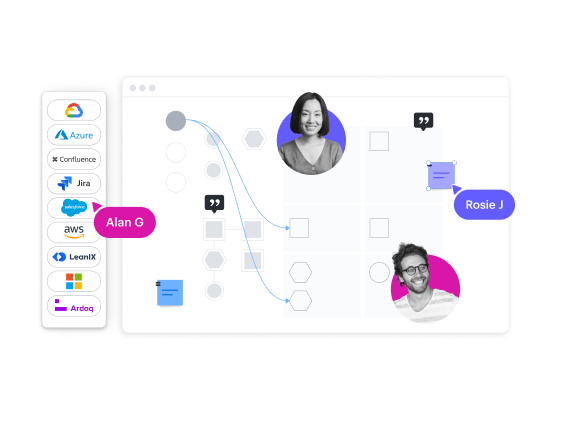
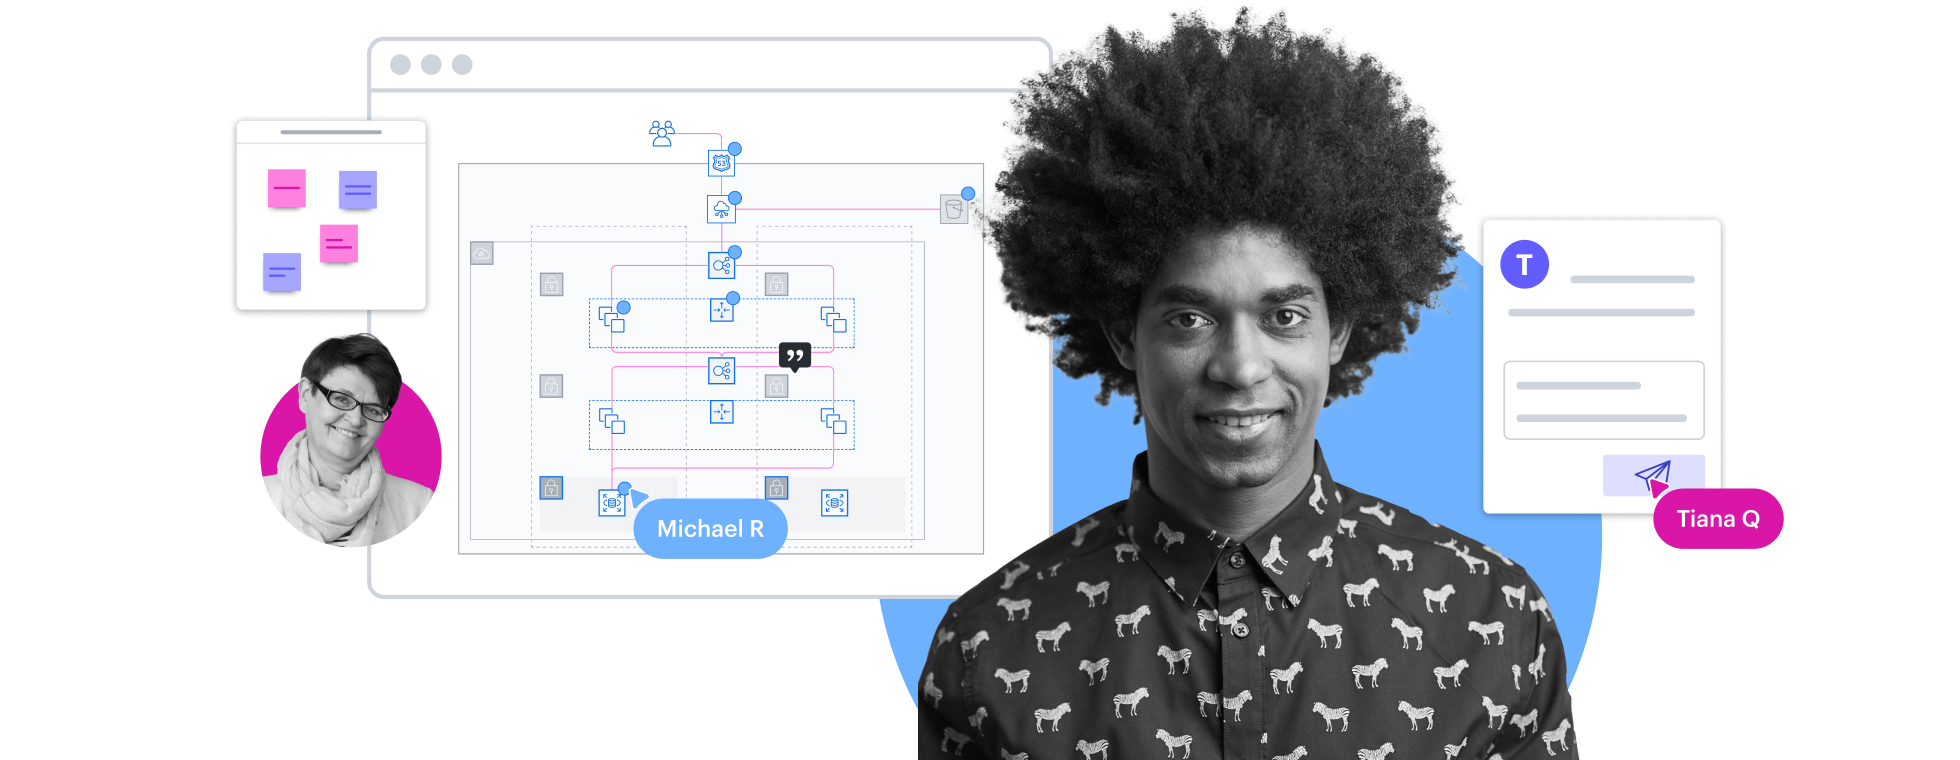
セキュリティ監査用の文書を作成
クラウドプロバイダー (AWS、Azure、Google Cloud) に接続して年次セキュリティ監査のためにクラウドインフラストラクチャを自動で図式化。
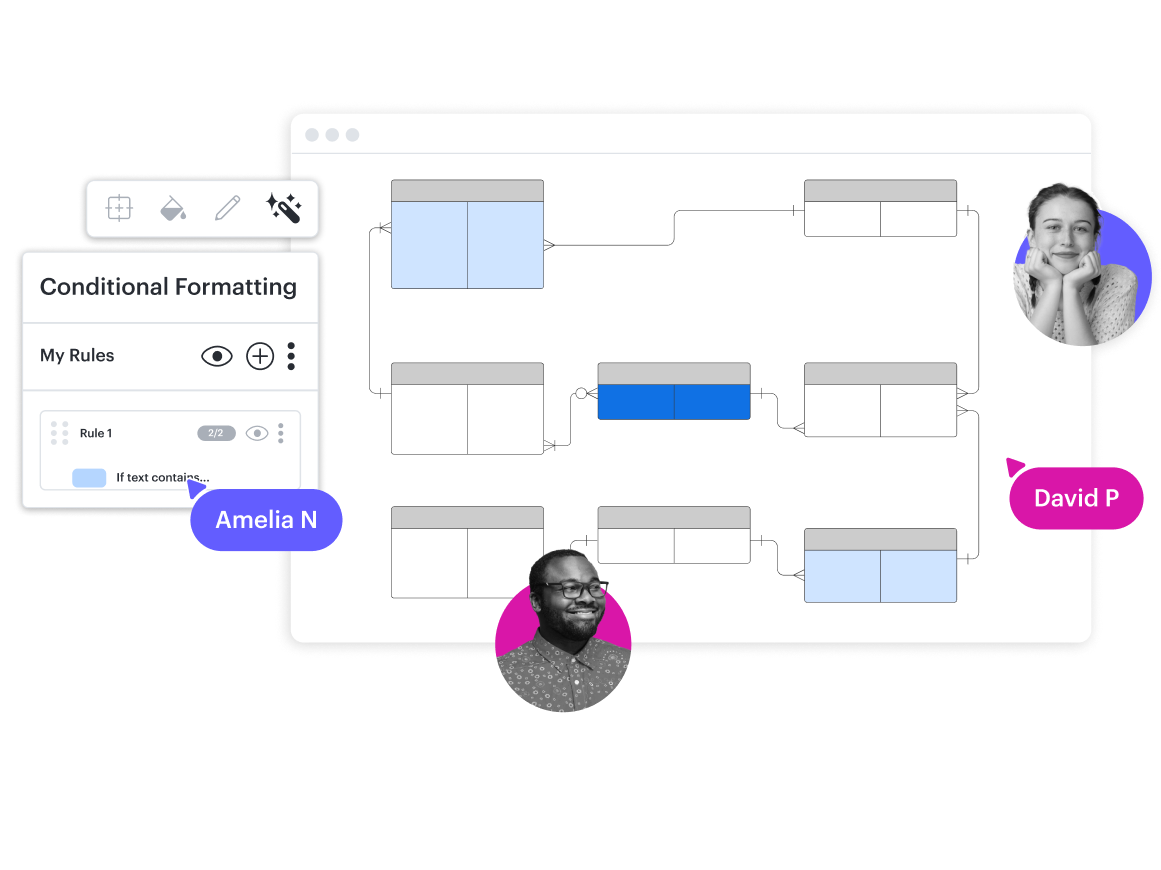
実体間の関連を視覚化
内部ツール間の関係を図式化・文書化し、Confluence とのインテグレーションで図をナレッジベースに埋め込みます。
「コンサルタント一人ひとりが学んだ内容や成功したプロジェクトの成果が失われないように努めています。コンサルティング業界では、あるプロジェクトを通じてチームが懸命に働いて成果を出しても、そのプロジェクトが終了すると次のテーマに流れていってしまい、学びや成果は忘れ去られてしまうという事態が起きがちです。」