Wspieraj współpracę zespołów i systemów IT
Projektuj, dokumentuj i optymalizuj swoją infrastrukturę technologiczną w pakiecie do współpracy wizualnej Lucid. Upewnij się, że wszyscy mają narzędzia potrzebne do osiągnięcia sukcesu.


Opracowuj i wdrażaj skuteczne rozwiązania
Współpracuj z interesariuszami, analizując i planując złożone wdrożenia sprzętu i oprogramowania. Usprawnij priorytety i harmonogramy.
Jak zespoły IT korzystają z Lucid
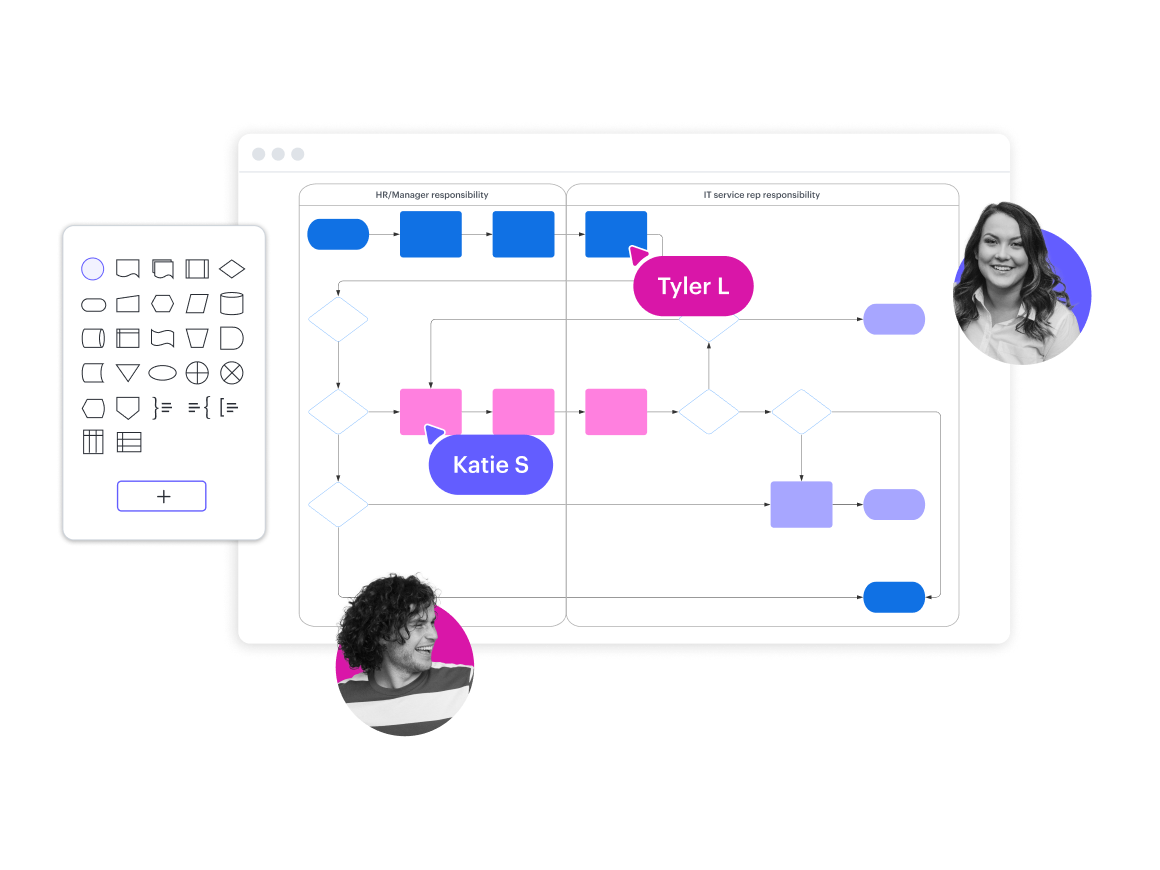
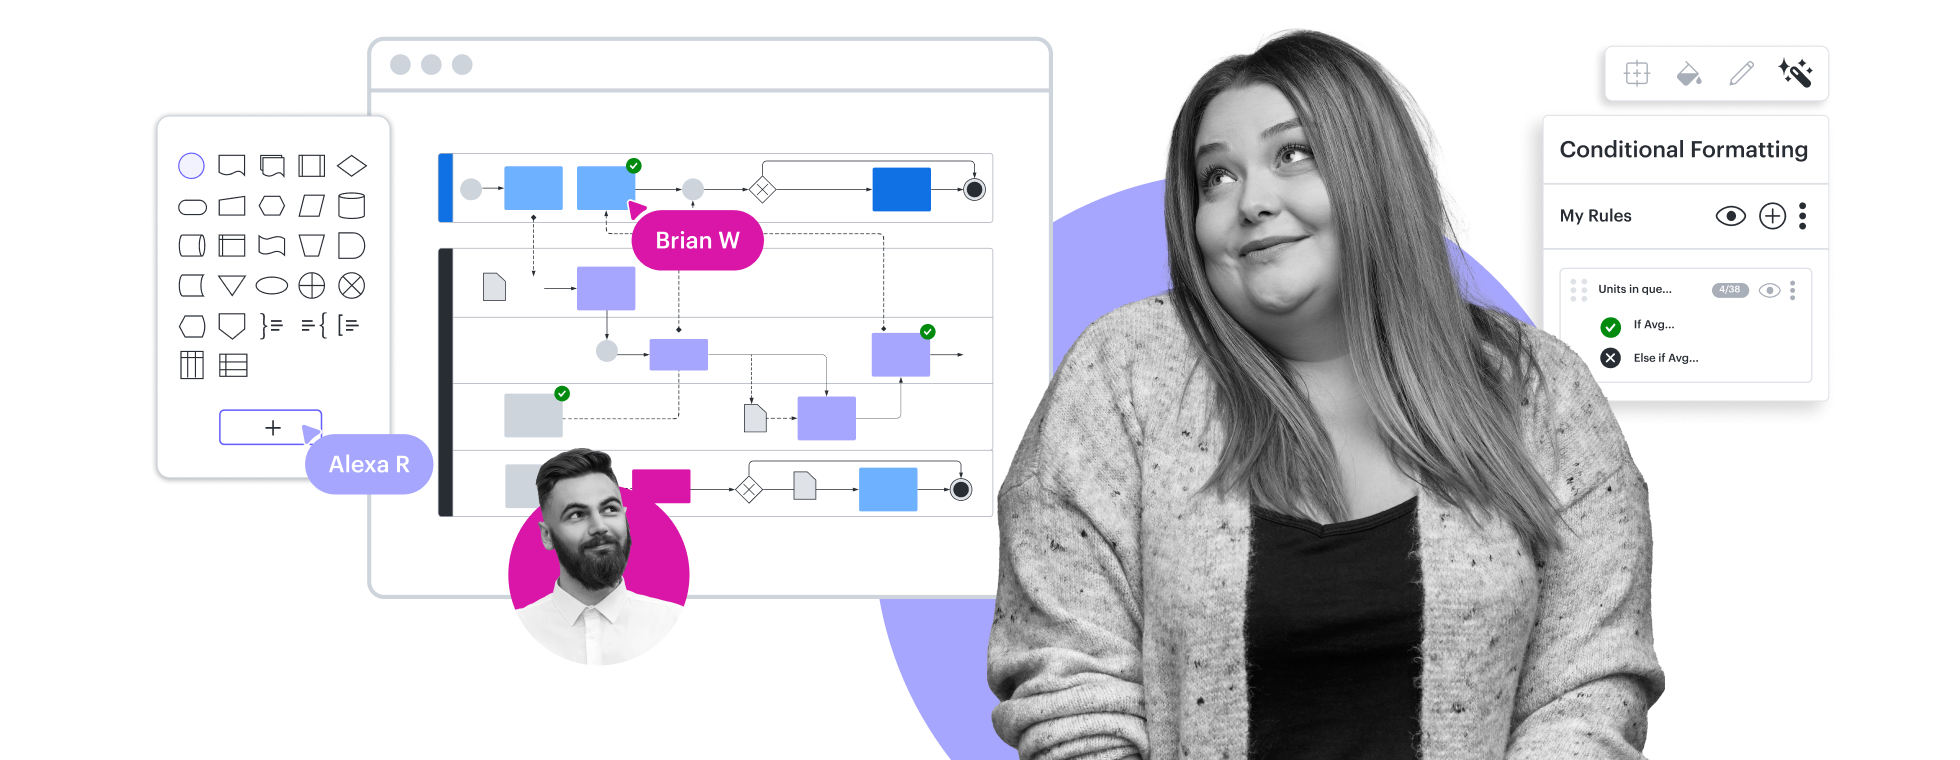
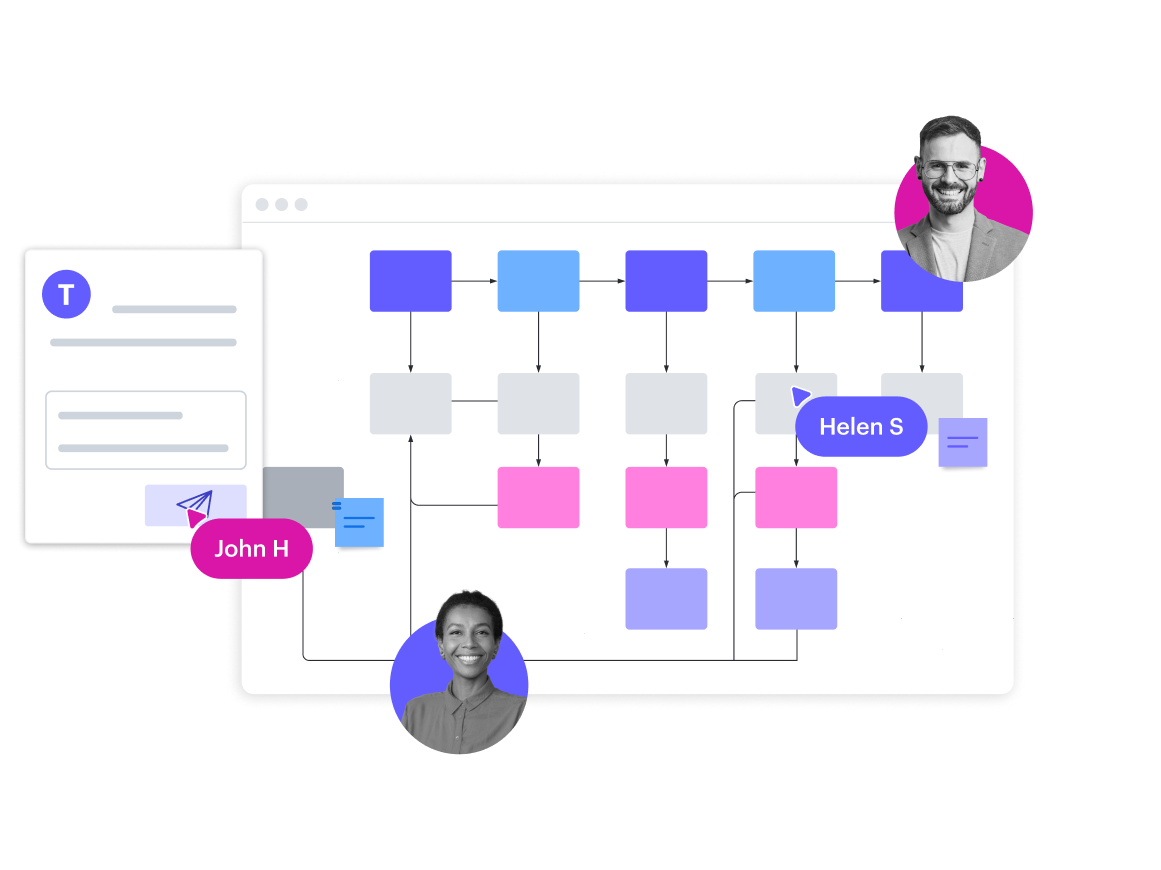
Projektuj procesy dotyczące zamówień
Za pomocą niestandardowych kształtów zwizualizuj proces wdrażania nowych pracowników. Usprawnij swój proces, dodając komentarze i przydzielając zadania.
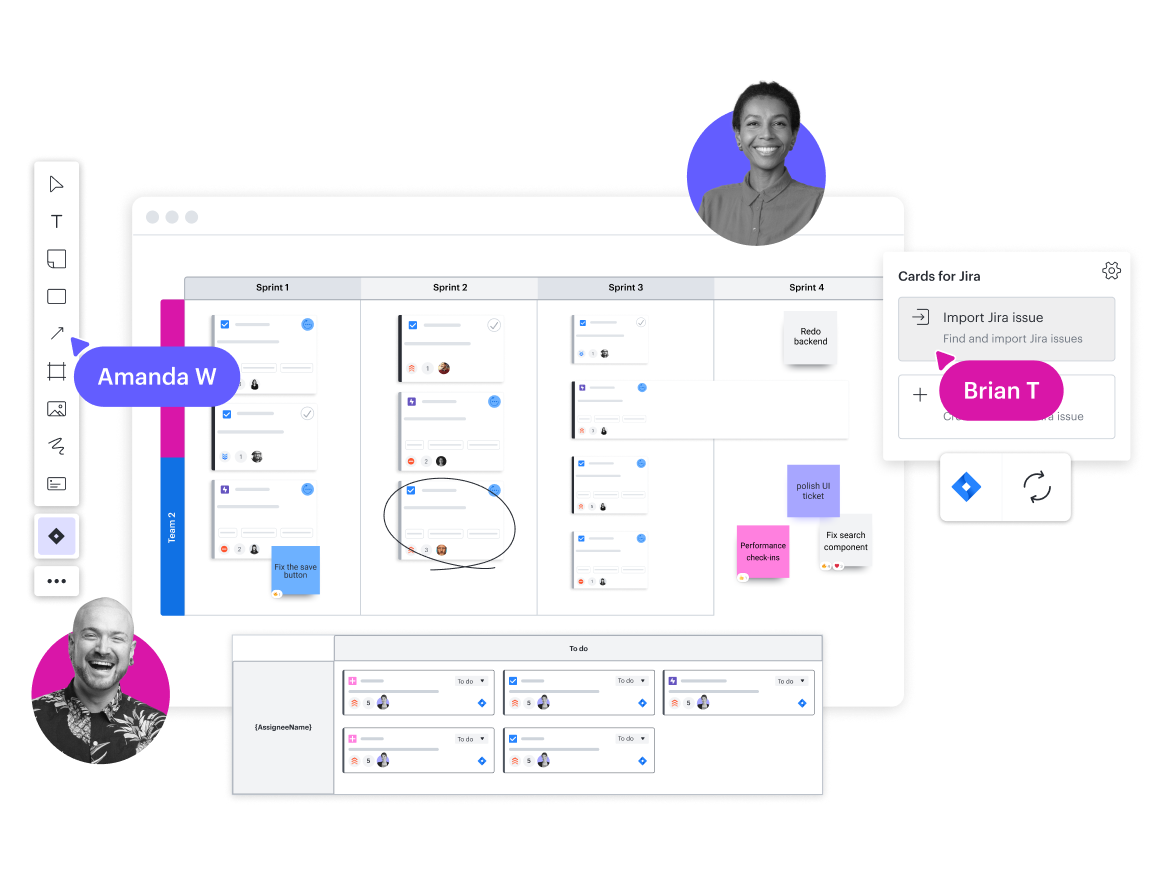
Twórz mapy drogowe
Współpracuj z wielozadaniowymi zespołami, aby ustalać priorytety projektów i tworzyć harmonogramy. Usprawnij planowanie dzięki integracjom z Jira i Azure DevOps.
Usprawnij planowanie strategiczne
Za pomocą paneli graficznych możesz uszeregować priorytety i osiągnąć konsensus. Podziel złożone projekty na łatwe do zarządzania zadania dzięki Kartom Lucid.
Zoptymalizuj swój potok CI/CD
Zwizualizuj łatwą do wdrożenia ścieżkę jednostkową zapewniającą ciągłą integrację i realizację zadań, aby łatwo identyfikować ulepszenia.
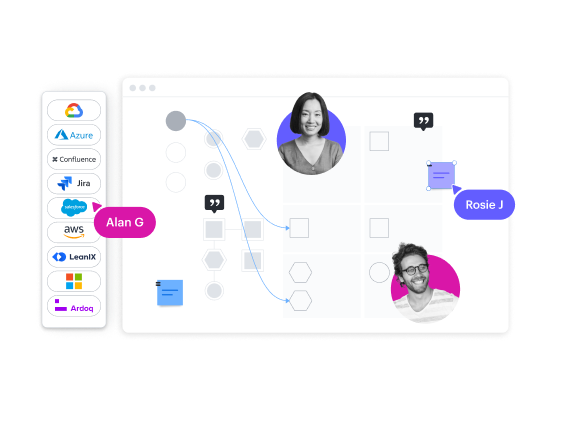
Utwórz dokumentację na potrzeby audytów bezpieczeństwa
Połącz się z dostawcą usług w chmurze (AWS, Azure lub Google Cloud), aby automatycznie tworzyć diagramy infrastruktury w chmurze na potrzeby corocznych audytów bezpieczeństwa.
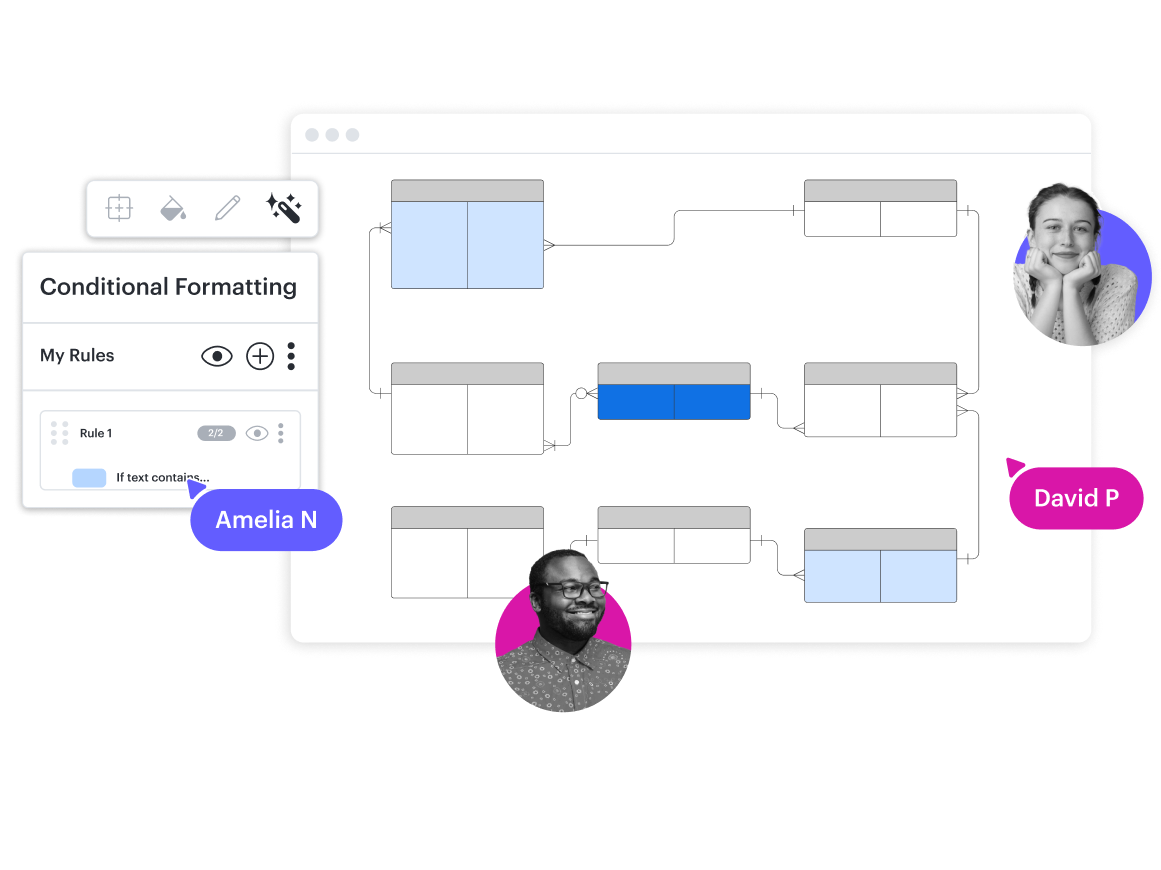
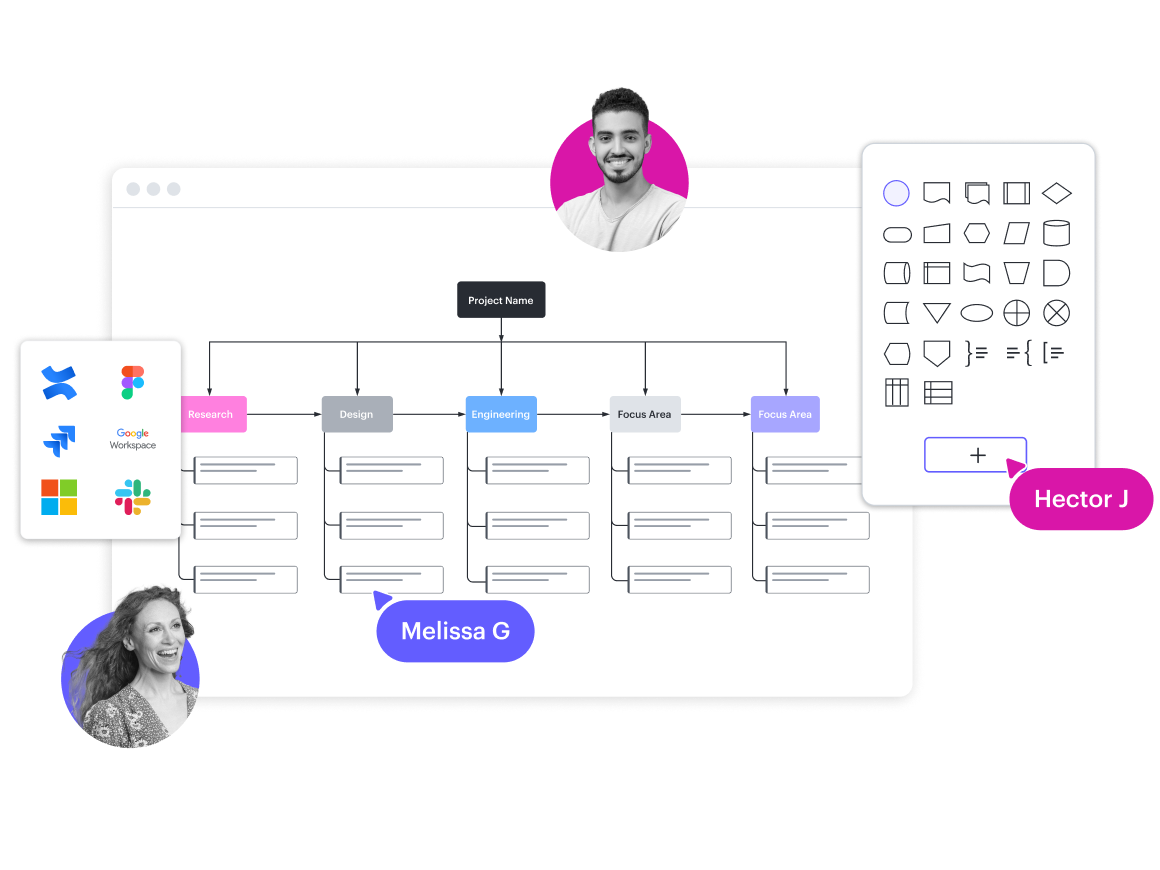
Wizualizuj relacje między podmiotami
Twórz diagramy i dokumentuj relacje między narzędziami wewnętrznymi. Opracuj integrację z Confluence, aby osadzić diagramy w bazie wiedzy.
„Chcemy zagwarantować, że wiedza zdobyta przez poszczególnych konsultantów lub wyniki udanego projektu nie zostaną utracone. W konsultingu zazwyczaj zespół jak najszybciej dostarcza elementy projektu, a pod koniec tego projektu przechodzi do następnego zadania. Wnioski i wyniki zostają zapomniane”.