Almost every product change made here at Lucid is first validated by an A/B test. Over the years, we’ve made a lot of mistakes while running A/B tests and writing the code for managing them. In this series of posts, we’ll be sharing what we learned from these mistakes and how you can avoid them.
Some of the very best A/B tests make as small a change as possible. What we forget is that small changes can have much bigger consequences. For example, we recently tried a new design of our registration dialog. Of course, we were mostly interested in how the dialog would affect the registration rate, but it had some unexpected consequences as well.
The A version and much simpler B version of our registration dialog
Our dialog was a massive success, at least for the registration rate. People loved the dialog and registered in droves.
Wow, a 20% lift in registrations. That's great.
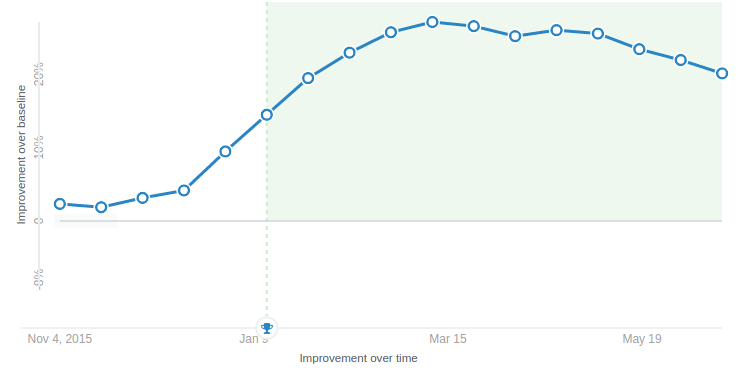
However, a month later, our Director of Product called an emergency meeting with my team. The percent of newly registered users creating new documents, our key engagement metric, had dropped significantly a month ago and never recovered. After some thinking, we pinpointed the only big change that happened around that time, the new registration dialog.

Ouch, a 10% drop in engagement. Wish we had seen that sooner.
Although we had increased the aggregate number of users creating documents, the percent of new registrations that created a document had dropped. More of these new users bounced before creating a document. However, by increasing the top of the funnel, the number of users engaging with the product increased in aggregate. If we had better communicated this impact we may have avoided the panic that came with having an important metric drop so suddenly. Going forward we make a point to track both the key results of the test, as well as other important metrics.
To prevent future mistakes, we needed an AB testing framework that would let us keep track of multiple metrics for a single test, and not just one metric for each test. We decided to measure our users’ actions independent of any tests and then see how our tests affected those actions.
Kissmetrics, one of our analytics providers, offers a simple framework for this kind of measurement. We are able to track the actions each user takes as events and store other information about the user, such as what arm of a test they were shown, as properties. This makes it easy to compare how the different arms of the test affect just about anything our users do.
Learn from our mistake. If you don’t understand the full consequences of your A/B tests, there’s a good chance that you’ll find yourself in trouble down the road. By making sure you understand the possible side-effects each A/B test has, especially on your key metrics, you’ll be able to make better-informed decisions about your tests and iterate on them much more quickly.