The Multi-Armed, Multi-Fingered Bandit: Implementing a Bandit Algorithm in a Multiple-Payout Scenario
Tanner Thompson
Reading time: about 7 min
Topics:
About bandit algorithms
Because of this, there’s been a lot of recent excitement in the tech blogosphere about multi-armed bandit algorithms. These are a family of algorithms that aim to strike a balance between exploration (pure testing, A/B style) and exploitation (garnering maximum revenue by using the best test arm) in order to minimize revenue loss (known as regret) during testing. Understandably, this idea has attracted a lot of fans. However, bandit algorithms are not simply a patch for A/B tests. Rather, the two approaches are solutions to two different, closely related problems. A/B tests are designed for gathering data and determining statistical significance, whereas bandit algorithms are designed for minimizing regret. In many situations, however, bandit algorithms can actually converge to “significance”1 faster. From a human perspective, though, bandit algorithms are comparatively complex, and potential problems with the source data can be more clearly seen through an A/B test. The functional idea behind a bandit algorithm is that you make an informed decision every time you assign a visitor to a test arm. Several bandit-type algorithms have been proved to be mathematically optimal; that is, they obtain the maximum future revenue given the data they have at any given point. Gittins indexing is perhaps the foremost of these algorithms. However, the trade-off of these methods is that they tend to be very computationally intensive. Thompson sampling offers a very simple, elegant solution solution while remaining near-optimal. While it was first developed over 80 years ago, it was never widely implemented until about five years ago. The method is fairly simple:- Keep track of the conversions and failures on each arm
- Use those values to generate a distribution of the probability of each arm to convert
- Sample each distribution
- Assign the next user to the arm with the highest sample
Our first shot at a bandit algorithm
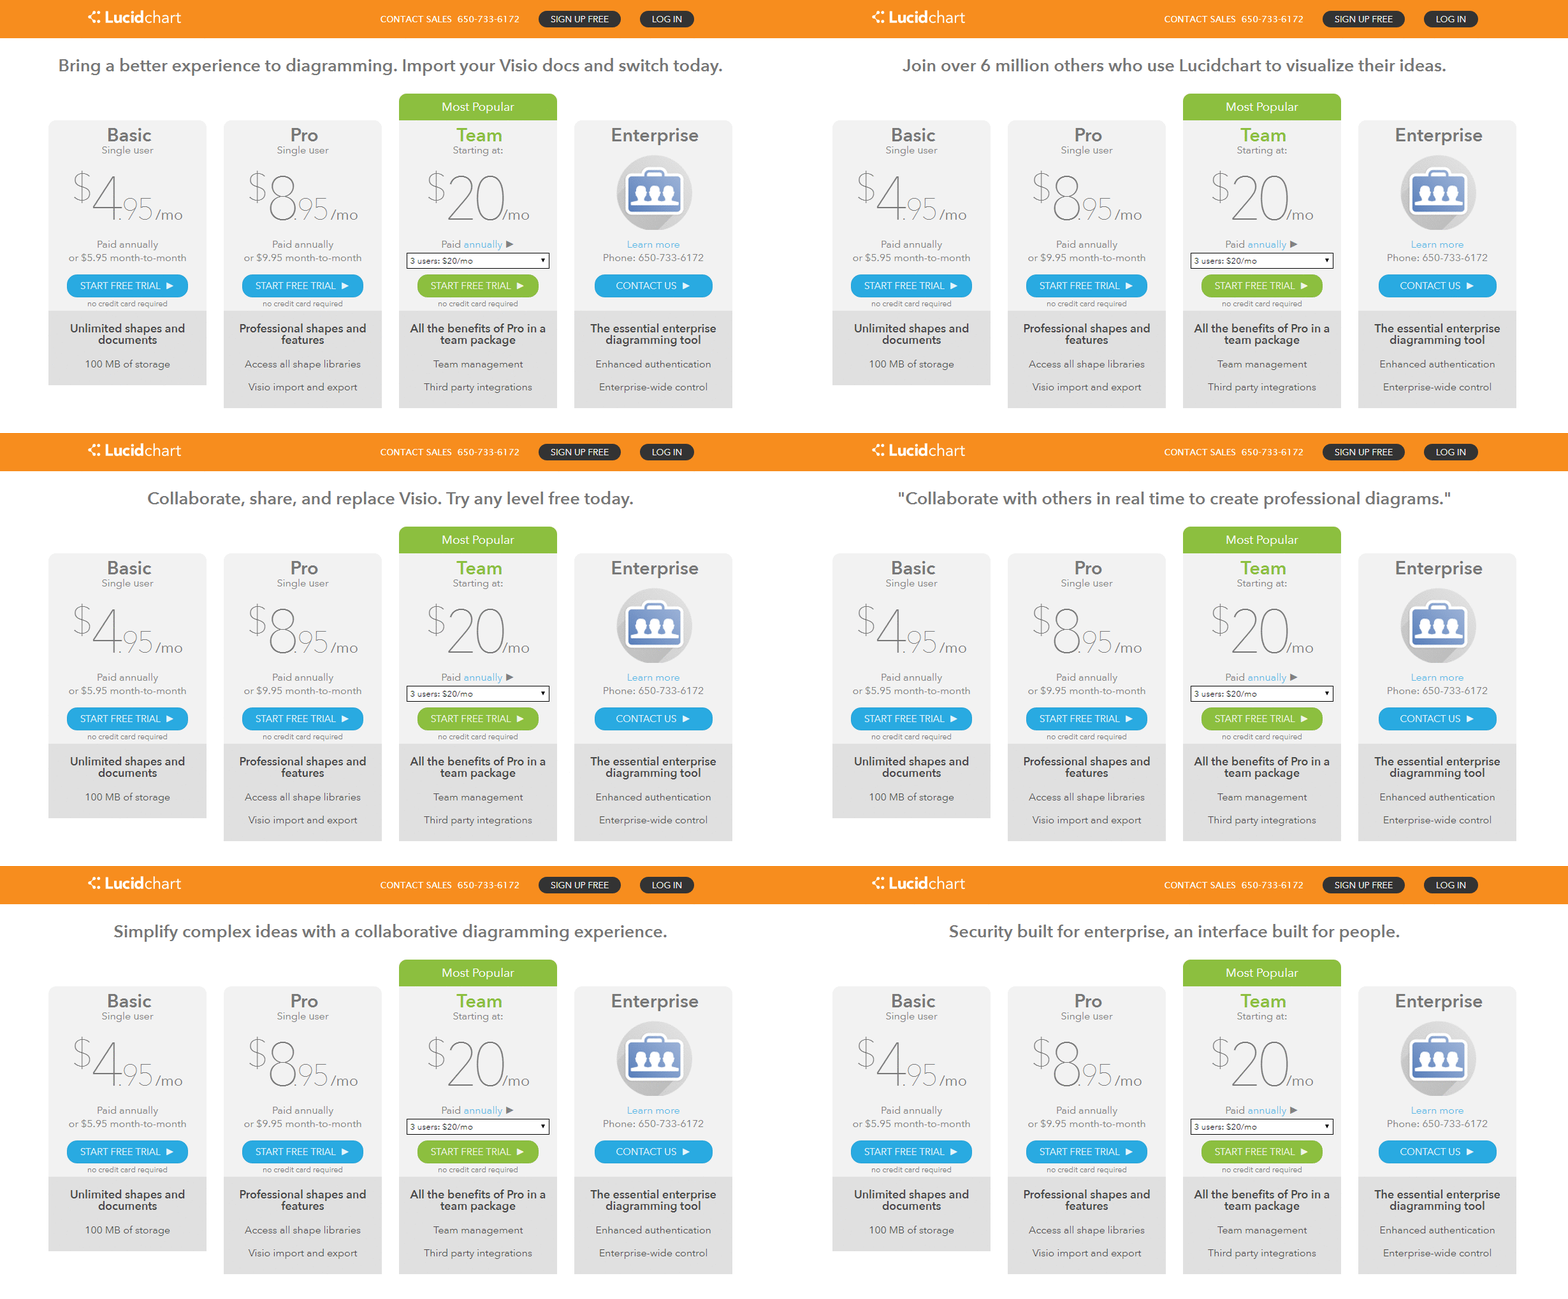
This summer at Lucid Software, we decided to try our hand(s) at implementing a Thompson sampling algorithm to test the taglines we show on our level selection page. The idea was that we could start the test, and then go hands-off and let the algorithm run its course, automatically selecting for the strongest taglines, or continuing to select from the strongest of them if no one tagline emerged as victor. Our level selection page, with rotating examples of different taglines at the top
The problem
This works great when you’re only concerned with one event. However, in our case, we wanted to optimize each arm assignment for revenue—and there are lots of paths to revenue. Specifically, there are several different subscription levels that visitors can select, all with different conversion and revenue yields. To get an idea of how much the different conversion levels were worth relative to each other, we calculated an estimated Customer Lifetime Value (CLV) for each level. Our first idea was to simply increment the number of conversions by a number more than one for each conversion above a free subscription. We scaled all the CLVs down by the CLV of a Free subscription, so that a Free would still correspond to 1, and used those scaled values to increment the conversion totals each time a user converted. However, as we prepared to implement this idea, we realized that there was no theoretical basis for it, and that it destroyed the statistical integrity of our method. Specifically, it caused our algorithm’s confidence in a given arm to increase too quickly when any conversion above Free occurred. We were essentially equating the success of testing one user and having them convert at a premium paid level to the success of testing hundreds of users and having every single one convert to a Free subscription. While the monetary value might be the same in both scenarios, the latter would lead us to have much higher confidence in the arm’s effectiveness than the former.The solution
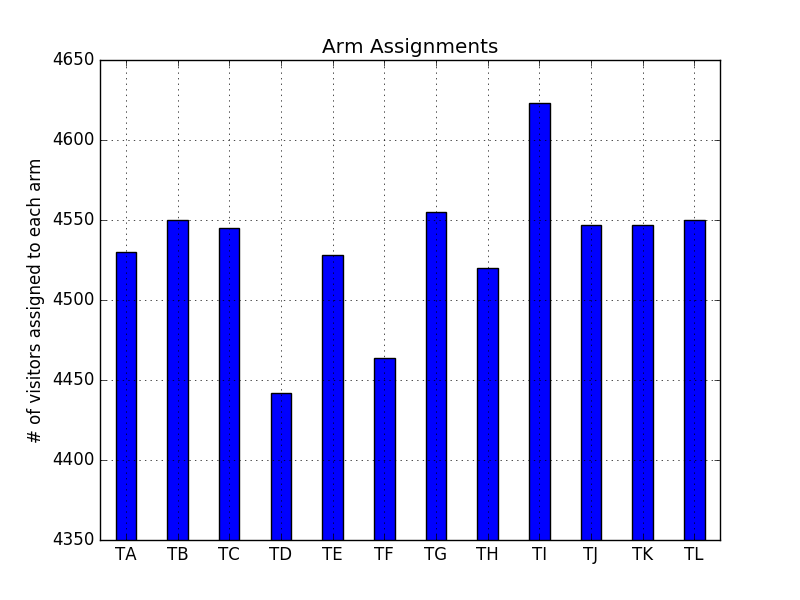
To solve this problem, we decided to keep track of conversions for each subscription level independently on each arm, as well as total number of users assigned to that arm. From this data, we can derive the record of success that the arm has in converting to each different level and use that to initialize a handful of beta distributions representing the respective success of each level. We called these different conversion levels ‘fingers’, since each arm of the test had several of them. Now, when a new user needs to be assigned to an arm, we sample each finger’s distribution, multiply each sample by the CLV of its corresponding subscription level, and add all the results together. (Although this result is not exactly the same as a random sample from the distribution of potential revenue for that arm, you could think of it like that.) We repeat this finger-summing process for every arm, and the user is assigned to whichever arm has the highest total sample value. This multi-fingered, multi-armed approach allowed us to incorporate both the benefit of higher-value conversions and the higher likelihood of lower-value conversions into our assignment decision, while retaining the computational simplicity of the Thompson sampling algorithm. Here’s an example of how our method changed its assignments dynamically. Here’s a plot of the distribution of assignments a couple weeks into the test: The distribution of assignments a couple weeks into the test
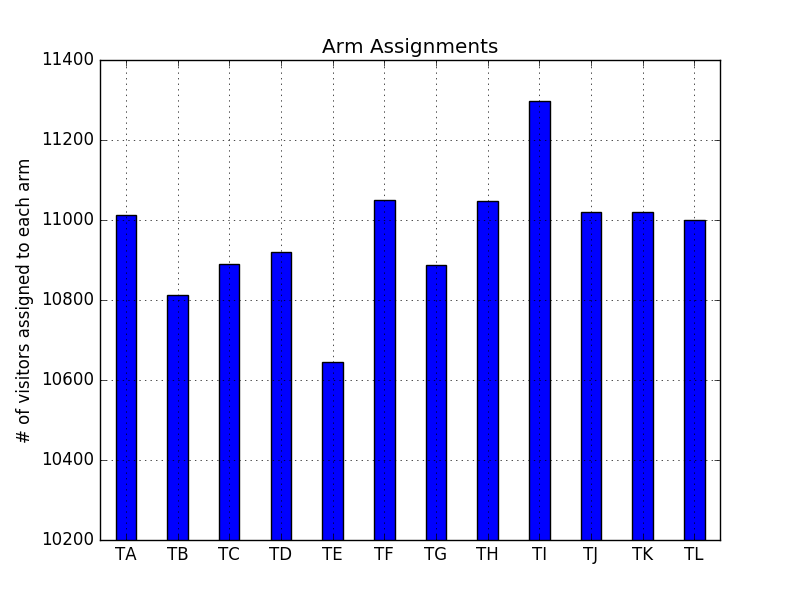
 The distribution of assignments a few weeks later
About Lucid
Lucid Software is the leader in visual collaboration and work acceleration, helping teams see and build the future by turning ideas into reality. Its products include the Lucid Visual Collaboration Suite (Lucidchart and Lucidspark) and airfocus. The Lucid Visual Collaboration Suite, combined with powerful accelerators for business agility, cloud, and process transformation, empowers organizations to streamline work, foster alignment, and drive business transformation at scale. airfocus, an AI-powered product management and roadmapping platform, extends these capabilities by helping teams prioritize work, define product strategy, and align execution with business goals. The most used work acceleration platform by the Fortune 500, Lucid's solutions are trusted by more than 100 million users across enterprises worldwide, including Google, GE, and NBC Universal. Lucid partners with leaders such as Google, Atlassian, and Microsoft, and has received numerous awards for its products, growth, and workplace culture.