How to Create a Downtime Dashboard Tool with Zapier and Google Sheets
Thayne Mc Combs
Reading time: about 8 min
Topics:
- a record of incidents containing the duration of downtime, the service(s) affected, and information about the cause and resolution
- ability to mark incidents as false positives and exclude them from downtime calculations
- ability to correct the downtime recorded for an incident
- ability to see the number of minutes of downtime for one or more services over a given time period
- a graph of monthly downtime per service
- a graph of total downtime

Step 1: Getting the data
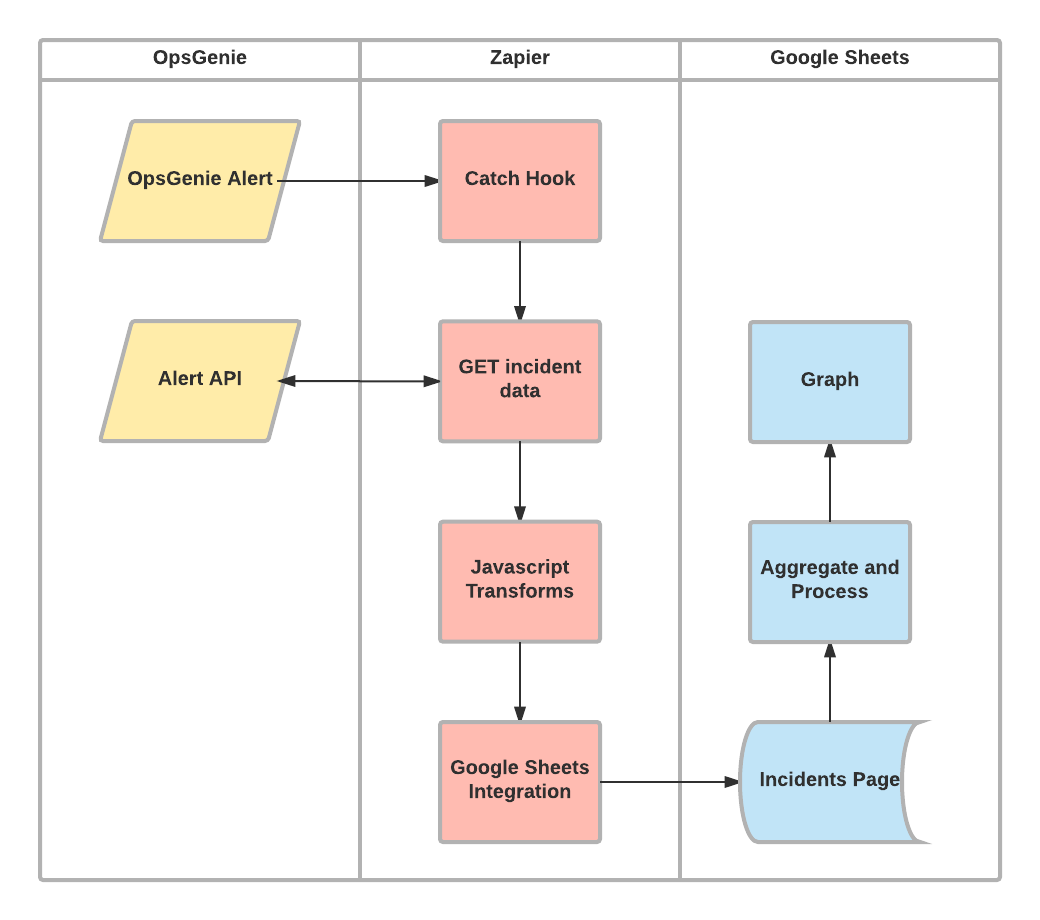
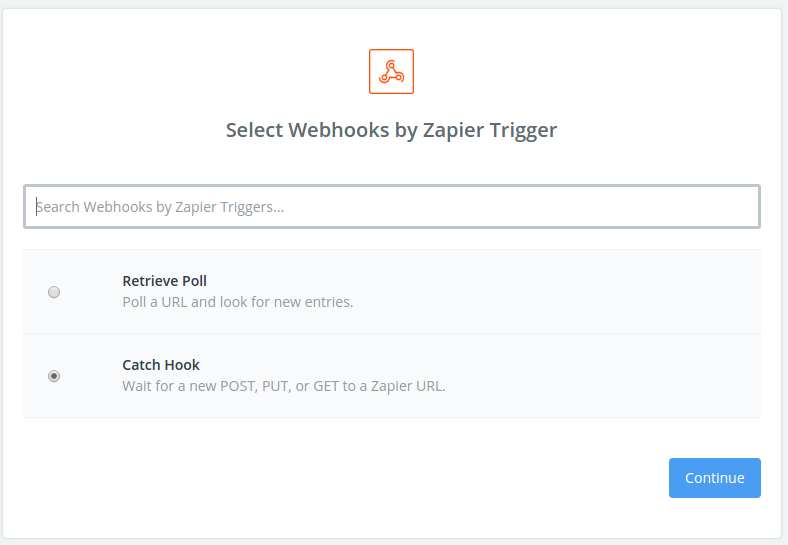
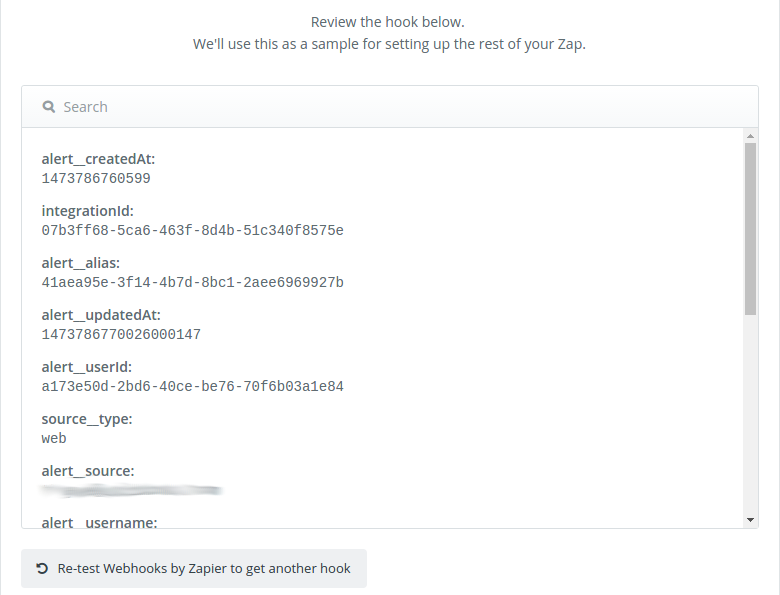
The first thing we needed to do was get the incident information into Zapier. There are two kinds of web hooks that Zapier supports: catch hooks and polling. With a catch hook, Zapier provides you with a URL to which you can post JSON data to begin the pipeline. With polling, on the other hand, you give Zapier a URL which it will periodically fetch, and then you look for differences. If there is a difference from the last poll, it will start processing the new data. Catch hooks are preferable, since a request is only made when new data is actually available. However, depending on your application, catch hooks may not be feasible.

Step 2: Sending data to Google Sheets
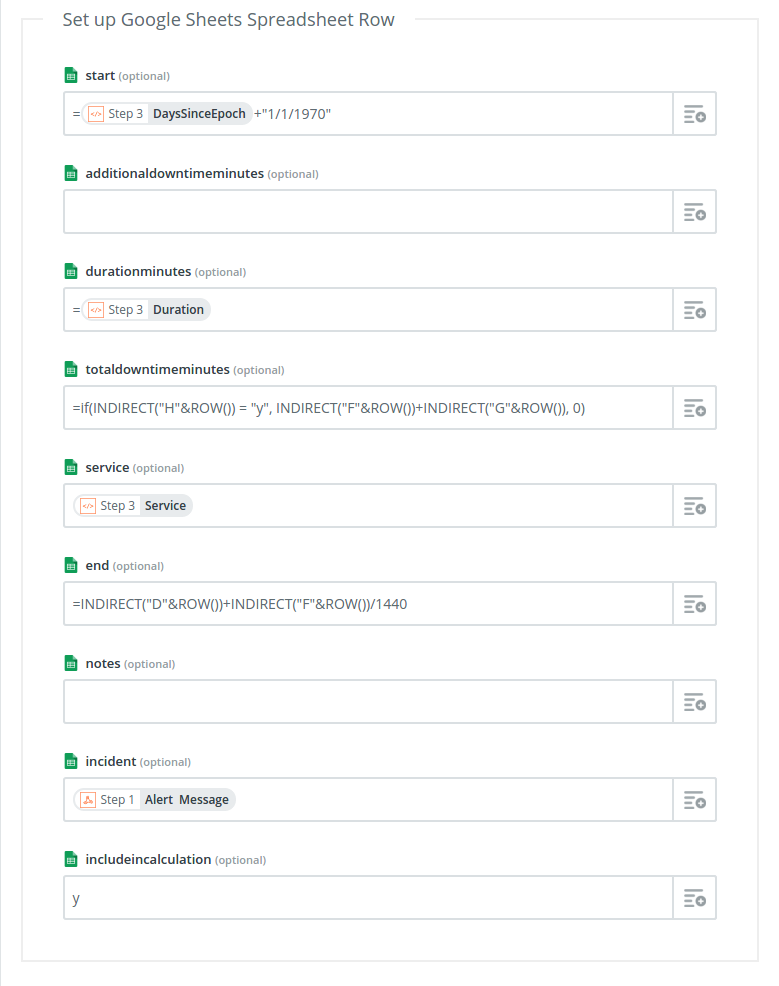
The main reason we went with Zapier is that it makes it extremely easy to add data to Google Sheets. Essentially you just create a template that uses data retrieved from previous steps in the pipeline, and that template is used to create or update a row in a spreadsheet. The template is basically a form with fields that come from a header row on the spreadsheet that the data will be exported to. The sheets integration also has a "Lookup Spreadsheet Row" option, which allows you to look up a row based on a key column, and possibly add a new row, if one doesn't exist. This is the option we used, to avoid adding duplicate entries, using the alert id as the deduplication key.
INDIRECT and ROW functions. For example, in order to reference the D cell on the current cell you would use INDIRECT("D"&ROW()). This concatenates the string "D" with the number of the row and then converts the string to a cell reference. This works pretty well, but is somewhat brittle since if the order of the columns ever changes the Zapier template needs to be updated to match.
Finally, although not completely necessary, transforming the data a little bit in Zapier before sending it to Google Sheets made building the spreadsheet easier and more performant. This is possible using the "Code by Zapier" action, which allows you to run a simple javascript function to transform your data. We did three things with this:
- Parse the name of the service from the message of the OpsGenie alert.
- Convert the timestamp of the alert creation from nanoseconds to days because days are the units Google Sheets uses for datetimes.
- Convert the closeTime (i.e. the duration) from milliseconds to minutes.
Step 3: Analyzing Data
Once we had the incident data in a page of our spreadsheet, we needed to create pages for the analysis and graphs. The graphs themselves are pretty straightforward, but generating the data to graph is less so. First we wanted to be able to calculate the minutes of downtime and percentage of uptime for each service between a start and end date. In order to do so, we created a cell for the start date and a cell for the end date. Conveniently, Google sheets will pop up a date selector if you double click on a cell containing a date. To sum all the downtime for all incidents in the time range split by services we use the following formula=sumifs(incidents!C:C,A2,arrayformula(datevalue(incidents!D:D)),">"&$D$2,arrayformula(datevalue(incidents!D:D)),"<"&$E$2), where incidents!C:C is a range containing the total downtime for the incidents, A2 is the cell containing the name of the service, incidents!D:D is a range containing the timestamps corresponding to the durations in C, and D2 and E2 are the cells containing the start and end date, respectively. To make the dashboard easier to use, we also generate the service names using the formula =sort(unique(incidents!C:C)).

function totalDowntime(range) {
  if (typeof(range) != 'object') {
    return 0;
  }
  var merged = [];
  var current = null;
  for (var i = 0; i < range.length; i++) {
    var start = range[i][0],
        end = range[i][1];
    if (current && start <= current[1]) {
      current[1] = end;
    } else {
      current = [start, end];
      merged.push(current);
    }
  }
  return merged.reduce(function(minutes, dur) {
    return minutes + (dur[1] - dur[0])/60000;
  }, 0);
}
Conclusion
Although we were disappointed when we were unable to find a downtime dashboard tool that provided the functionality we needed, it was surprisingly easy to build something that worked using Zapier and Google Sheets. So far we have been pretty happy with the result. Eventually we may need something a little more robust and scalable, but for now an automatically generating spreadsheet is sufficient. What was your most successful project that was quickly hacked together with minimal resources?About Lucid
Lucid Software is the leader in visual collaboration and work acceleration, helping teams see and build the future by turning ideas into reality. Its products include the Lucid Visual Collaboration Suite (Lucidchart and Lucidspark) and airfocus. The Lucid Visual Collaboration Suite, combined with powerful accelerators for business agility, cloud, and process transformation, empowers organizations to streamline work, foster alignment, and drive business transformation at scale. airfocus, an AI-powered product management and roadmapping platform, extends these capabilities by helping teams prioritize work, define product strategy, and align execution with business goals. The most used work acceleration platform by the Fortune 500, Lucid's solutions are trusted by more than 100 million users across enterprises worldwide, including Google, GE, and NBC Universal. Lucid partners with leaders such as Google, Atlassian, and Microsoft, and has received numerous awards for its products, growth, and workplace culture.