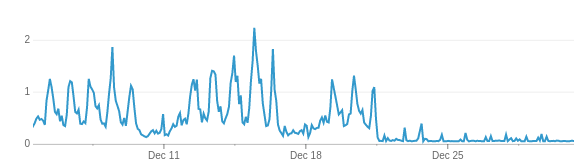
At Lucid, we have a service-oriented architecture. One of these services is a font service that is responsible for serving font data based on family and unicode range and checking permissions for user-uploaded fonts. We didn't expect the font service to have particularly high load1 (load is the average number of threads using or waiting for the CPU). However, last year we noticed surprisingly high load on the font service, especially at night when we actually had less traffic. Fortunately, we were able to find the root cause and dramatically increase the performance of our font service and the stability of our system overall. Here is how we did it.
Figure 1: Server load before and after change. (Fix was released Dec 21.)
Debugging with flame graphs
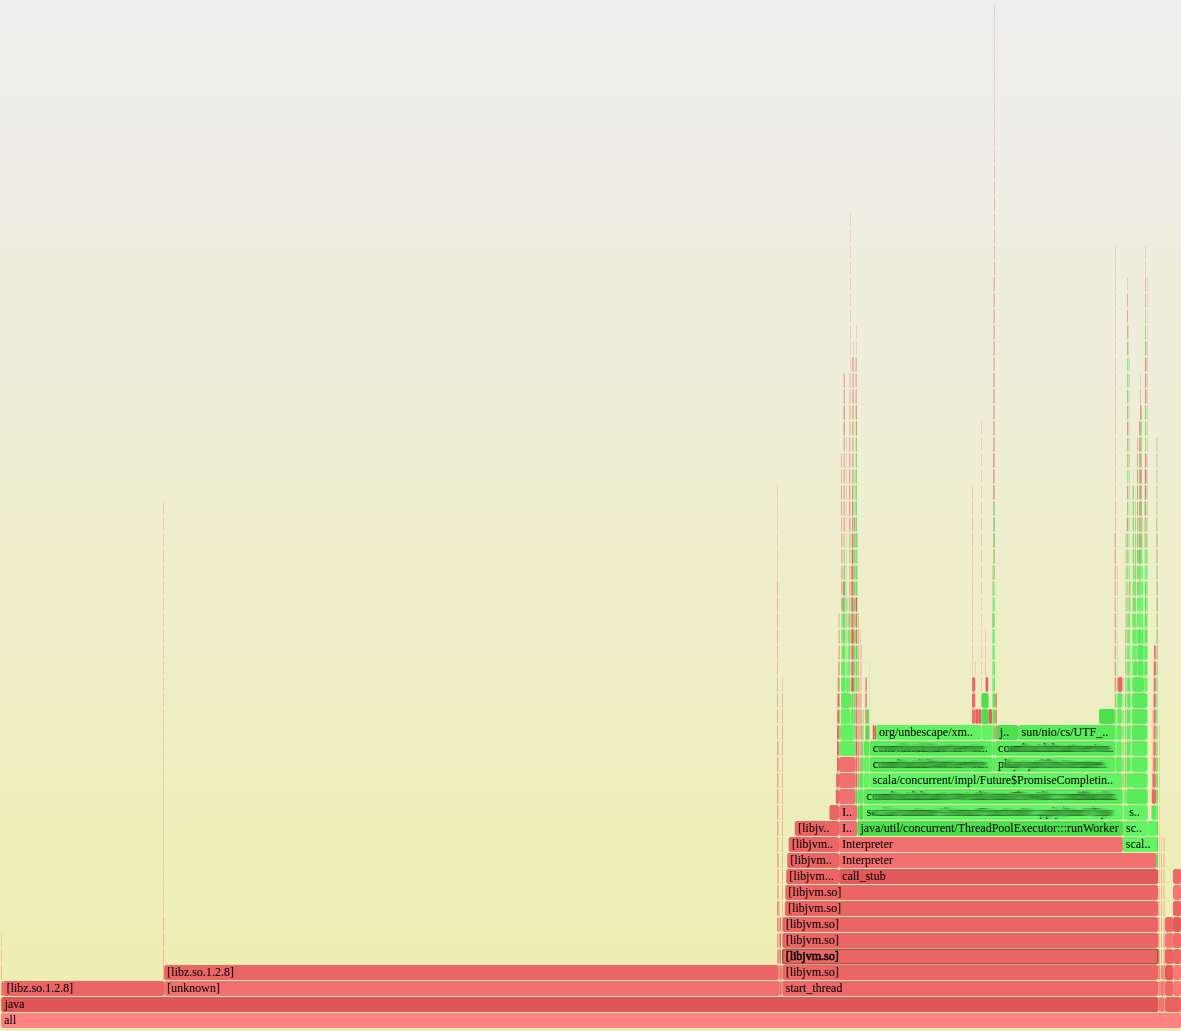
One of my coworkers found and deployed a neat flamegraph tool from Brendan Gregg at Netflix. This tool combines data from multiple profiling tools to visualize resource usage by both native and JVM functions in a single graph. Each rectangle in the graph represents a single stack frame—the width of the rectangle shows how much of a resource, such as CPU time, was used, and the y-axis represents the call stack. To find problematic functions, you simply identify wide rectangles. This tool was invaluable in debugging the performance of the font service.
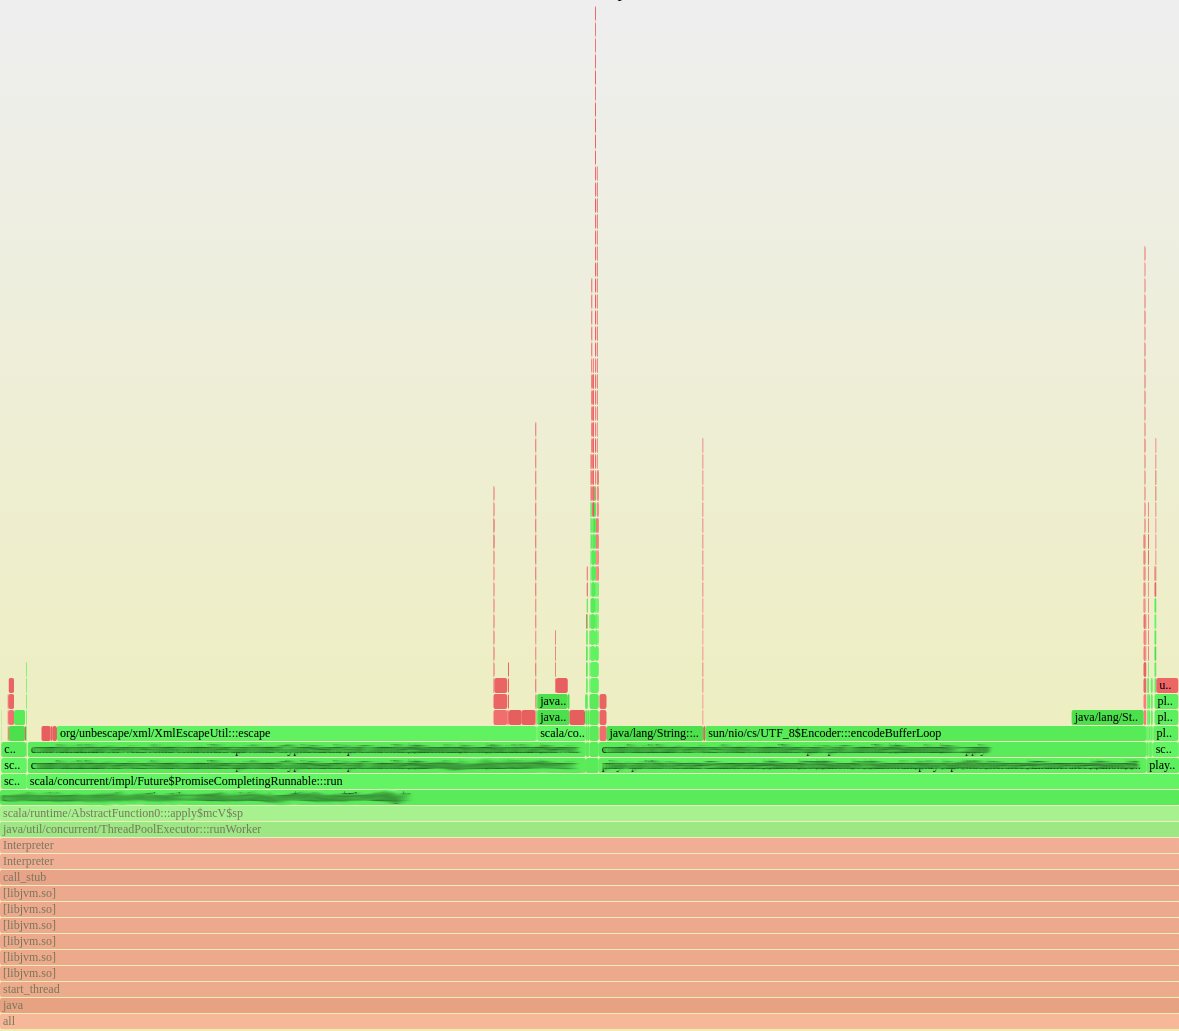
Figure 2: A flame graph from a font server during high load.We collected several flame graphs from the font service while in a high load state. One of these flame graphs is shown here, along with a close up of the JVM portion of the flame graph. We quickly noticed a pattern in these flame graphs. Most of the overall time was spent in libz.so (used for gzip compression/decompression), and most of the time in the JVM was spent by XML escaping and UTF-8 encoding.
Figure 3: A flame graph zoomed in to the JVM portion.
Why it was slow
First, here’s a little background on how our font service worked. We stored font data in an Amazon S3 bucket with a separate object for each unicode range for each font. Other services would request font data for a font family, a set of unicode ranges, and a user. The font service would download the data for the specified ranges for every font in the family that the user had access to and then return an XML response containing all the data.
This functionality is all pretty simple, and there wasn't anything obviously computationally intensive about it. And yet, we had high load. The flame graphs helped us identify that libz, XML escaping, and UTF8 encoding were using a lot of CPU. But why were we spending so much time encoding and compressing? Remember how I said the load was highest at night? Well, night for us (US Mountain Time) is daytime in Asia. While we were getting less traffic at night here at home, a lot of users elsewhere were using unicode ranges of Asian languages like Chinese, Japanese, and Korean during this time. It turns out the font data was significantly larger for these ranges. This data was gzip decompressed and UTF-8 decoded and then XML escaped, UTF-8 encoded, and gzip compressed. For the tiny Basic Latin range, this process wasn't a big deal. However, a single CJK range is two orders of magnitude larger than the Basic Latin range (1MB compared to 60KB). For these larger ranges, all these transformations overwhelmed the CPU. Gzip compression and decompression are relatively expensive, and XML escaping isn't exactly speedy.
How we made it fast
The content of the response from the font service was essentially just a collection of raw data from S3. The font service did perform some important additional tasks, like permission checking and looking up font keys from the name of a font family. However, there was no reason why the font service had to proxy the font data from S3. Our solution was straightforward. Rather than downloading and re-encoding the font data in the font service, we simply responded with a list of direct links to the S3 objects containing the font data.
This change reduced the load on our font servers to almost nothing (see Figure 1). It also had no noticeable impact to the client services. Although our first attempt was successful, I should note that we deployed it with a feature flag that lets us turn it on for a percentage of requests to test that it worked well before turning it on 100%.
Conclusion
By profiling our production servers, we were able to find and eliminate unnecessary work that our servers were performing. Here’s a look at some key takeaways from our experiences.
Use profiling tools such as flame graphs to identify functions that are hogging the CPU.
Compression and other encodings can be expensive.
If the client can access data directly, sending a link rather than proxying the data can improve overall performance. (Disclaimer: this isn't a magic bullet and in some cases can hurt performance on the client, since it has to make a second request).
1: Load is the average number of threads using or waiting for the CPU. See Wikipedia.
About Lucid
Lucid Software is the leader in visual collaboration and work acceleration, helping teams see and build the future by turning ideas into reality. Its products include the Lucid Visual Collaboration Suite (Lucidchart and Lucidspark) and airfocus. The Lucid Visual Collaboration Suite, combined with powerful accelerators for cloud and process transformation, empowers organizations to streamline work, foster alignment, and drive business transformation at scale. airfocus, an AI-powered product management and roadmapping platform, extends these capabilities by helping teams prioritize work, define product strategy, and align execution with business goals. The most used work acceleration platform by the Fortune 500, Lucid's solutions are trusted by more than 100 million users across enterprises worldwide, including Google, GE, and NBC Universal. Lucid partners with leaders such as Google, Atlassian, and Microsoft, and has received numerous awards for its products, growth, and workplace culture.