Dashboards are a powerful way to communicate data to your team. One use for dashboards is tracking the progress of key performance indicators (KPIs). One KPI tracked at Lucid is the ranking and performance of our products in third-party marketplaces. Although there are enterprise-grade products to gather and visualize this type of data, you can generate automated dashboards with only Google Apps Script and Google Sheets. We’ve used this approach to track our apps in the Atlassian Marketplace, and the same techniques can be used in conjunction with many public APIs such as:
GitHub
Google (through unofficial third-party APIs for Play and Chrome Webstore)
iTunes
Let’s walk through a scenario where this would be useful. Suppose your team has recently released an open source project to GitHub. You want to track a few KPI’s: stargazers, subscribers, and open issues. These will give you insight into the popularity of the repository and how well you are resolving issues that come up. You want to create a dashboard to track these KPIs and provide visual insight on the progress for each KPI.On the surface, this is a simple task, but there are a few things to consider when communicating via a dashboard:
Make the information easy to consume.
Keep the data up to date without tedious data entry.
A few weeks ago, my teammate addressed the first issue with a great post on How to Make a Killer Data Dashboard with Google Sheets. This week we’ll dive into keeping the dashboard up to date automatically with a Google Apps Script. Save a copy of the final spreadsheet for reference. Note: The data before Dec. 13, 2017 is simulated data.
Step 1: Become familiar with the API you will be accessing
Each of the above listed APIs have a vast amount of data you can gather. Spend some time familiarizing yourself with the API you will be using. The approach outlined below is very flexible, but certain types and large quantities of data may be better suited for purpose built software. For our scenario, however, the GitHub API provides easy access to the information we need to track at the following rest URL:
https://api.github.com/:owner/:repo
The response of this request includes the number of stargazers, subscribers, open issues, and much more information that could be tracked. For this post, we’ll only focus on these three KPIs for two repositories from the user lucidsoftware: xtract and relate.
Step 2: Create a Google Apps Script to pull data from the API
Google Apps Script is a language based on JavaScript to let you manipulate Google Sheets (and the rest of G Suite). It can be accessed from within Google Sheets from Tools > Script Editor. To get started, let’s create a rudimentary function to send a request to GitHub’s API. Here is a simple snippet of code which accesses GitHub’s API, gets the number of stargazers for xtract, and puts the value in cell A2. We will expand this snippet of code as we go.
function updateGithubSheet(){
  // Make a request to GitHub's rest API and get the number of star gazers
  var restUrl = 'https://api.github.com/repos/lucidsoftware/xtract';
  var data = makeJsonRequest(restUrl)
  var numStarGazers = data['stargazers_count'];
  // Write to cell A1 of the active sheet
  var activeSheet = SpreadsheetApp.getActiveSheet();
  activeSheet.getRange("A2").setValue(numStarGazers);
}

function makeJsonRequest(url){
  var response = UrlFetchApp.fetch(url);
  return JSON.parse(response.getAs('application/json').getDataAsString());
}
We can now get data from GitHub! This is great but not very useful. Now, modify the script to add a row each time the updateGithubSheet method is called, and put a date in the first column.
function updateGithubSheet(){
  ...
  var activeSheet = SpreadsheetApp.getActiveSheet();
  addRow(activeSheet, numStarGazers);
}

function addRow(sheet, numStarGazers){
  var lastRow = sheet.getLastRow();
  var nextRow = lastRow + 1;
  var column = 1;
  sheet.getRange(nextRow, 1).setValue(new Date());
  sheet.getRange(nextRow, column).setValue(numStarGazers);
}
Although this script is slightly more useful, it is not very versatile. Just as a good developer creates reusable code, a good spreadsheet maker creates reusable spreadsheets. One way to improve our script and sheet is to define the user, repository name, and fields of interest in the sheet itself using the Template Sheet Pattern.
The Template Sheet Pattern
The Template Sheet Pattern has two parts:
The Template Sheet provides information for the script to process in locations determined by a contract.
The script updates the Template Sheet as determined by a contract.
The concepts in this pattern are very simple but allow for reusing code and spreadsheets in a powerful way. We’ll revisit this after discussing the contract used in this tutorial.
The Contract
First, we need a way to signify that a sheet meets the contract. One way is using a key in cell A1. For example, a key GITHUB could signify making a request to GitHub’s API and storing the values of specified fields. Here is the GITHUB contract we will follow in this tutorial:
Contract: GITHUB
The Sheet will:
Have the Github Username in field B2.
Have the Github Repository in field B3.
Have row 4 starting at column B contain the Field Names in the response JSON. The Field Names terminate on the first column with an empty row 4.

The Script will:
Add one row after the last row on the sheet.
The new row will have the timestamp in column 1 followed by the Field Values corresponding to the Field Names from row 4.
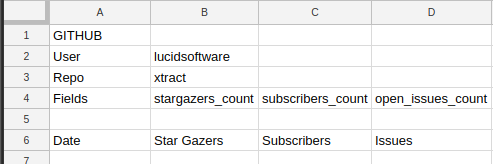
A spreadsheet meeting this contract for the xtract repository and our three KPIs follows:An example spreadsheet meeting the contract of the GITHUB keyAs you can see, adding a fourth KPI (such as forks) requires adding only one field at cell E4. Similarly, tracking a new repository requires only creating a new sheet that matches this template with a different repository name. Establishing this contract makes tracking new KPIs very easy.Before developing code to meet the contract, first create a simple method to scan sheets for known contracts. The following method routes all sheets with the GITHUB key to the updateGithubSheet method. If you create additional contracts, you can also route them in this method.
function updateAllSpreadsheets(){
 // Go through each spreadsheet and check for the key
  SpreadsheetApp.getActive().getSheets().map(function (sheet){
    var sheetKey = sheet.getRange("A1").getValue();
    if (sheetKey === "GITHUB"){
      updateGithubSheet(sheet);
    }
    // Route to other keys here
  });
}
Meeting the contract
We can now modify the updateGithubSheet method to meet the GITHUB contract. First, dynamically create the rest URL based on the provided Template Sheet.
function updateGithubSheet(sheet){
  // Make a request to GitHub's rest API
  var userName = sheet.getRange("B2").getValue();
  var repoName = sheet.getRange("B3").getValue();
  var restUrl = 'https://api.github.com/repos/' + userName + "/" + repoName;
  var data = makeJsonRequest(restUrl)
  ...
}
Second, create a method to get all of the Field Names from row 4 as specified in the contract. Here we rely heavily on the contract and stop checking columns once we find a blank cell. This could be more robust, but for the purpose of the tutorial, we will require strict adherence to the contract.
function updateGithubSheet(sheet){
  ...
  var data = makeJsonRequest(restUrl)
  var fieldValues = getFieldValues(sheet, 4, 2, data);
  ...
}

function getFieldValues(sheet, fieldRow, startColumn, data){
  var fieldValues = [];
  var offset = 0;
  while(!sheet.getRange(fieldRow,startColumn + offset).isBlank()){
    var fieldKey = sheet.getRange(fieldRow, startColumn + offset).getValue();
    fieldValues[offset] = data[fieldKey];
    offset = offset + 1;
  }
  return fieldValues;
}
Finally, update the addRow method to add an array of Field Values to the Template Sheet corresponding with the specified Field Names.
function updateGithubSheet(sheet){
  …
  var fieldValues = getFieldValues(sheet, 4, 2, data);
  addRow(sheet, fieldValues, 2);
}

function addRow(sheet, fieldValuesArray, startColumn){
  var lastRow = sheet.getLastRow();
  var nextRow = lastRow + 1;
  sheet.getRange(nextRow, 1).setValue(new Date());
  fieldValuesArray.forEach(function(fieldValue, offset) {
    sheet.getRange(nextRow, startColumn + offset).setValue(fieldValue);
  });
}
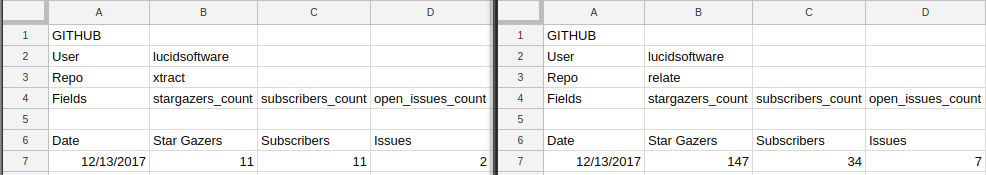
(Note that this contract only allows you to access elements of the JSON at the root level. You could easily create a contract that would dig down multiple levels and follow REST links in the response. This contract is very basic.)Now running the udpateGithubSheet method will update all Template Sheets in the document with the GITHUB key.An example of two Template Sheets updated that match the GITHUB contractThis pattern allows for a flexible and reusable way to gather data and requires little work when new fields or sources need to be tracked.
Step 3: Set up an automated trigger to pull data
Automating the script requires a trigger to fire on a recurring basis. To create a trigger, select from the Script Editor toolbar and create a time-driven trigger. For this example, use a daily trigger on the updateAllSpreadsheets method. When setting these triggers, be aware of API rate limits—if you set the trigger to run too often(usually on the scale of minutes), it can exceed these rate limits.
Step 4: Format and Visualize the data
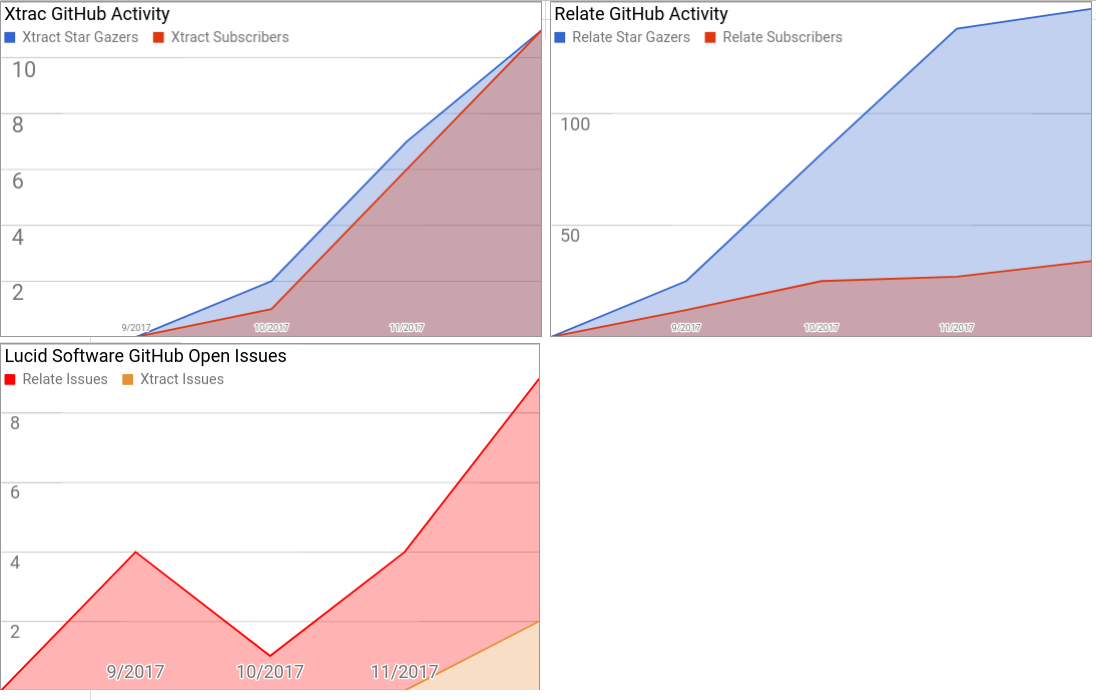
Now that we have an automatically updating data set, the next step is to format the data. An important principle with spreadsheets is to keep the logic and data separate. In line with this principle, we will create a summary tab to format the data for display.Although we are gathering data from GitHub on a daily basis, it may be more useful to display the data on a monthly basis. We’ll create a formula on the summary page to get the last data point each month and use that data to create a dashboard (you could also do an average or other methods for aggregating the data). The following formula shows one way to aggregate this data (alternatively, you can use Google’s query function instead of a formula).
This formula has two major parts. The expression inside MAX works by finding an array containing the row number in the xtract sheet where the date corresponding with the row is between the first day of the month and the first day of the next month. The xtract subscribers value in the row corresponding to the maximum value in this array is displayed. If there are no values in the date range, the if statement is processed, which will show 0 or empty where appropriate.Finally, create the dashboards from the formatted data. See How to Make a Killer Data Dashboard with Google Sheets for tips and tricks. The following dashboard was created using these principles. The ipen issues data from this tutorial is shown in a stacked area chart. This is useful because it shows how many total issues needed to be resolved across both repositories. Visualizing the stargazers and subscribers as non-stacked area charts helps show both the number and proportions of these values.Example of a dashboard that updates automatically to track the KPIs for the relate and xtract repositories
Conclusion
This approach offers a relatively simple and flexible way to create automated dashboards. It requires initial investment creating and implementing a contract but makes it very easy to update and expand which data is tracked as KPIs change.Final spreadsheet
About Lucid
Lucid Software is the leader in visual collaboration and work acceleration, helping teams see and build the future by turning ideas into reality. Its products include the Lucid Visual Collaboration Suite (Lucidchart and Lucidspark) and airfocus. The Lucid Visual Collaboration Suite, combined with powerful accelerators for cloud and process transformation, empowers organizations to streamline work, foster alignment, and drive business transformation at scale. airfocus, an AI-powered product management and roadmapping platform, extends these capabilities by helping teams prioritize work, define product strategy, and align execution with business goals. The most used work acceleration platform by the Fortune 500, Lucid's solutions are trusted by more than 100 million users across enterprises worldwide, including Google, GE, and NBC Universal. Lucid partners with leaders such as Google, Atlassian, and Microsoft, and has received numerous awards for its products, growth, and workplace culture.

 from the Script Editor toolbar and create a time-driven trigger. For this example, use a daily trigger on the updateAllSpreadsheets method. When setting these triggers, be aware of API rate limits—if you set the trigger to run too often(usually on the scale of minutes), it can exceed these rate limits.