The Critical Path: Optimizing Load Times With the Chrome DevTools
Ben Dilts
Reading time: about 9 min
Topics:
Recently, my team was tasked with delivering a limited version of Lucidchart to embed inside another application. Because Lucidchart would only represent a small part of the total functionality visible to the user, we wanted to make sure that we didn’t bog down the overall load time.
Our total time budget for loading the application and displaying user-generated content was 2 seconds. That’s around half the median load time of our full application.
About a month later, we delivered on that goal. Here’s how we did it.
Reliably measure progress
The load time of a complex web application depends on a dizzying variety of factors outside of the actual assets you send to the browser. These factors include:
- Network throughput
- Network latency and reliability
- Browser cache state
- CPU power available
In order to reliably measure how well a particular attempt at optimization worked, we needed to reduce the impact of those factors on our measured performance. To that end, our benchmarking process was as follows:
- Run on known hardware—a standard Linux development laptop (Lenovo P50, i7, 32GB RAM, SSD)
- Run on a fresh launch of Chrome
- In the Chrome DevTools:
- Turn off the browser cache

- Throttle bandwidth to “Fast 3G”
- Throttle CPU to 4x slowdown

- Turn off the browser cache
Throttling back the bandwidth and CPU not only gives a result more real-world result, but it also makes the resulting measurements more reliable from one test run to the next. Each time we wanted to check performance, we ran the entire process (shut down Chrome, start it up, set up dev tools, load the page) three times to make sure our measurement wasn’t an outlier.
To arrive at a full speed 2-second load time, we set a goal of a throttled, cold cache 9-second load time. On our first measurement, we were at around 13 seconds.
Cut the fat
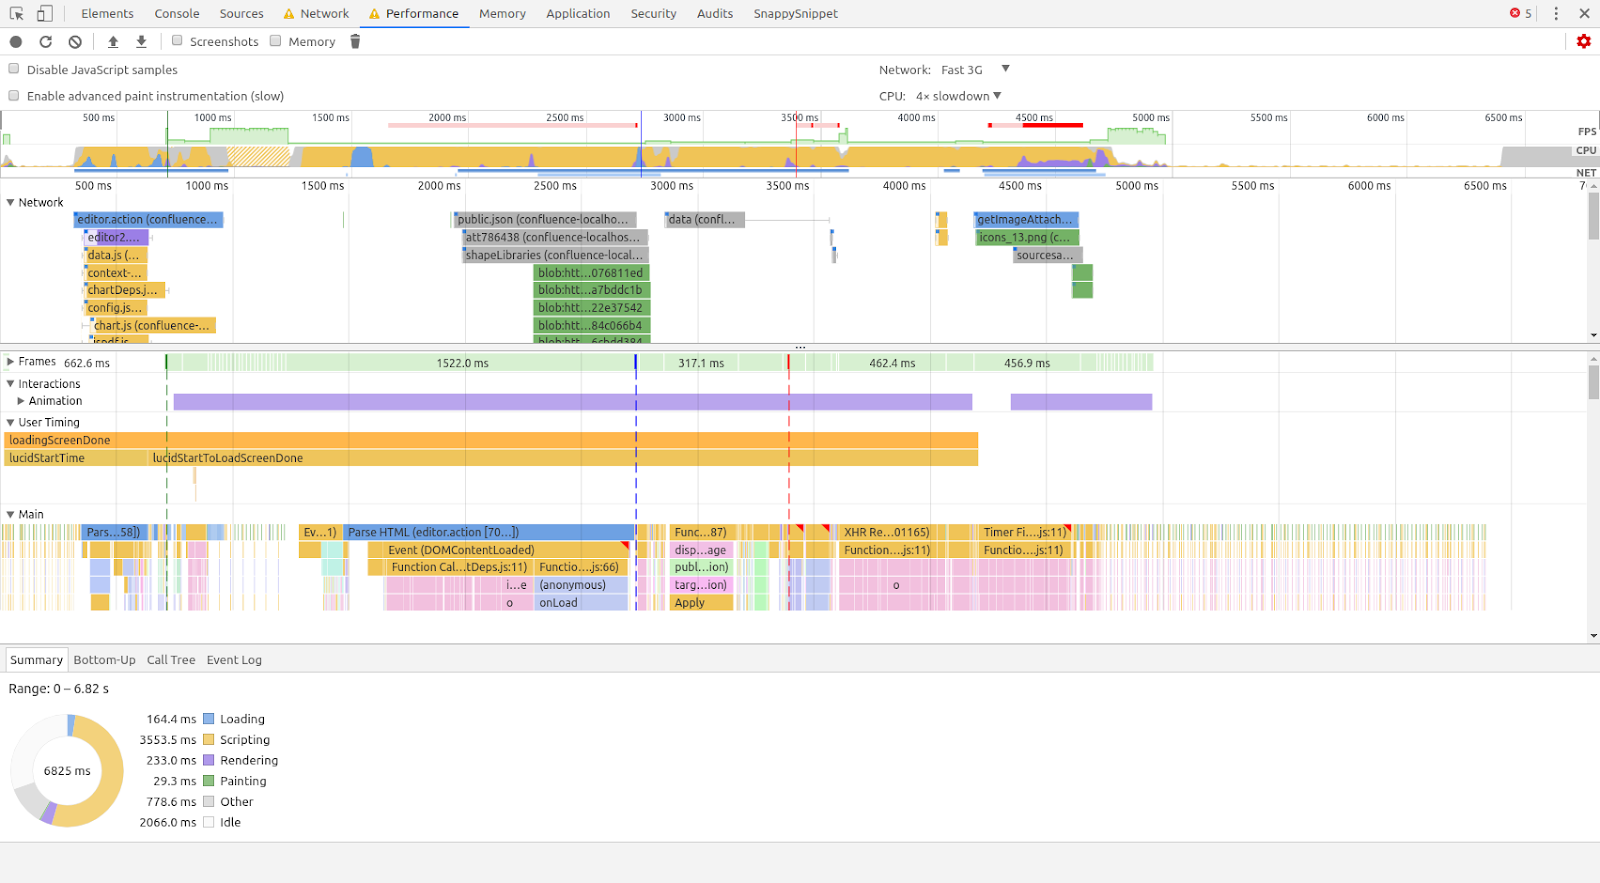
The primary tool that we used to analyze load performance was the Chrome DevTools Performance tab, which details both network and CPU activity on one graph:

The first thing we saw in the performance profile was that we were spending around 6.5 seconds of our total 9-second budget just downloading the application. Almost all of that was Javascript.
At first, we made quick gains against total code weight by removing dependencies we didn’t need at all. For example, we knew that our embedded app didn’t need any of our older Angular 1-based UI, so we were able to remove the entire Angular 1 runtime from the third-party dependency bundle. In total, we cut our third-party dependencies in half, for savings of around 150KB gzipped.
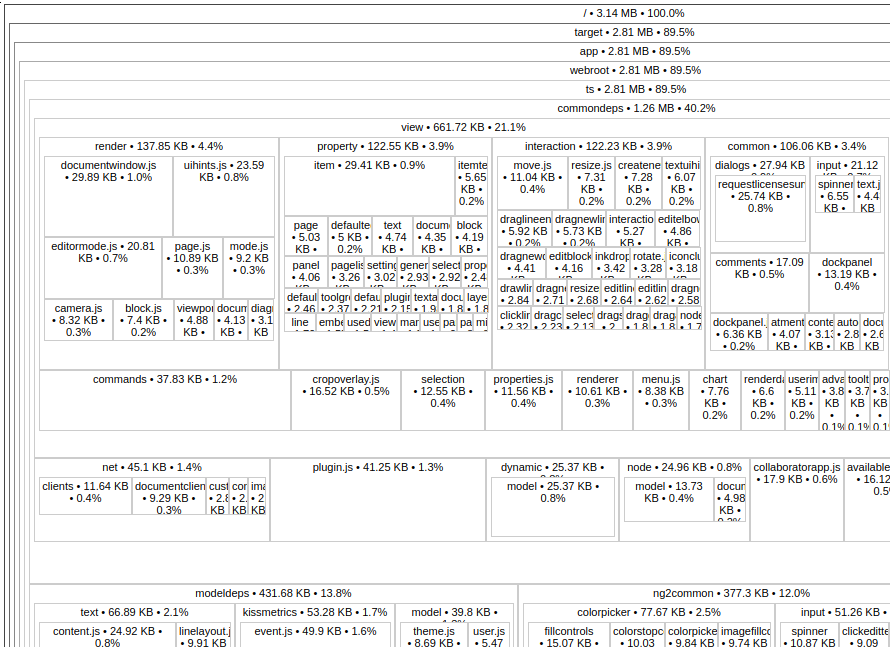
Then we looked at our own core application code. We used the excellent source-map-explorer project to examine our compiled Javascript bundles. This tool gives you a visual overview of how much final code weight (un-gzipped) comes from each of the source files and directories.

Examining where our code weight was coming from, we identified a number of UI elements that we wouldn’t need in our embedded app and restructured our TypeScript modules so that many of them were no longer being required in this particular build target. Just a few kilobytes at a time, we slowly shaved off hundreds of kilobytes of unneeded code.
We also found that quite a lot of our (un-gzipped) code weight was coming from a search index of all of Lucidchart’s shapes. Since we don’t need that index until the user actually begins searching for shapes, we pulled it out into a separate asset that we could download just in time for searching.
Brotli to the rescue
After all of that, our code weight was down substantially, and the download portion of our throttled startup time had fallen from 6.5 seconds to around 5.1 seconds. But in order to meet our goal, we needed to get that down quite a bit further, and we no longer had large amounts of code we could just omit or easily defer.
James Judd suggested we try using brotli instead of gzip to compress our static assets, since nearly all of our supported browsers offer good brotli support.
Brotli is an open-source lossless compression format built by Google that is quite slow to compress but decompresses at a speed comparable to gzip. So while you wouldn’t ever use brotli to serve dynamically generated content, it works really well for Javascript and CSS assets.
In practice, we saw a 15-20% reduction in total asset size by using brotli instead of gzip for our primary assets, bringing our total download time to about 4.5 seconds and leaving us 4.5 seconds to actually parse/compile/execute our scripts, load up the user’s content, and display it to them on-screen.
Keep all the hardware busy
There are two main resources you wait for when your app is loading: the network and the CPU. After our substantial work driving down our total download weight, our load-time profile looked a lot like this:

After our main payloads finished downloading, we spent around 1.1 seconds having our script parsed and evaluated and then another 1.8 seconds constructing our core application classes. Then the CPU went mostly idle for about 1.3 seconds before finally loading and displaying the user’s document.
It turns out that one of the first things our application classes did after being initialized was check which shape libraries were needed to display the current document and download the code for those shapes. About the same time, we started downloading our directory of available fonts as well as the specific fonts used on the document.
While waiting for those assets to download, the CPU just sat idle because our application didn’t yet have enough information to do its job. As an improvement, we pulled forward just enough processing to know which of those assets to download, which allowed the network to keep working while we were initializing the rest of our application on the CPU.

There was still a meaningful gap, though, because now that we were downloading fonts and shape libraries simultaneously, they took longer to download than before. We decided we could bake some font information into the main application and utilize in-browser storage (like IndexedDB) so that we rarely need to download any font information at all.

In all, this cut our idle CPU time from 1.3 seconds to about 0.2 seconds.
Defer all the things
By this time, we were getting close to our overall performance goals. But we still had a little way to go, and there were no more big, obvious targets on the performance profile. So we started looking at the smaller targets.
We examined every network request going out during the initialization of our application and determined that nearly all of them could wait. Loading a tiny YouTube API just in case the user has embedded a YouTube video in their diagram? Let’s wait until we actually verify that there’s a YouTube video. Checking for a list of Slack channels in case they’ve integrated with Slack for sharing diagrams? Let’s wait until they open the share dialog. Loading a hyphenation dictionary? Let’s wait until the user actually turns on hyphenation. Subscribing to the channel of chat messages on the diagram? It can wait until a few seconds after the document is interactive.
We then started looking for bits of CPU work that we could defer. Initializing UI elements like some dialog boxes could wait until they were visible. Instantiating the classes that provide data to UI elements (e.g. “should the bold button be activated”) could be deferred until they were first accessed.
Success
In the end, we were successful in driving down our throttled load times to our 9-second target.

When we turned off all the throttling and ran the application full speed in a production environment, the results of our effort were dramatic. We had handily cleared our 2-second goal. And the best part? Many of those same gains were straightforward to apply to Lucidchart’s full editor experience as well, driving down our average load times at lucidchart.com by well over 10%.
TL;DR
Improving load times on a complex web application often requires improvements in several different areas, and careful measurements along the way can make sure you’re making good investments.
- Improve the precision of your load time measurements by taking them on known hardware, with throttled bandwidth and CPU speed.
- Reducing code weight is critical. Audit your third-party dependencies as well as your own code.
- Brotli compression can give large gains in download weight for static assets like code.
- Perform network requests as early as possible, and as infrequently as possible, to reduce CPU time wasted waiting for the network.
- Defer as much work as possible until after your application is loaded and interactive.
Good luck out there!
About Lucid
Lucid Software is the leader in visual collaboration and work acceleration, helping teams see and build the future by turning ideas into reality. Its products include the Lucid Visual Collaboration Suite (Lucidchart and Lucidspark) and airfocus. The Lucid Visual Collaboration Suite, combined with powerful accelerators for business agility, cloud, and process transformation, empowers organizations to streamline work, foster alignment, and drive business transformation at scale. airfocus, an AI-powered product management and roadmapping platform, extends these capabilities by helping teams prioritize work, define product strategy, and align execution with business goals. The most used work acceleration platform by the Fortune 500, Lucid's solutions are trusted by more than 100 million users across enterprises worldwide, including Google, GE, and NBC Universal. Lucid partners with leaders such as Google, Atlassian, and Microsoft, and has received numerous awards for its products, growth, and workplace culture.