Modeling Data for Generated Diagrams
Alex Williams
Reading time: about 6 min
Soon after I joined Lucid Software, three years ago, we decided to build infrastructure for a new kind of data-driven diagram. One that derived its primary structure from the data itself, that would enable people to think visually about their data.

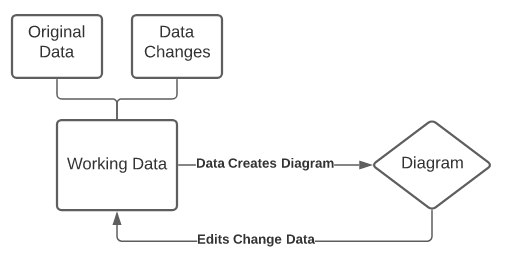
Our goal was to prototype a simple diagram that would automatically layout based on the linked data. Plus, if any changes were made to the diagram, it would immediately update the backing data. Data changes should be able to flow both ways, resulting in an accurate picture of it in the diagram at all times. We also wanted to track the difference between the original data and changes to it and be able to export the data or the changes on demand.
Editing the diagram should be as simple as changing the backing data, which would automatically trigger corresponding updates to the layout and resulting diagram. Users should also be able to style the layout and annotate the diagram flexibly to make thinking visually instinctive. Similarly refreshing the data from its source should also update the diagram appropriately, keeping any still relevant past edits the user made.
We already had a growing Data API handling tabular data and converting various data types to it. Our preexisting systems could import and export data in common formats. Several shapes already allowed importing and embedding data for specific uses such as automatic formatting. Now we needed to build a framework that could make diagramming from data easily generalizable.
Org Charts

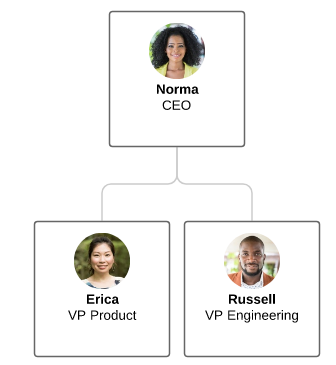
Our first data backed diagrams were Org Charts. They had the advantage of simplicity in a couple of ways. First, the data was not complex and only included one table of employee data. We wanted to focus more on the framework while building this first visualization, so keeping the application simple was important.
Another way Org Charts were simple is that there would only be one foreign-key representing relationships between the employees using the “Supervisor” field.
There are a lot of changes we needed to make to tabular data before it can be used effectively by a layout algorithm. We decided to separate the changes as much as possible into independent transformations to allow each one to focus on a single concern.

One of the first transformations we built was to track data changes separately from the originally imported data. We called it a “branch” since it tracked the difference between these two sets of data. It kept two tables of data, the original source data and the changed data deriving its output table by combining them.
Over time, this became an important building block for all of our new data driven diagrams. We could refresh the original data, for example, from Google Sheets by replacing the source table with the updated data, then reapplying the changes as far as they were still relevant. This allowed us to keep the users changes but still bring in any new data as well. We could even allow the user to export just the changes or the entire branch as the combined data with changes.
Graph Transforms
We knew that tabular data was not a scalable format for diagramming data. Previous implementations of data-driven shape libraries all had very application specific code that could not be easily generalized. Therefore, we needed to derive a more diagram-friendly data structure.
The Graph API was built for this purpose. We built it to represent data in a similar form to how it would be displayed on the diagram. We would create graph nodes for each data item and create edges between them using the foreign key relationships defined on the tabular data. This resulted in a rough first step on graphing the data.
There were many ways we wanted to adjust, add to, or filter the raw graph generated by foreign keys. With it in graph form, simple transformations became much easier to implement and understand. We decided to use a pipeline of graph transforms that could each cache calculations appropriately for the transformation. We designed it so that it would be easy to swap in and out transformations like filters as desired.

Org Charts only required three graphs to transform the data from the branch to a place where we could layout a diagram from it. These were the base foreign key graph, a tree graph that removed non-tree-like edges, and a mapped graph that we used to rename fields to those expected by the layout. This allowed the layout code to only deal with how to layout a tree of graph nodes.
Now when the diagram changed, we could have each graph transform translate the graph changes appropriately to eventually get applied to the branched tabular data. If a supervisor was edited in the diagram, the mapped graph and tree graph transforms would pass the change through and the foreign key graph would update the correct fields on the tabular data. If other data on an employee was edited, the mapped graph would translate the field name before passing the change on. The branch would ensure these changes were applied to the underlying “changes” table correctly. This kept all these interrelated concerns separated in an organized and performant way.
Conclusion
These incremental graph transforms have allowed for much more generic, readable code for getting data from import to diagram. After years of working in this system, we have refined many graphs as they have been used in multiple places. They have become building blocks that can be easily added and removed as needed. We’ve made transforms that group nodes together or add edges and later found ways to reuse them to avoid duplicating work for other visualizations.
Lately, we’ve been working on a new Cloud Insights Add-on for Lucidchart, which generates automatic visualizations of cloud infrastructures, such as AWS. This application contains hundreds of data sets, but by using our Graph API, we've been able to manage it effectively. We currently have around fifteen graph transformations working on these data sets that can be swapped in and out as needed. For example, one of the graphs will summarize shapes of the same type in the same container into a single shape that contains the data from all the summarized shapes. But this is managed at the graph level and so only has to deal with graph nodes, edges, and data. The Graph API has allowed us to iterate quickly as we build new features.
About Lucid
Lucid Software is the leader in visual collaboration and work acceleration, helping teams see and build the future by turning ideas into reality. Its products include the Lucid Visual Collaboration Suite (Lucidchart and Lucidspark) and airfocus. The Lucid Visual Collaboration Suite, combined with powerful accelerators for business agility, cloud, and process transformation, empowers organizations to streamline work, foster alignment, and drive business transformation at scale. airfocus, an AI-powered product management and roadmapping platform, extends these capabilities by helping teams prioritize work, define product strategy, and align execution with business goals. The most used work acceleration platform by the Fortune 500, Lucid's solutions are trusted by more than 100 million users across enterprises worldwide, including Google, GE, and NBC Universal. Lucid partners with leaders such as Google, Atlassian, and Microsoft, and has received numerous awards for its products, growth, and workplace culture.