Data Analytics - the quick explanation
Hawkin Saeger
Reading time: about 9 min
Topics:
Introduction
It has become common to hear companies say “we are data-driven” or “we deliver solutions backed by data.” On a resume, candidates often list that they “perform data analytics” in their role. That all sounds really great and professional, but what do these phrases actually mean? My name is Hawkin Saeger, and I am a Data Analyst at Lucid Software. Whenever I meet someone and they ask about my career, I tell them “I am a Data Analyst.” Almost every single time, their face glosses over, and they smile and nod with a blank stare as they pretend to know what that means.What is data analytics?
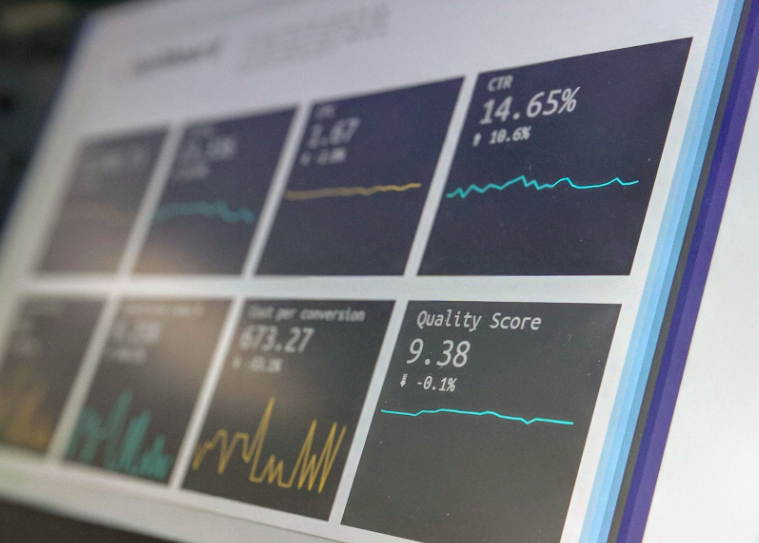
To put it simply, data analytics is the practice of using data to make better decisions. You probably did some form of data analytics today without even realizing it. For example, when you woke up you may have checked the weather, saw it was going to be cold, and decided to wear a coat. You took data (the temperature), and used it to make a better decision (wearing a coat so you wouldn’t be cold). There are many forms of data analytics such as data analysis, data science, data engineering, and analytics engineering. All of these specific forms of data analytics revolve around the central idea of collecting, cleaning, storing, and transforming data, then using it to uncover insights, create reports, and build predictions. Data analytics is not limited to any one industry, either, because data is everywhere! Data dashboard with multiple metrics changing over time.
Why is data analytics important?
So why are companies so focused on data analytics? Well, if members of an organization are making smarter decisions, the organization is more likely to be successful. Analyzing data can uncover key customer insights that help companies improve products, customize services, and change offerings. Ultimately, these decisions help companies achieve their respective goals.What does a data analytics problem look like
 The Data Analytics Pipeline Overview
Business understanding:
First, it is crucial for the data analyst to thoroughly understand the business request. Without doing this in the beginning, the project will have a much lower chance of success. There are a few key pieces to understand about the business area. Asking questions like “How are decisions made?” and “What metrics does the organization care about most?” are good starting points. Once the analyst understands the problem from the perspective of the business area, they can move to identifying the details of the problem. The analyst should get all their clarifying questions answered, and lay out a plan for solving the problem. Here at Lucid Software, we are also adamant in understanding the impact of the request. If someone is just “curious about what the data says”, our team likely is not going to prioritize that request. We make sure we are moving a metric or influencing a decision. This ensures we are a valuable resource to the company overall by utilizing our time in the most effective manner. Let’s say the business area with the analytics problem is seeking to understand user behavior on a specific web page so they can make a better decision. The analyst should clarify why they want to understand the behavior. Is the business trying to drive more users to a certain button on the web page? Do they want the users to remain on the web page longer? Ultimately, the goal is understanding the impact the analysis would fulfill.Data collection:
If the necessary data isn’t already being collected, the data analyst will need to devise a plan to do so. First, determine what quantitative and qualitative data is necessary to answer the business’s questions. This could be done through tracking user events, collecting payment transactions, or surveying users. I won’t dive into the specifics of data pipes and getting data from various sources in this blog, but just know that eventually the data will need to be brought into a centralized location. In many companies this is their data warehouse, but it could also be a folder where an analyst can query from various data sources.Data analysis
After the data has been collected, it will need to be cleaned. This comes before any analysis because it is unlikely that the data will be ready to use right when it comes in. Cleaning is often the most time-consuming part of any analytics problem as well. Problems that analysts frequently encounter include:- Null values - empty cells and missing data
- White space - extra spaces after values
- Formatting strings - naming conventions, capitalization issues, and typos
- Manually-input strings prompt more problems
- Outliers - extreme values that skew results
- Duplicates
- Aggregating data to answer questions
- Building a predictive model
- Creating a dashboard to display metrics
- Building a slide deck supported by data
Visualize and present findings
 A data analyst prepares visualizations to present their findings
Following through on the impact
This last section of an analytics problem is often not discussed, but is an incredibly important step to our analytics team at Lucid Software. We position ourselves as strategic partners and not just analysts who pull data. When we make “driving impact” our ultimate goal, we become more of a partner for the teams we support. Therefore, it is incredibly important to follow through to make sure that impact is being delivered. There are a number of ways this can be applied in practice. One example could be hosting trainings or workshops on analytical tools, metrics, or dashboards so the company can understand how to interact with the solutions. Another example is simply following up after providing a coworker with data. There may be opportunities for an analyst to improve the process in the future. A final example could be doing some extra analysis after a strategic project presentation. Presentations frequently lead to discussion and questions that need to be answered before coming to a decision. In each case though, the focus is the impact and not just getting a task done.Conclusion
Data analytics is a growing and exciting field. As I mentioned earlier, there is data everywhere! The opportunities to drive impact and solve problems are endless, they just need passionate people to take on the challenge. People within our analytics team at Lucid Software come from various backgrounds and professions. I have an undergraduate in Data Analytics, others have degrees in Applied Math, Business, Computer Science, even Physics and Mechanical Engineering! I bring this up to say that anyone can get started within the field of data analytics. If you have a passion for solving complex problems, there are a variety of tools and courses out there to teach you the basics to get started. Good luck and happy analyzing!About Lucid
Lucid Software is the leader in visual collaboration and work acceleration, helping teams see and build the future by turning ideas into reality. Its products include the Lucid Visual Collaboration Suite (Lucidchart and Lucidspark) and airfocus. The Lucid Visual Collaboration Suite, combined with powerful accelerators for business agility, cloud, and process transformation, empowers organizations to streamline work, foster alignment, and drive business transformation at scale. airfocus, an AI-powered product management and roadmapping platform, extends these capabilities by helping teams prioritize work, define product strategy, and align execution with business goals. The most used work acceleration platform by the Fortune 500, Lucid's solutions are trusted by more than 100 million users across enterprises worldwide, including Google, GE, and NBC Universal. Lucid partners with leaders such as Google, Atlassian, and Microsoft, and has received numerous awards for its products, growth, and workplace culture.