Current/future value stream map example
*For Team and Enterprise plans
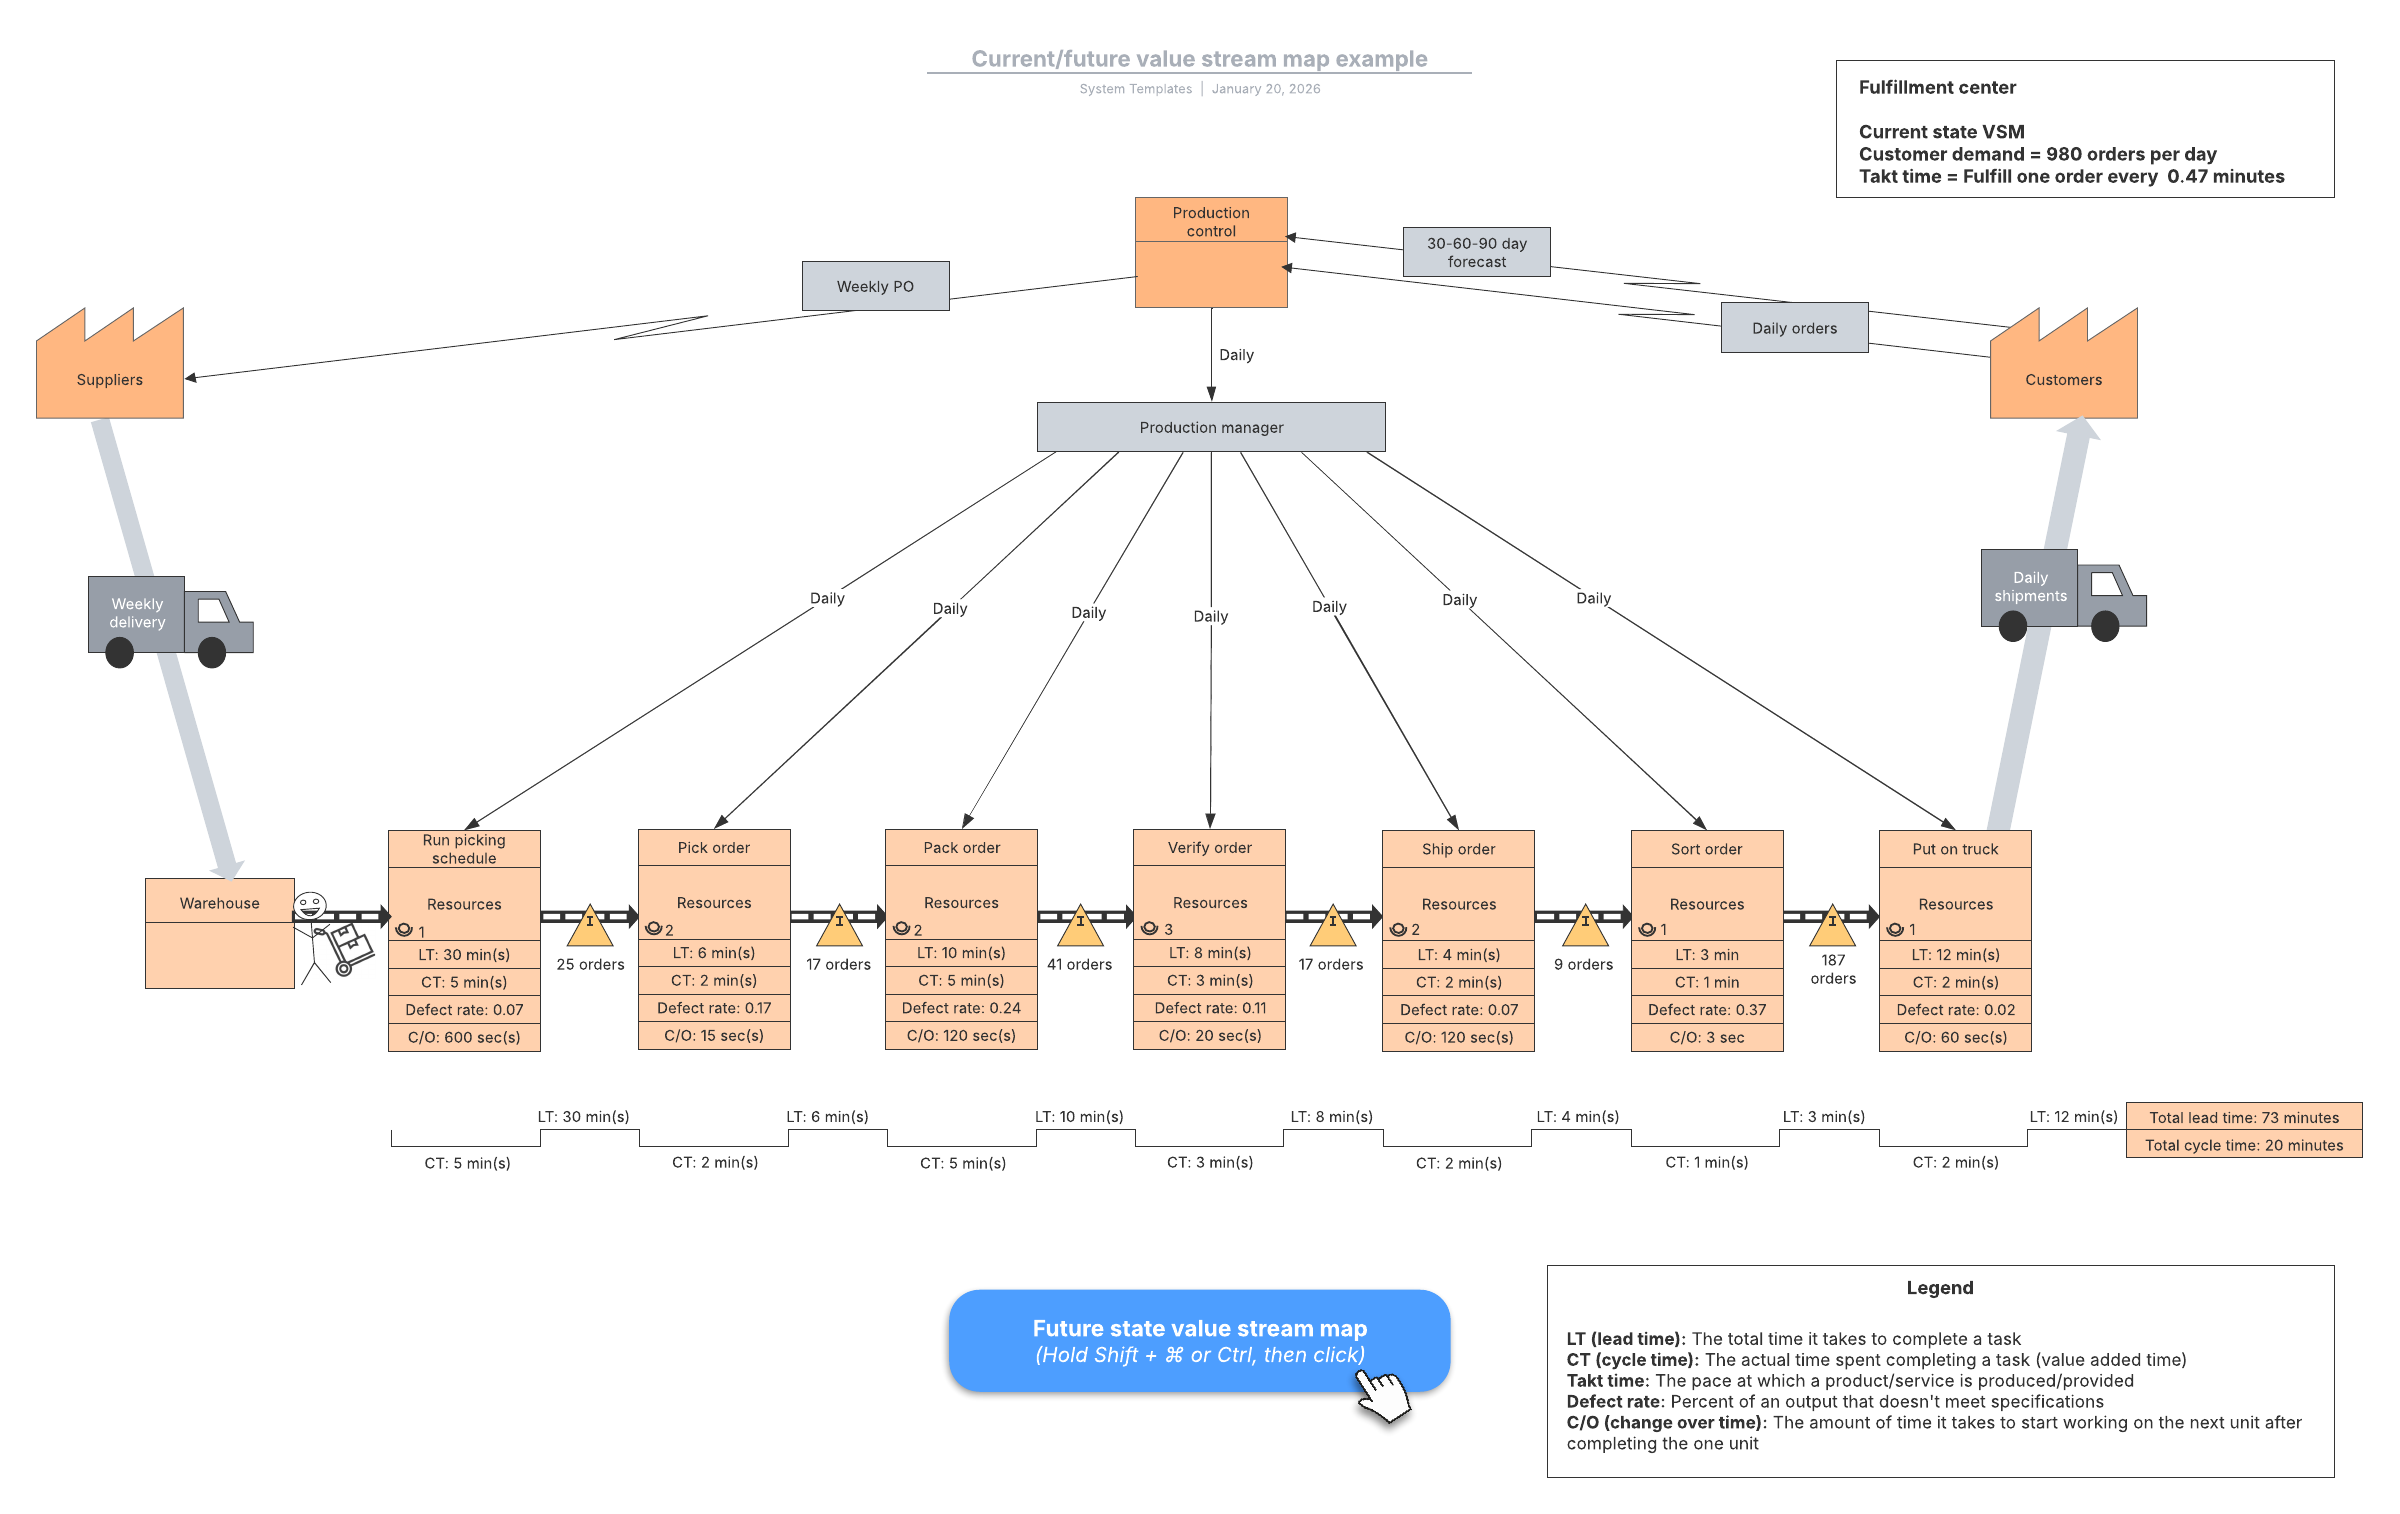
This value stream mapping (push system) template can help you:
- Illustrate and analyze the steps involved in producing a product or delivering a service.
- Focus on reducing time spent on non-value adding activities to increase efficiency.
- Toggle between the current and future state of your push system value stream.
Open this template to view a detailed example of a value stream map (push system) that you can customize to your use case.
What is the current/future value stream map example template?
Value stream mapping is a flowchart method used to illustrate, analyze, and improve the steps required to deliver a product or service. Our value stream map template contains an example of a value stream so that you can study it or customize it to your own use case.
Benefits of using the current/future value stream map example template
Use our value stream map template to illustrate and analyze your entire production process from beginning to end. With a detailed map in hand, you can focus on cutting non-value-adding activities and waste while increasing efficiency and overall value.
Easily toggle between the current and future states of your push system and link your own data set to your map to gain more customized insight into your unique use case. You can also use Lucidchart videos, tutorials, and guides to ensure you get the most out of your visuals.
How to use the current/future value stream map example template in Lucidchart
Here’s a step-by-step guide to updating your value stream map with your own linked data:
- Update the data attached to your shapes by creating a copy of the attached data file or downloading the attached file as a CSV and making any needed changes. Or, start from scratch and create your own file.
- Replace the attached data set with your own by clicking “Data Panel” and then "Manage Data."
- Update the shapes’ text by selecting it, then typing.
- Click the buttons to the right of the document for tutorials on linking data to your diagram, value stream mapping, and more.