ServiceNow
By Servicenow Inc
Integrates with:
Additional information:
ServiceNow
Visualize your ServiceNow APM data to make more informed decisions

Overview
ServiceNow's Application Portfolio Management (APM) tool helps to accelerate decision-making, reduce risk, and lower costs. It displays business, application, and technology portfolios that allow users to make data-driven decisions on whether to invest, sustain, or replace their business applications. It also allows users to manage risk by monitoring the versions and life cycles of their business applications.
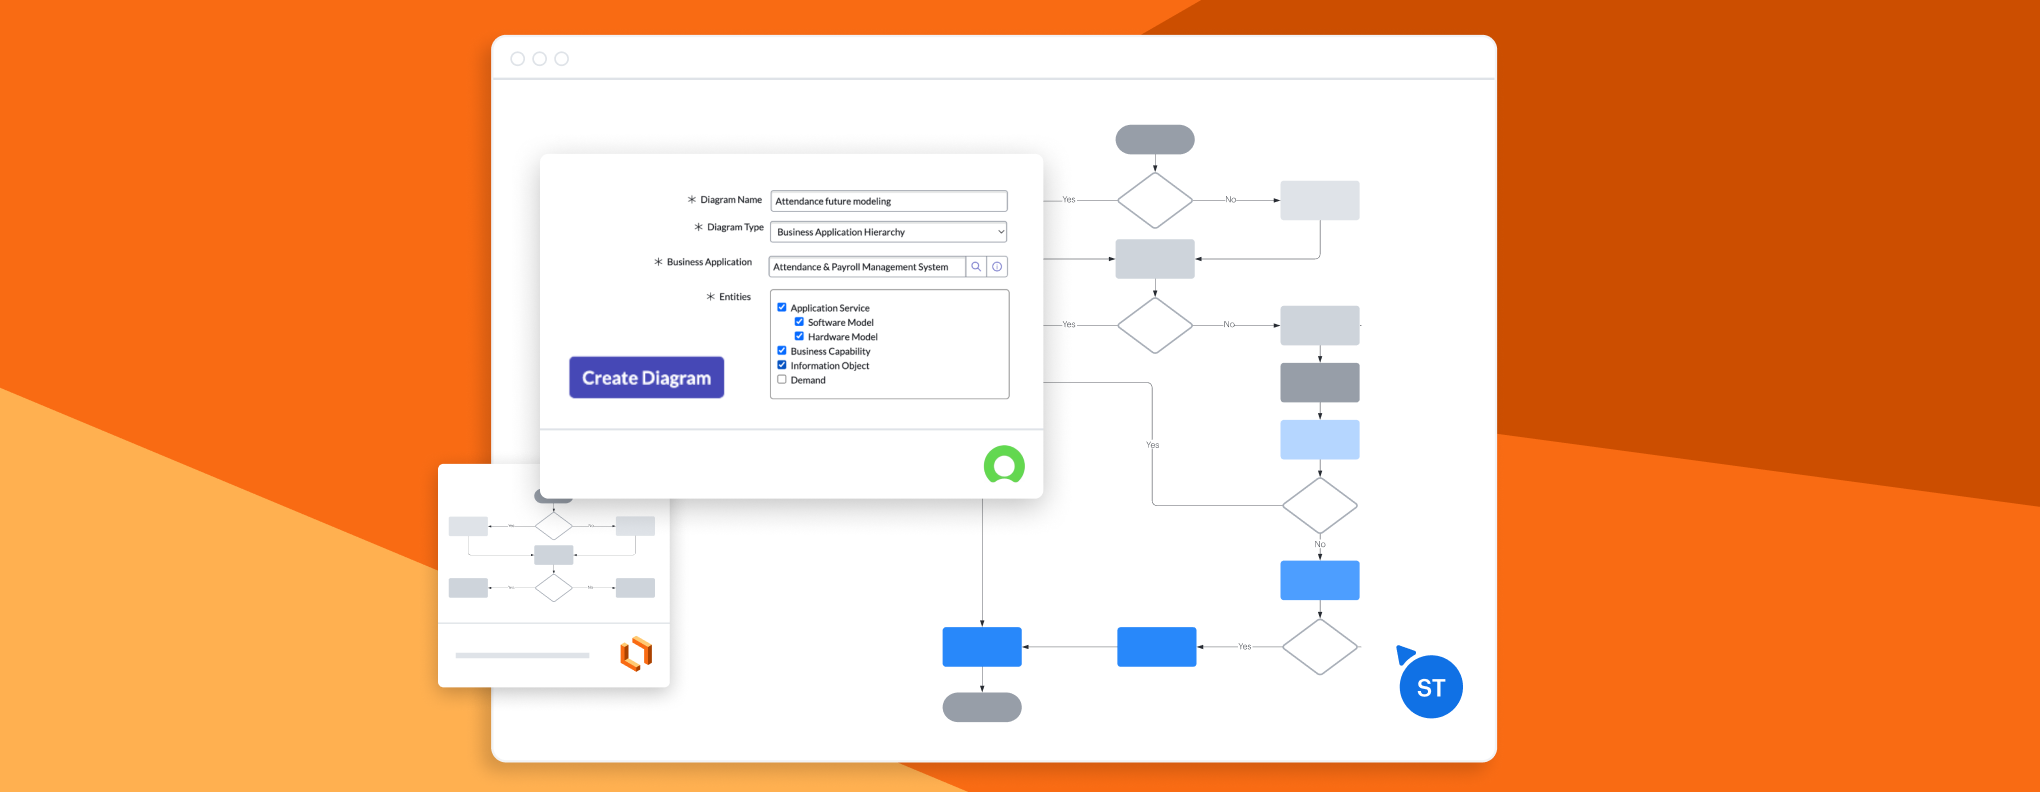
With this integration, you can take the data housed in ServiceNow and use it to generate Lucidchart diagrams that visualize your portfolio. These diagrams give better insight into your application usage, tech stack, and more. You can also edit the diagrams to envision potential future states. Lucidchart, combined with the power of ServiceNow, is the perfect solution for bringing clarity to your portfolio and planning for the future.
Key features
- Automatically generate Lucidchart diagrams from your ServiceNow APM data.
- Easily access diagrams from within ServiceNow.
- Customize and share diagrams with teams and stakeholders.
This integration is a Non-Lucid Application (as defined in the Lucid Software Terms of Service), and is developed and maintained by a third party. Your use of this integration is subject to the contractual relationship between you and the company that developed and maintains the integration, not your relationship with Lucid.


