Dun & Bradstreet
Communication is key to the success of any business—and James, a product director at D&B, uses Lucidchart to easily share his ideas with different audiences and promote transparency.
Key benefits
- VISUALIZE IDEAS
- James creates diagrams to visualize and codify his ideas, making them easy for anyone to understand.
- STAY UP TO DATE
- Since Lucidchart is cloud-based, James can embed a live diagram or provide stakeholders with a link, so everyone always has access to the latest version.
- COMMUNICATE
- Diagrams make it easy to convey complex information to both technical and non-technical audiences quickly, minimizing back and forth.
- DIAGRAM ON THE GO
- Whether he inserts diagrams into a Confluence page or pulls them up on his phone while he's on the go, James always has access to his documentation.
SIZE: Large (2501+ employees)
Dun & Bradstreet offers the data and analytics companies need to make better business decisions. Fortune 500 companies and global businesses of all sizes rely on D&B's data, insight, and analytics.

An office building buzzes with the excitement of engineers, product managers, the sales team, and marketers. They chat with each other, jumping from one meeting to the next, creating a constant flow of information and ideas that turn into action. This process of business-wide communication is the lifeblood of a business.
Yet each of these busy professionals often faces the struggle of how to streamline a single idea across multiple teams, or even the entire company. They may use whiteboards to map out their complex ideas; however, diagrams scribbled on whiteboards simply aren’t enough to achieve the momentum it takes to actually create clarity and move toward implementation. You can’t share a whiteboard with an entire company.
Enter James, a power user of Lucidchart at Dun and Bradstreet (D&B). James is a product director tasked with building online, B2B-oriented advertising products that solve the needs of D&B’s enterprise clients. James has found that a combination of detailed system mapping and "quick and dirty" diagrams are a powerful solution to this struggle of effectively communicating ideas to the sales, marketing, and engineering teams.
Why visualize?
As a product director, James has leveraged the business value of visual productivity. What sparked this sudden realization of the importance of visualization? According to James, visual communication is a rather inherent part of his job as product director. His workflow usually begins when James and his team sketch out different ideas and concepts on a whiteboard. However, during this brainstorming session, James and his colleagues consistently hit a point when writing on a whiteboard simply isn’t enough. Their ideas need to be codified.
Enter a simple solution: Lucidchart.
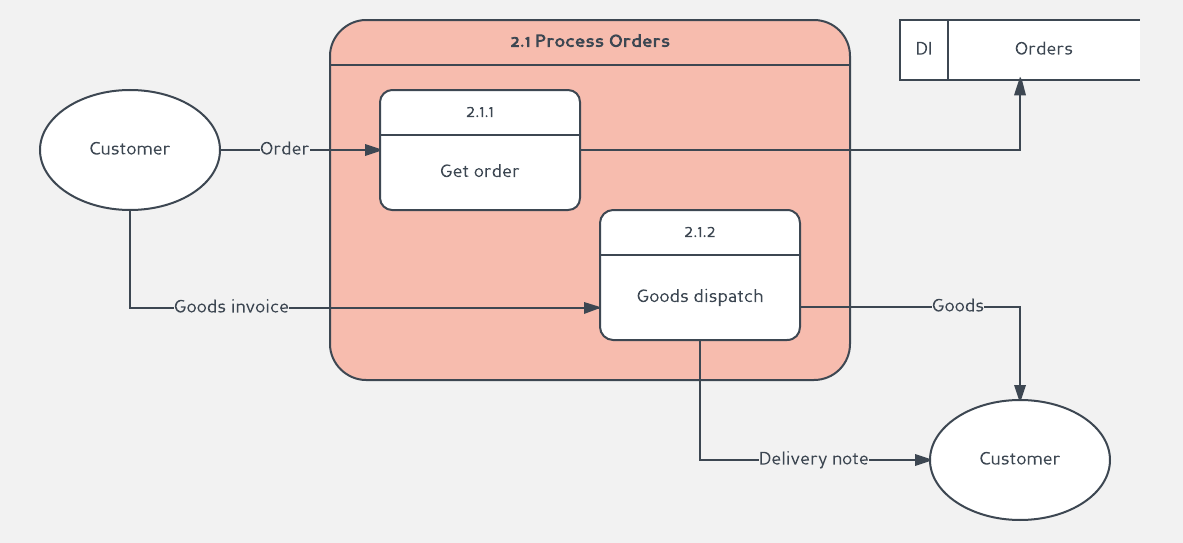
James uses Lucidchart to create a clear visual representation of his ideas that can easily be embedded within documentation and shared across his team. James downloads his diagrams as a PDF or PNG and places them directly within an email or Confluence. Hence, instead of relying on a stagnant whiteboard of visuals that he then would have to convert to text in an email or presentation, his ideas become available to anyone, anywhere they're needed. They're codified, making them easy to understand, and one step closer to actual implementation.

The ROI gained from visual communication is monumental. James stated:
“Lucidchart makes it easier to convey information quickly, preventing a need for back-and-forth to clarify specifics around what we try to convey with documentation. It really helps to reduce the amount of time that has to go towards communicating ideas and plans around complex systems.”
But why Lucidchart?
James’s use of Lucidchart clearly demonstrates the value of visualization, but there are many ways to create a diagram. Why do users like James choose Lucidchart over programs such as Microsoft Visio?
One word: It’s cloud-based.
The omnipresent browser-based access of Lucidchart enables users to have constant access to their diagrams. The mobile app makes Lucidchart even more available for James as he often uses his phone to pull up and reference charts at any given moment. As a product director, James finds Lucidchart especially handy whenever he needs to organize product requirements or explain how data moves through a system to the sales team. According to James, the “fantastic user interface” and “easy-to-use features” of Lucidchart further justify his reasoning to choose this platform.

Enter you (yes, you, the reader). You too can communicate visually and experience significant productivity gains like James. Lucidchart users reported a 43% increase in productivity after adopting Lucidchart. Lucidchart helps to bridge the gap between departments, facilitating a more effective and efficient mode of company-wide communication. James has fully adopted Lucidchart as his universal whiteboard, and you can, too.
Start spreading ideas from your whiteboard to the whole team with Lucidchart.