Supply and demand graph with smart table
*For all Lucid plan types
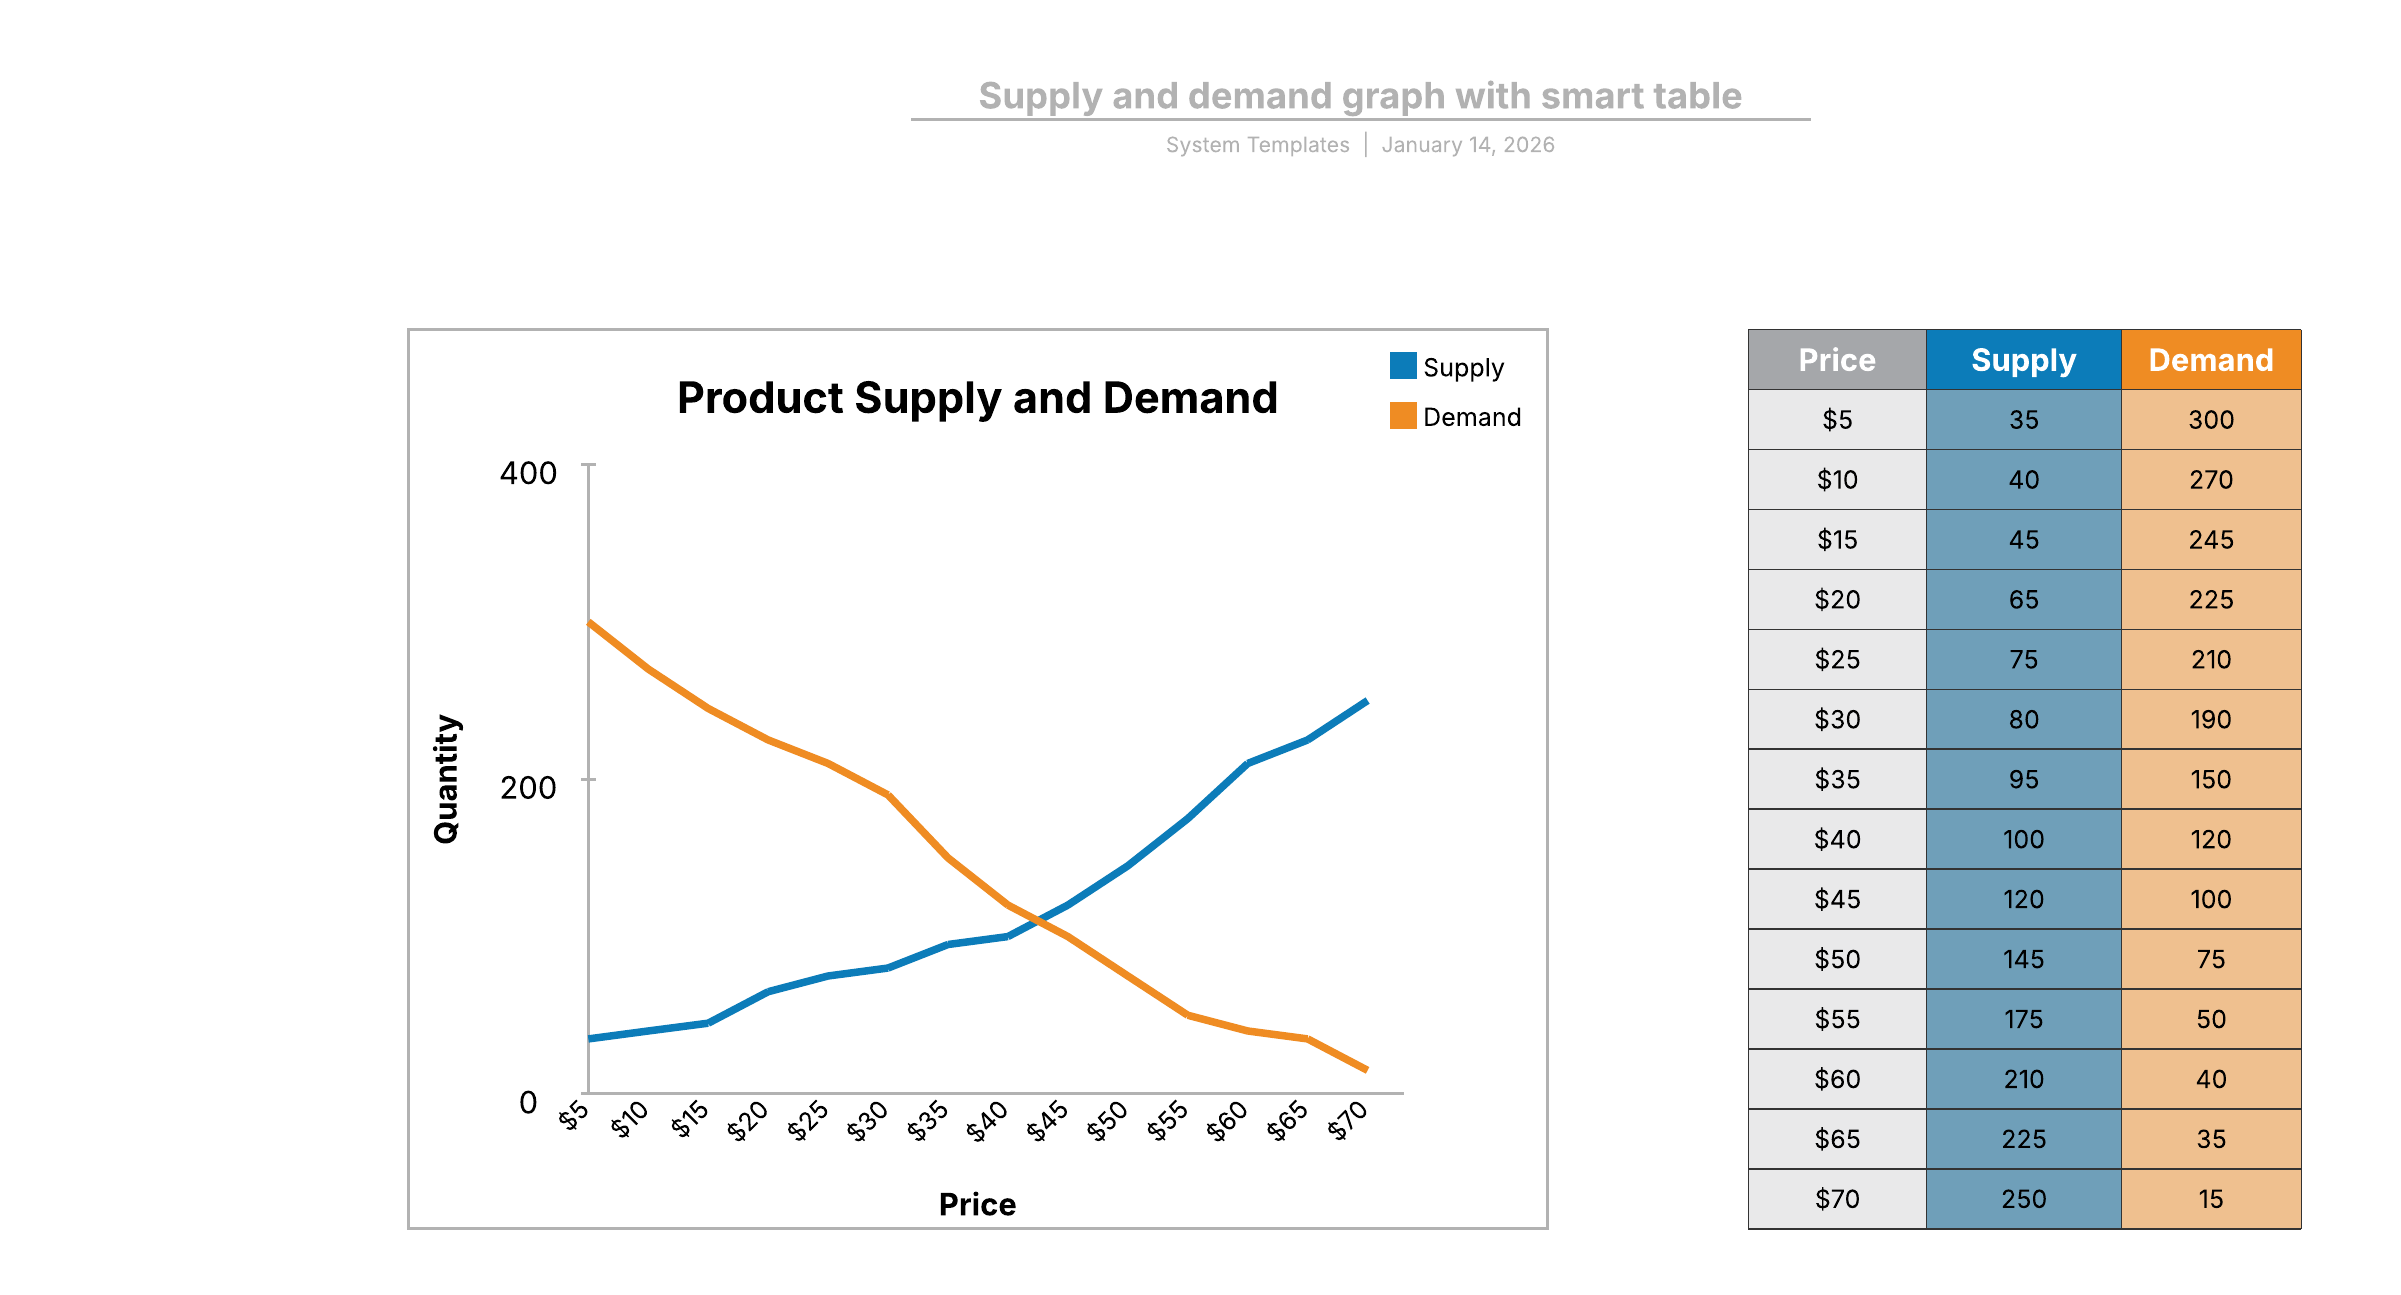
This supply and demand graph with smart table template can help you:
- Show the relationship between supply and demand curves.
- Visualize the difference between excess supply and excess demand.
- Use a smart table with data linked spreadsheet.
Open this template to view a detailed example of a supply and demand graph that you can customize to your use case.
Related templates
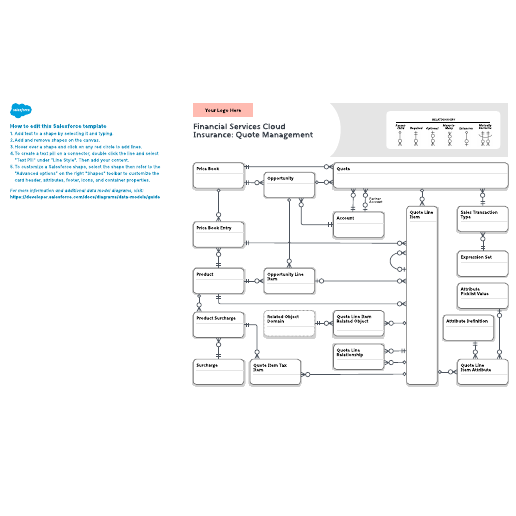
Financial Services - Insurance: Quote Management
Go to Financial Services - Insurance: Quote Management template