Lucid in action: Achieving operational efficiency with Lucid professional services

Reading time: about 11 min

Topics:

  • Digital transformation
  • Expert tips

The economic climate has made the last several years pretty unfriendly (and unforgiving) to inefficient businesses. 

Inefficiency has a sneaky way of finding its way into some of the biggest tenets of business, from meetings to strategy to documentation:

  • The Predictive Index found that strategic misalignment can cost businesses 25% of their revenue each year.
     
  • One study found that large companies are wasting $100 million each year on unproductive meetings.
     
  • Another study found that poor documentation practices can cost a business upwards of 30% of its revenue.

The common thread between each of these issues? The ways in which information is communicated within and throughout your organization matter a lot! It’s no longer enough to simply adopt cutting-edge collaborative tools and hope for the best if you don’t have good processes and plans to manage inefficiency, complexity, and bloat within your company.

And when business decisions are made using information that is poorly shared, inconsistently updated, or has no strategic justification behind it, companies can’t operate efficiently.

How Lucid enables efficiency through visual collaboration

There are many ways Lucid has helped teams across the world work more efficiently by streamlining coordination, eliminating unnecessary meetings, and enabling asynchronous work through the power of visual collaboration. In fact, 88% of users say that Lucid enables them to be more productive.

And when companies need help with uniquely complex solutions to inefficiency problems, they turn to Lucid’s professional services teams to help them create powerful processes, frameworks, and solutions that have been adopted from the organizational level down to individual employees.

Here are three recent examples of customers who have worked with Lucid professional services to launch customized solutions for navigating bottlenecks, optimizing team capacity, and modeling their business systems.

Project visualization: Eliminating bottlenecks to efficient workflows

You can’t tackle what you can’t see.

A manufacturer in the renewable energy space understood this and looked to PERT diagramming (which stands for “program evaluation and review technique”) as a solution to navigate their complex workflow of overlapping mission-critical programs. Their primary goal? Be able to visualize bottlenecks and gain an early understanding of when projects were going off track.

When they found their existing tools inadequate to both document their processes in an easy-to-understand visual format while also allowing anyone to view the current state at any time, they turned to Lucid.

The Lucid professional services team was able to take tables of project task data and convert them into a project visualization hub where the customer could see the critical path for each project, break down workloads by team, and anticipate steps and to-dos months in advance.

“What really worked well here was building this in stages,” said Christopher Bailey, principal professional services consultant at Lucid. “It can be overwhelming to try and visualize your whole web of interconnected processes right off the bat. So we really focused initially on documenting the simple version of each step and mapping the critical path, then layering on more complexity through custom calculations, formulas, and shapes as the customer was ready for it.”

Here’s an example of how this documentation looked for this customer:
 

The program teams for this renewable energy manufacturer were able to use project visualization in Lucid (powered by complex, custom-built formulas and calculations within the Lucid Visual Collaboration Suite) to work more efficiently by allowing them to:

  • Quickly see where bottlenecks existed in the system and how they might affect downstream tasks, so the team could proactively address them.
     
  • Visualize sections of their programs where timelines were extremely constrained or where they had slack, so they could allocate resources accordingly.
     
  • Document on an infinite, constantly updated canvas, so feedback, input, and changes are recorded to the cloud and no one is operating on out-of-date information.

“Without project visualization, teams can waste a lot of time wondering what they should be focused on while they wait for work to get passed off to them,” said Bailey. “This solution allows teams to always have the large context of the project at the top of their mind.”

Expert tips for implementing project visualization

If you’re looking for your own solution to project visualization, here are some additional tips and things to keep in mind:

  • Embrace color! Bailey and his team used shading connected to formulas to provide a quick visual reference of a team that was overcommitted or underfilled for a  particular project, as well as creating a toggle for the critical path that highlights red so stakeholders can get an easy look at potential blockers. Having color represent status, data points, or other indicators makes communication much easier and more visual.
     
  • While Lucid professional services is the ideal source of custom solutions to solve business inefficiencies, you can also start streamlining some of your processes today with off-the-shelf Lucidchart process templates.

Systems modeling: Turning technical complexity into visual clarity

When a major manufacturer of automotive equipment made the switch to a new business management software, they hired a consulting firm to help them visualize over 160 individual subprocesses. This included documenting processes on everything from order fulfillment and inventory management to accounting and human resources—and having data about each step in that process tied back to their documentation.

However, because these new processes were just delivered in a massive PDF, it was difficult for the team to use this information across the business in any meaningful way:

  • Processes were documented in a text-heavy format, making it difficult for individual employees to find sub-processes relevant to their role and see how they connect to larger systems.
     
  • This lack of user-friendliness made it so the team couldn’t effectively use this documentation as a training tool for new employees.
     
  • When the team needed to update their processes with their own best practices over time, or make region-specific changes, there was no good way to update the process and have that update instantly be available and visible to the whole company.
     
  • Most critically, the team was unable to create higher-level views of processes that connected groups of sub-processes together visually, making it impossible to evaluate the health and KPIs of each process (like how fast or slow certain processes were going, or how processes were actually delivering the value to the customer).

“They needed a solution that not only documented their processes but showed how each process connected to the others within the system,” said Bailey.

With the help of Lucid’s professional services team, this automotive company modeled out their entire system of company processes visually in Lucidchart, as well as creating a system for viewing and managing the processes on an ongoing basis. This took the form of several important documents:
 

User journey and process structure

This document essentially provided a key any employee can follow when engaging with any of their process documents in Lucid, and served as a useful tool for Lucid professional services to align on what user experience the client was looking for in how they maintained, reviewed, viewed, and trained on documentation.

This document also mapped the new folder structure within the company’s new business management software in a visual way, so the client Process Management team could easily manage and maintain their new system of documentation.
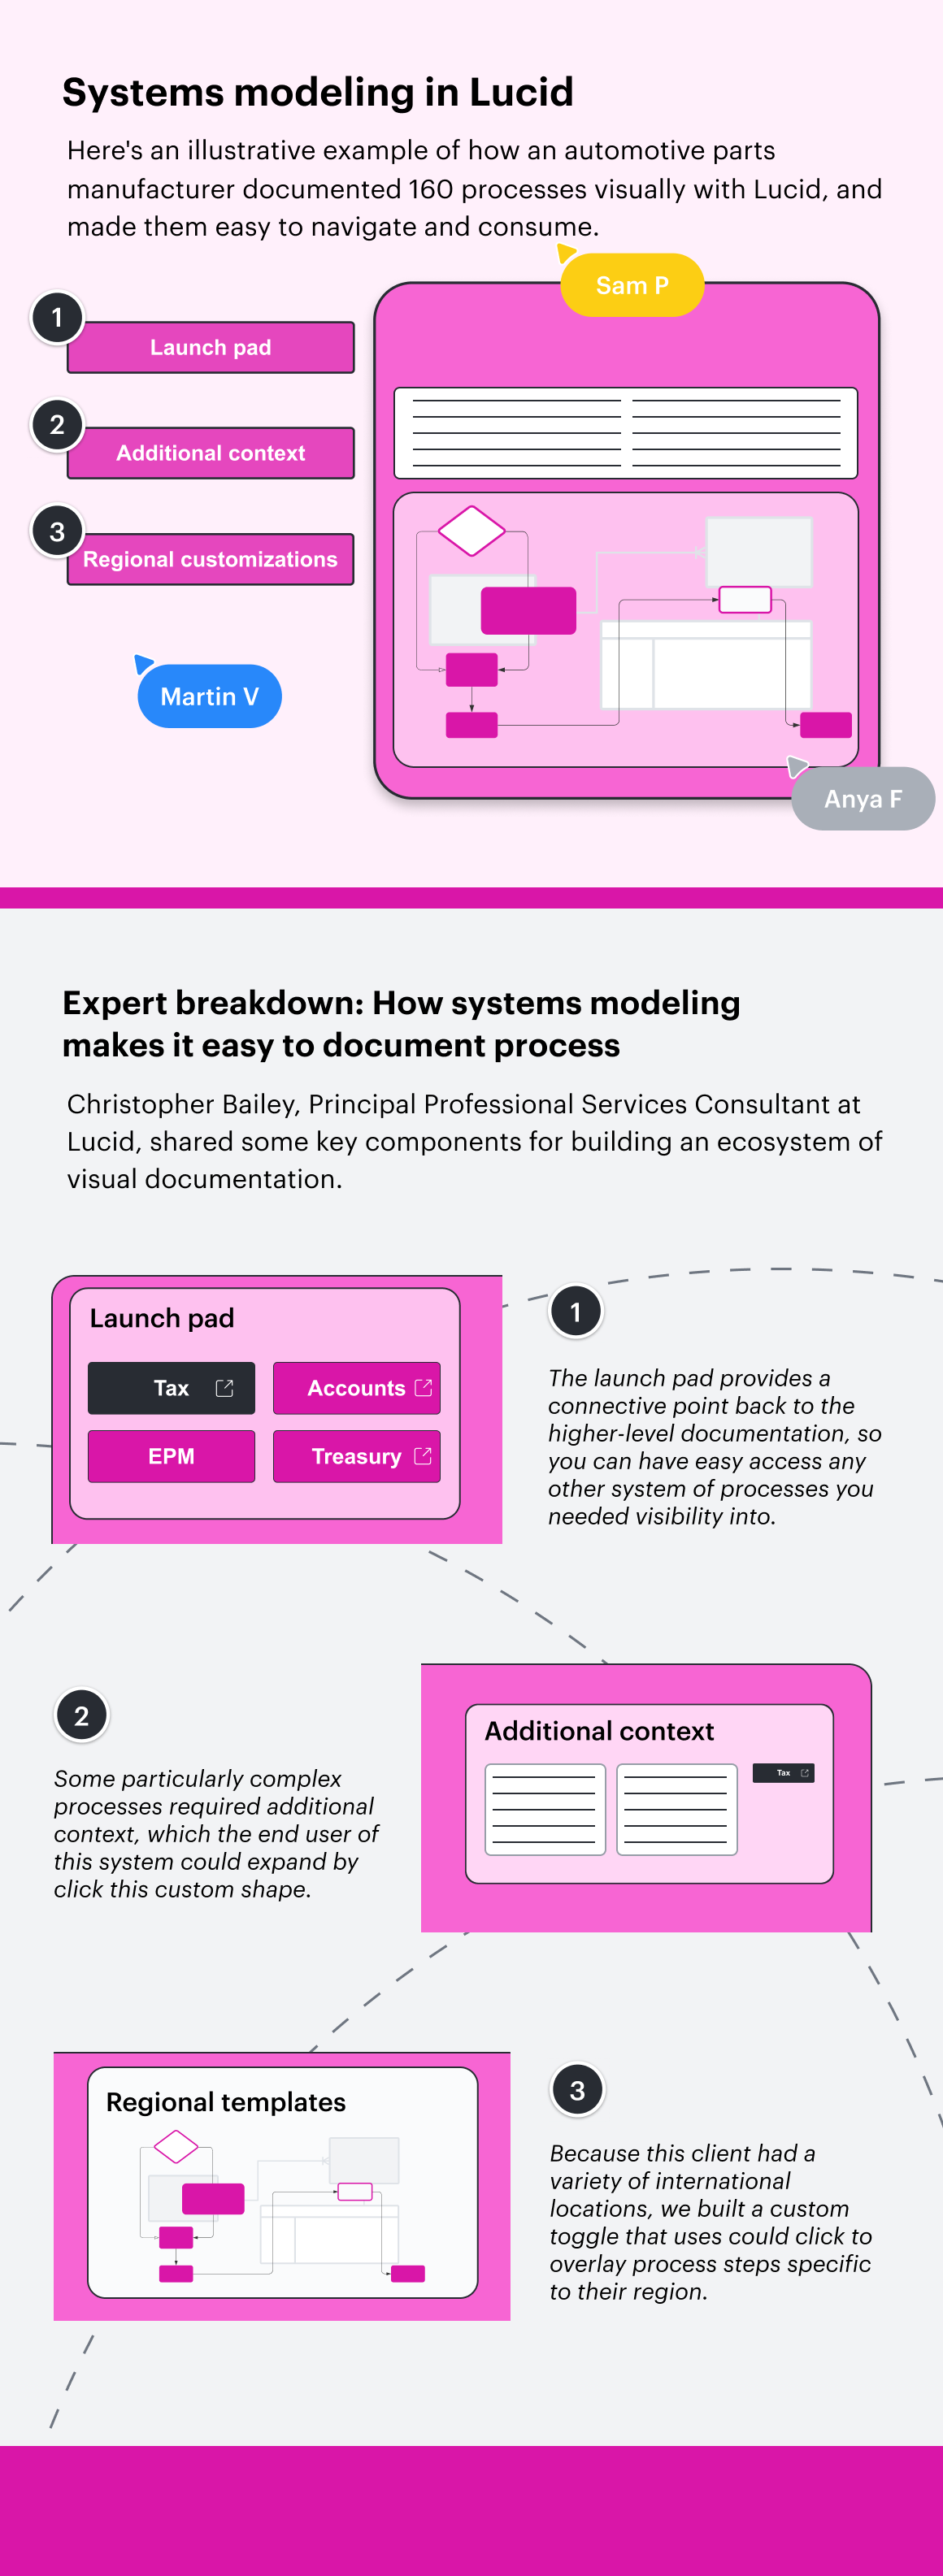
Launchpad

With a dozen categories of different processes—structured into four tiers that each of the 160 individual processes fit into—it could be easy to get lost and overwhelmed in the sheer amount of documentation this business required. Lucid built a launchpad that was simple on the surface and complex under the hood, mirroring the hierarchy of processes within the customer’s business management system and linking out to each individual process template flowchart while showing how it connected to the whole.

Process templates

Finally, with more than 160 individual processes to manage, the customer needed a consistent solution for visualizing these processes. With Lucid professional services, they were able to create individual, interactive flowcharts that were easy to understand at a glance; each process got its own diagram that could be accessed from the launchpad.

Lucid also built custom buttons to offer deeper functionality to certain users, such being able to toggle between custom processes for individual regions or expand a pane with additional context about the process. Each shape on the flowchart is also connected back to data within the company’s business management software, ensuring that each piece of information is intelligently connected back to real data so that it can update in real time.

By mapping their systems and processes in Lucid, this client was able to have a living blueprint of their business available at all times, allowing them to manage and update processes more efficiently. This visual scaffolding was essential to help employees find and digest critical information.

“Process documentation is a lot like buying a new car,” said Bailey. “As soon as you drive it off the lot, it’s starting to decrease in value slowly, especially if you don’t maintain it well. With business processes, too many companies just aren’t managing processes effectively at all. When you start building out an interactive, connected base for all your most important documentation that’s centered around easy-to-understand visuals, it becomes so much easier to protect and nurture that investment you’ve put into process.”

Expert tips for implementing systems modeling

Here are things to keep in mind as you build your own visual ecosystem of documentation:

  • If you can, establish your visual system for managing documentation at the same time that you’re building your individual pieces of documentation. If you are simply documenting processes in siloes—and don’t have a system in place for how they will all connect to each other and how you will get visibility as you move up the hierarchy—you will be setting yourself up for a lot of migration work later.
     
  • Using Lucid to capture metadata about each step in your processes will also help you later get visibility into the details of each process, so you can do both detailed analysis and glean high-level insights as you move about your hierarchy.

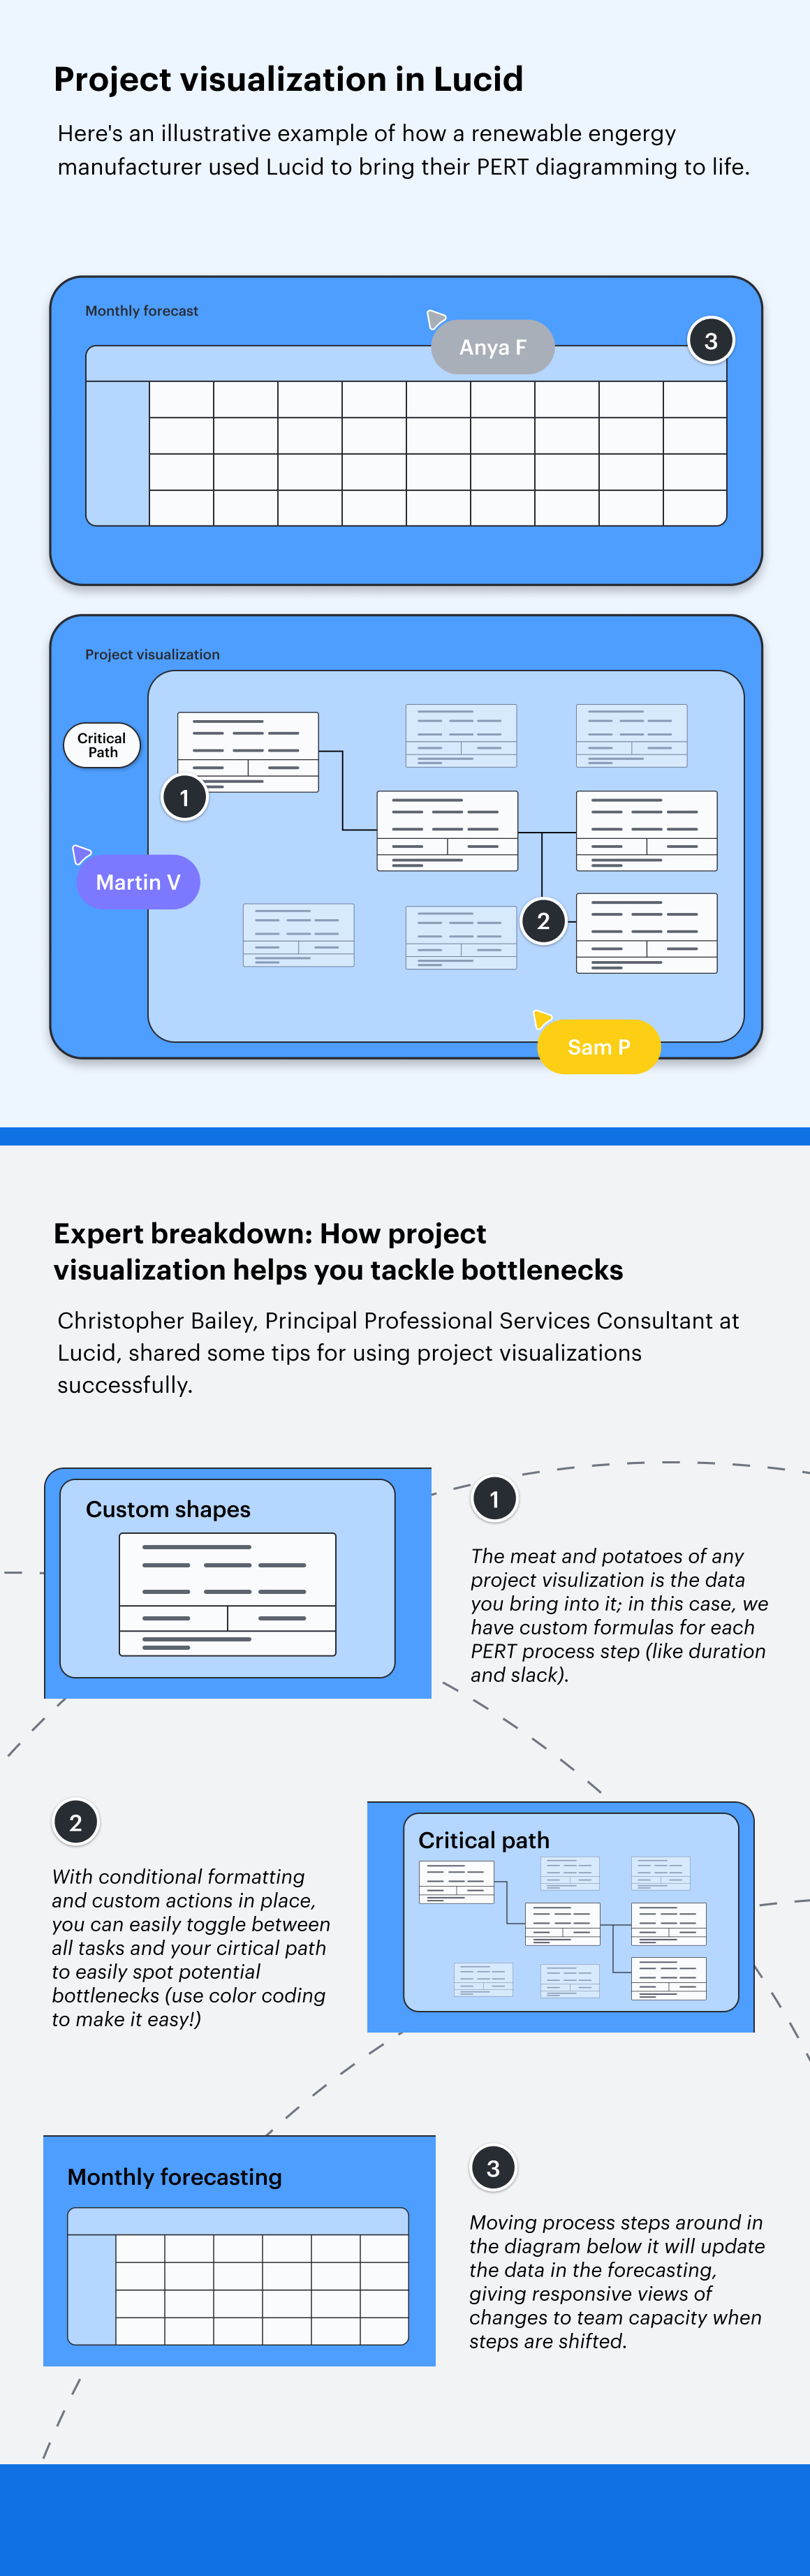
Capacity planning: Making room for teams to innovate

When the program manager at a leading financial services company kept getting inbound requests of the project team’s time, she had a major problem to navigate: Her team was already well over capacity and simply couldn’t take on additional work without more headcount.

“We aren’t talking about small project requests, either,” said Bailey. “These were major initiatives her team needed to manage, like digital transformation.”

But because her stakeholders had no visibility into the capacity of her team, it was difficult to say “no” or “later,” and the newest requests always ended up taking higher priority since requesters couldn’t easily see what was already scoped for or in progress. That is, until she worked with Lucid professional services to build a visual capacity planner for her team.

You can view an example of what Lucid built for this customer below:

By showing not only existing projects currently in the works, but also anticipated work that’s already been scoped quarters ahead of time, this project manager was able to use the capacity planner in Lucid to provide visual proof of the need for more developers, providing transparency for executives and thus gaining their support to increase hiring.

This visual proof enabled her to have dynamic conversations about tradeoffs. Being able to move intelligent shapes and cards across columns and see the impacts of those decisions in real time helped the team work more efficiently in a way they couldn’t have done with just PowerPoint slides and rows of data on a spreadsheet.

Capacity planning also allowed her team to work more efficiently by making sure her team wasn’t consistently at or over 100% capacity each week, which was hindering their ability to innovate nimbly. 

Expert tips for implementing capacity planning

Here are some other things to keep in mind as you try visual capacity planning at your own company:

  • If you’re trying to launch a new product quickly, make sure you are leaving room to innovate and move MVPs along quickly. “One benefit of capacity planning is being able to leave some slack in your teams’ workloads, but too often teams just continue to fill their time up completely, which somewhat defeats the purpose of capacity planning if you aren’t leaving room for the team to be agile and adaptive to needs,” said Bailey. “Don’t just use your capacity planner to see how busy your team is. Use it to make strategic decisions about where you are deploying people and resources, and where you are leaving room for exploration.”
     
  • Capacity planning is great for showing current resource commitments—but it’s also a great method for creating ongoing, future-looking discussions around where you spend your capacity as an organization. This leads to stronger product funding and redirection of funds when needed to reprioritize effort.

Increase efficiency with visual collaboration

Don’t get lost in a maze of siloed information, dusty documentation, and confusing processes. With Lucid, you can bring the clarity of visual collaboration to your workflow.

two individuals high-fiving

Want custom solutions like the ones above?

Contact Lucid professional services

About Lucid

Lucid Software is a pioneer and leader in visual collaboration dedicated to helping teams build the future. With its products—Lucidchart, Lucidspark, and Lucidscale—teams are supported from ideation to execution and are empowered to align around a shared vision, clarify complexity, and collaborate visually, no matter where they are. Lucid is proud to serve top businesses around the world, including customers such as Google, GE, and NBC Universal, and 99% of the Fortune 500. Lucid partners with industry leaders, including Google, Atlassian, and Microsoft. Since its founding, Lucid has received numerous awards for its products, business, and workplace culture. For more information, visit lucid.co.

Related articles

Bring your bright ideas to life.

Sign up free

or continue with

Sign in with GoogleSign inSign in with MicrosoftSign inSign in with SlackSign in

Get Started

  • Contact Sales

Products

  • Lucidspark
  • Lucidchart
  • Lucidscale
PrivacyLegalCookie settingsCookie policy
  • linkedin
  • twitter
  • instagram
  • facebook
  • youtube
  • glassdoor
  • tiktok

© 2024 Lucid Software Inc.