
Process engineers evaluate and develop process improvement methods to increase productivity and scale their businesses. To fulfill this role, you need a process for evaluating and improving processes—talk about meta.
Intro to business process improvement methodologies
If your goal is to continually refine operations to boost efficiency (and positively affect the bottom line), your best bet is to start by analyzing your processes and identifying practices that seem unnecessary or redundant. But while that step is key, it’s definitely not the most difficult part. It’s often much harder to actually implement a process change.
This challenge is often answered with process improvement methodologies. There are many, and they all include slightly different steps and philosophies on how to bring about effective change. Different teams and organizations will favor different methodologies, so to identify the best method for you, it’s important to have a basic understanding of as many as possible.
You don’t have to reinvent the wheel to find a methodology that works for process improvement, but you might not be sure which methodology to use when professionals throw around terms like DMAIC and TQM. In this article, we’re breaking down the top business process improvement methodologies and sharing resources to help you implement them in your org.
Six Sigma
Six Sigma began at Motorola, became a core part of the strategy at General Electric, and has since been used widely for manufacturing and business processes. This method helps companies measure defects or inconsistencies in a process to deliver perfect products and services.
Within Six Sigma, process engineers use two sub-methodologies, DMAIC for improving existing processes, and DMADV for creating new processes. The more widely used of the two, DMAIC follows these steps:
-
Define the opportunity for improvement (project goal).
-
Measure the performance of your existing process.
-
Analyze the process to find any defects and their root causes.
-
Improve the process by addressing the root causes you found.
-
Control the improved process and future process performance to correct any deviations before they result in defects.

Dive deeper into the DMAIC process and learn why it helps companies manufacture products nearly 100% defect-free
Get startedDMADV follows similar steps, though users will look at different factors since a process does not exist yet:
-
Define the process goal, keeping in line with the overall company strategy and customer needs.
-
Measure the factors that are critical to quality (called CTQs).
-
Analyze various design and development options.
-
Design the process.
-
Verify that the design meets process goals and customer needs. Pilot the process and, if successful, implement the process.
Six Sigma relies on data and statistics to make decisions more than other methodologies. By using DMAIC and DMADV, Six Sigma organizations should see clear financial returns and strive for less than 3.4 defective features in every million opportunities, or chances for a defect.

Process improvement methodologies aren’t one-size-fits-all. Review some limitations of Six Sigma to see if it’s right for you
Go nowDiagrams for Six Sigma
While Six Sigma offers strong standards on its own, it borrows from other process improvement methods to help professionals complete the DMAIC process. As you define and analyze your current process, you might use these diagrams.
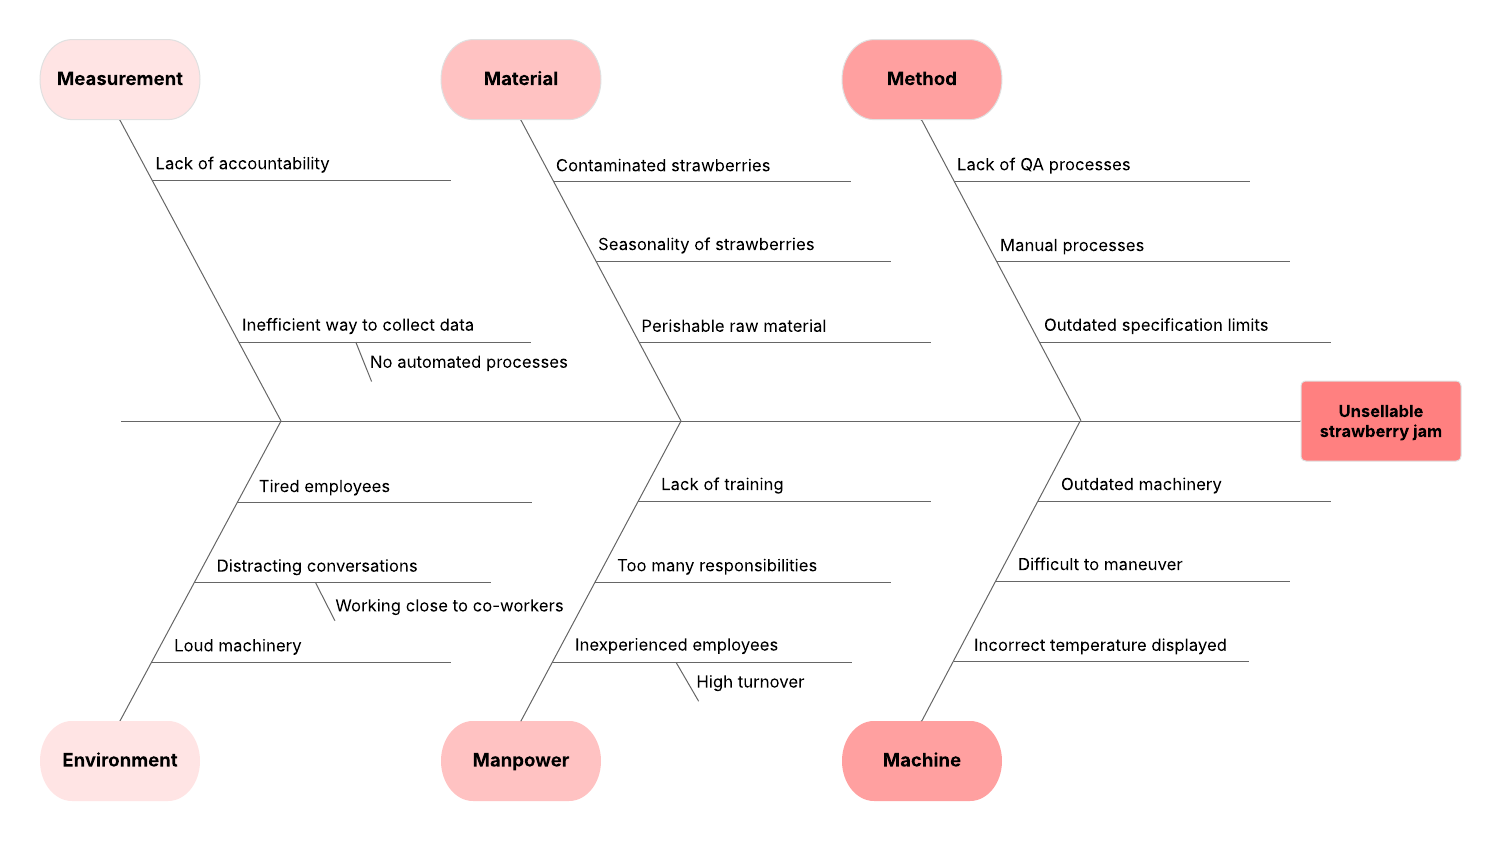
Ishikawa diagram/fishbone diagram: Also known as cause-and-effect diagrams, these visuals can help you brainstorm potential causes of a defect. Resembling a fishbone, the head of the diagram states the problem, and the lines branch out into different categories of causes.
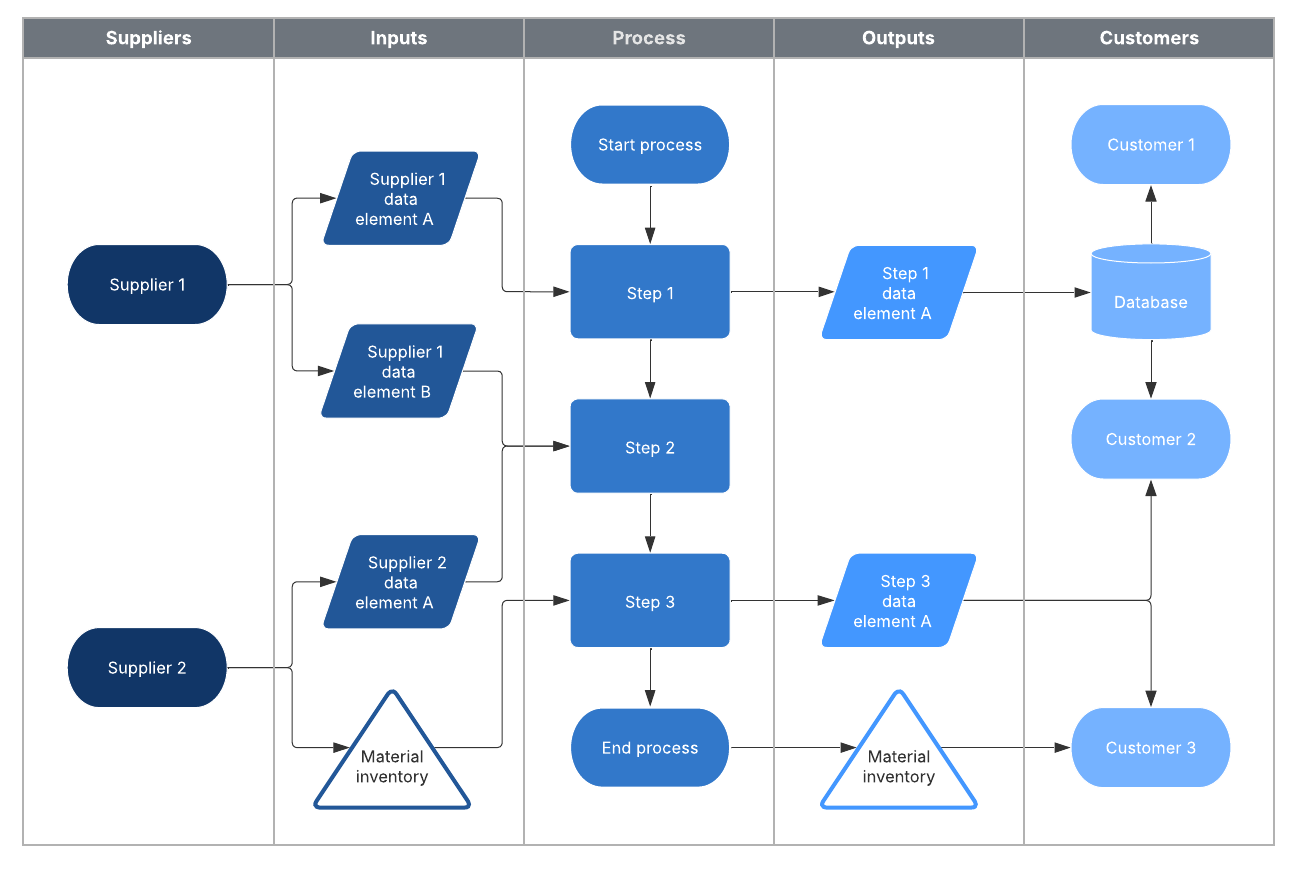
SIPOC analysis diagram: Use to define your process by supplier, input, process, output, and customer.
Business process mapping: Visualize your entire business process, taking into consideration account roles, responsibilities, and goals. Use business process maps to analyze your organization's activities to improve productivity.
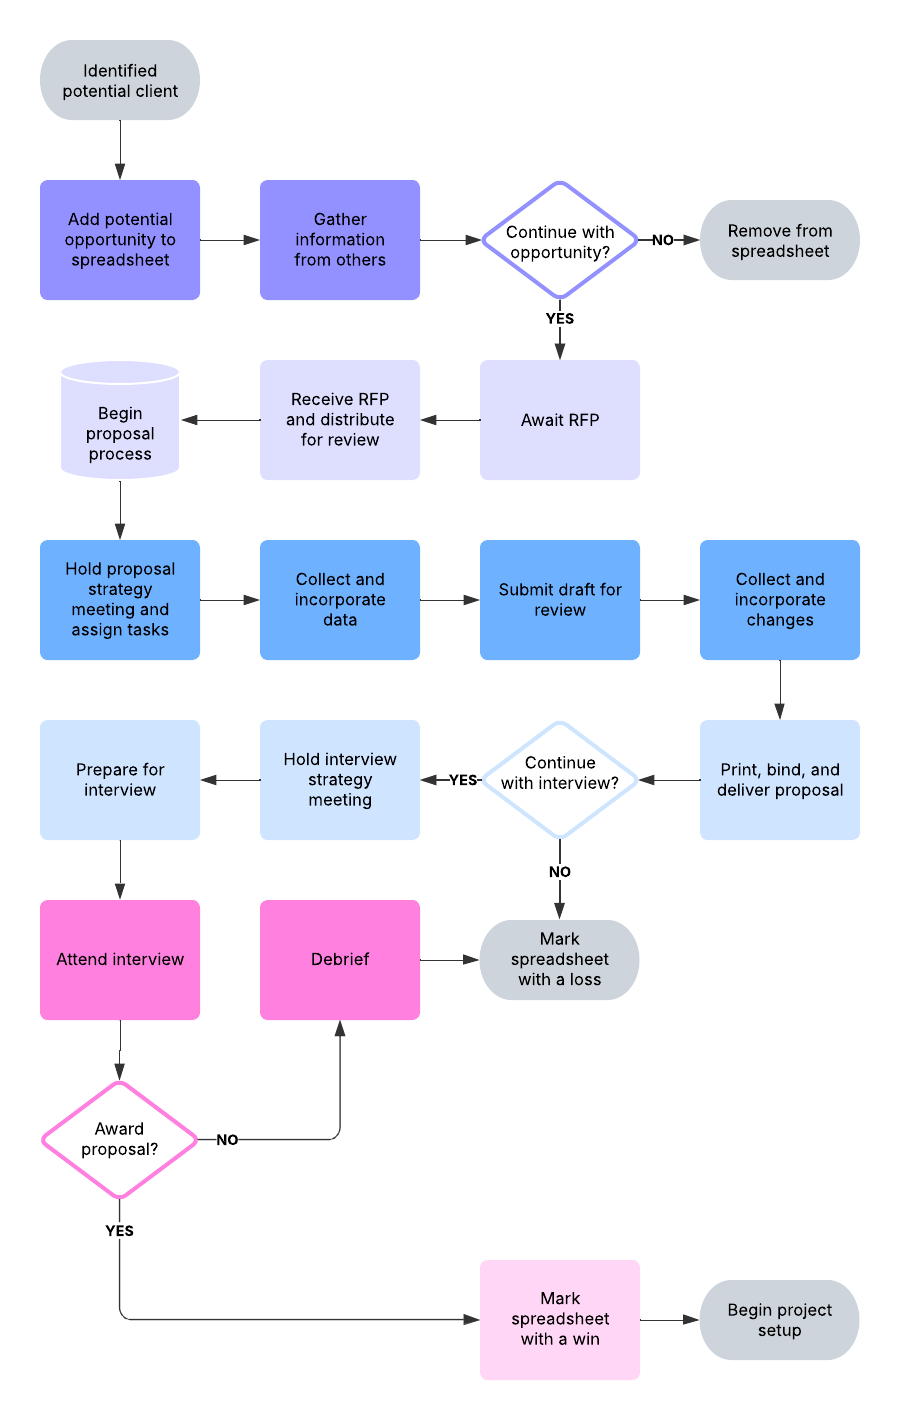
Find out how to get started using business process mapping with Six Sigma.
Learn moreLean manufacturing
As the name would suggest, the Lean process improvement methodology strives to cut costs by eliminating waste. Although it is often referred to as Lean manufacturing, Lean’s core ideas can apply to every organization and process.
Someone using this business process improvement methodology would evaluate a process’s value stream. The value stream consists of value-added activities (the actions a customer would pay for) or non-value-added activities in the process that either bring a concept to fruition or completes an order.
Any action that doesn’t add value or isn’t required as part of a policy or regulation is waste. Waste can include:
-
Transportation: The movement of products unnecessary for the process
-
Inventory: Materials that aren’t required to process current orders
-
Motion: People or equipment that move more than necessary to complete the process
-
Waiting: Periods of inactivity or interruptions in production
-
Overproduction: Excessive production of materials ahead of demand
-
Overprocessing: Extra work due to redundancies or poor tool/product design
-
Defects: The effort involved in checking for and fixing defects in the system
-
Skills: The act of underutilizing the knowledge and skills employees have
Process engineers identify these areas of waste to increase overall value to customers.
Diagrams for Lean manufacturing
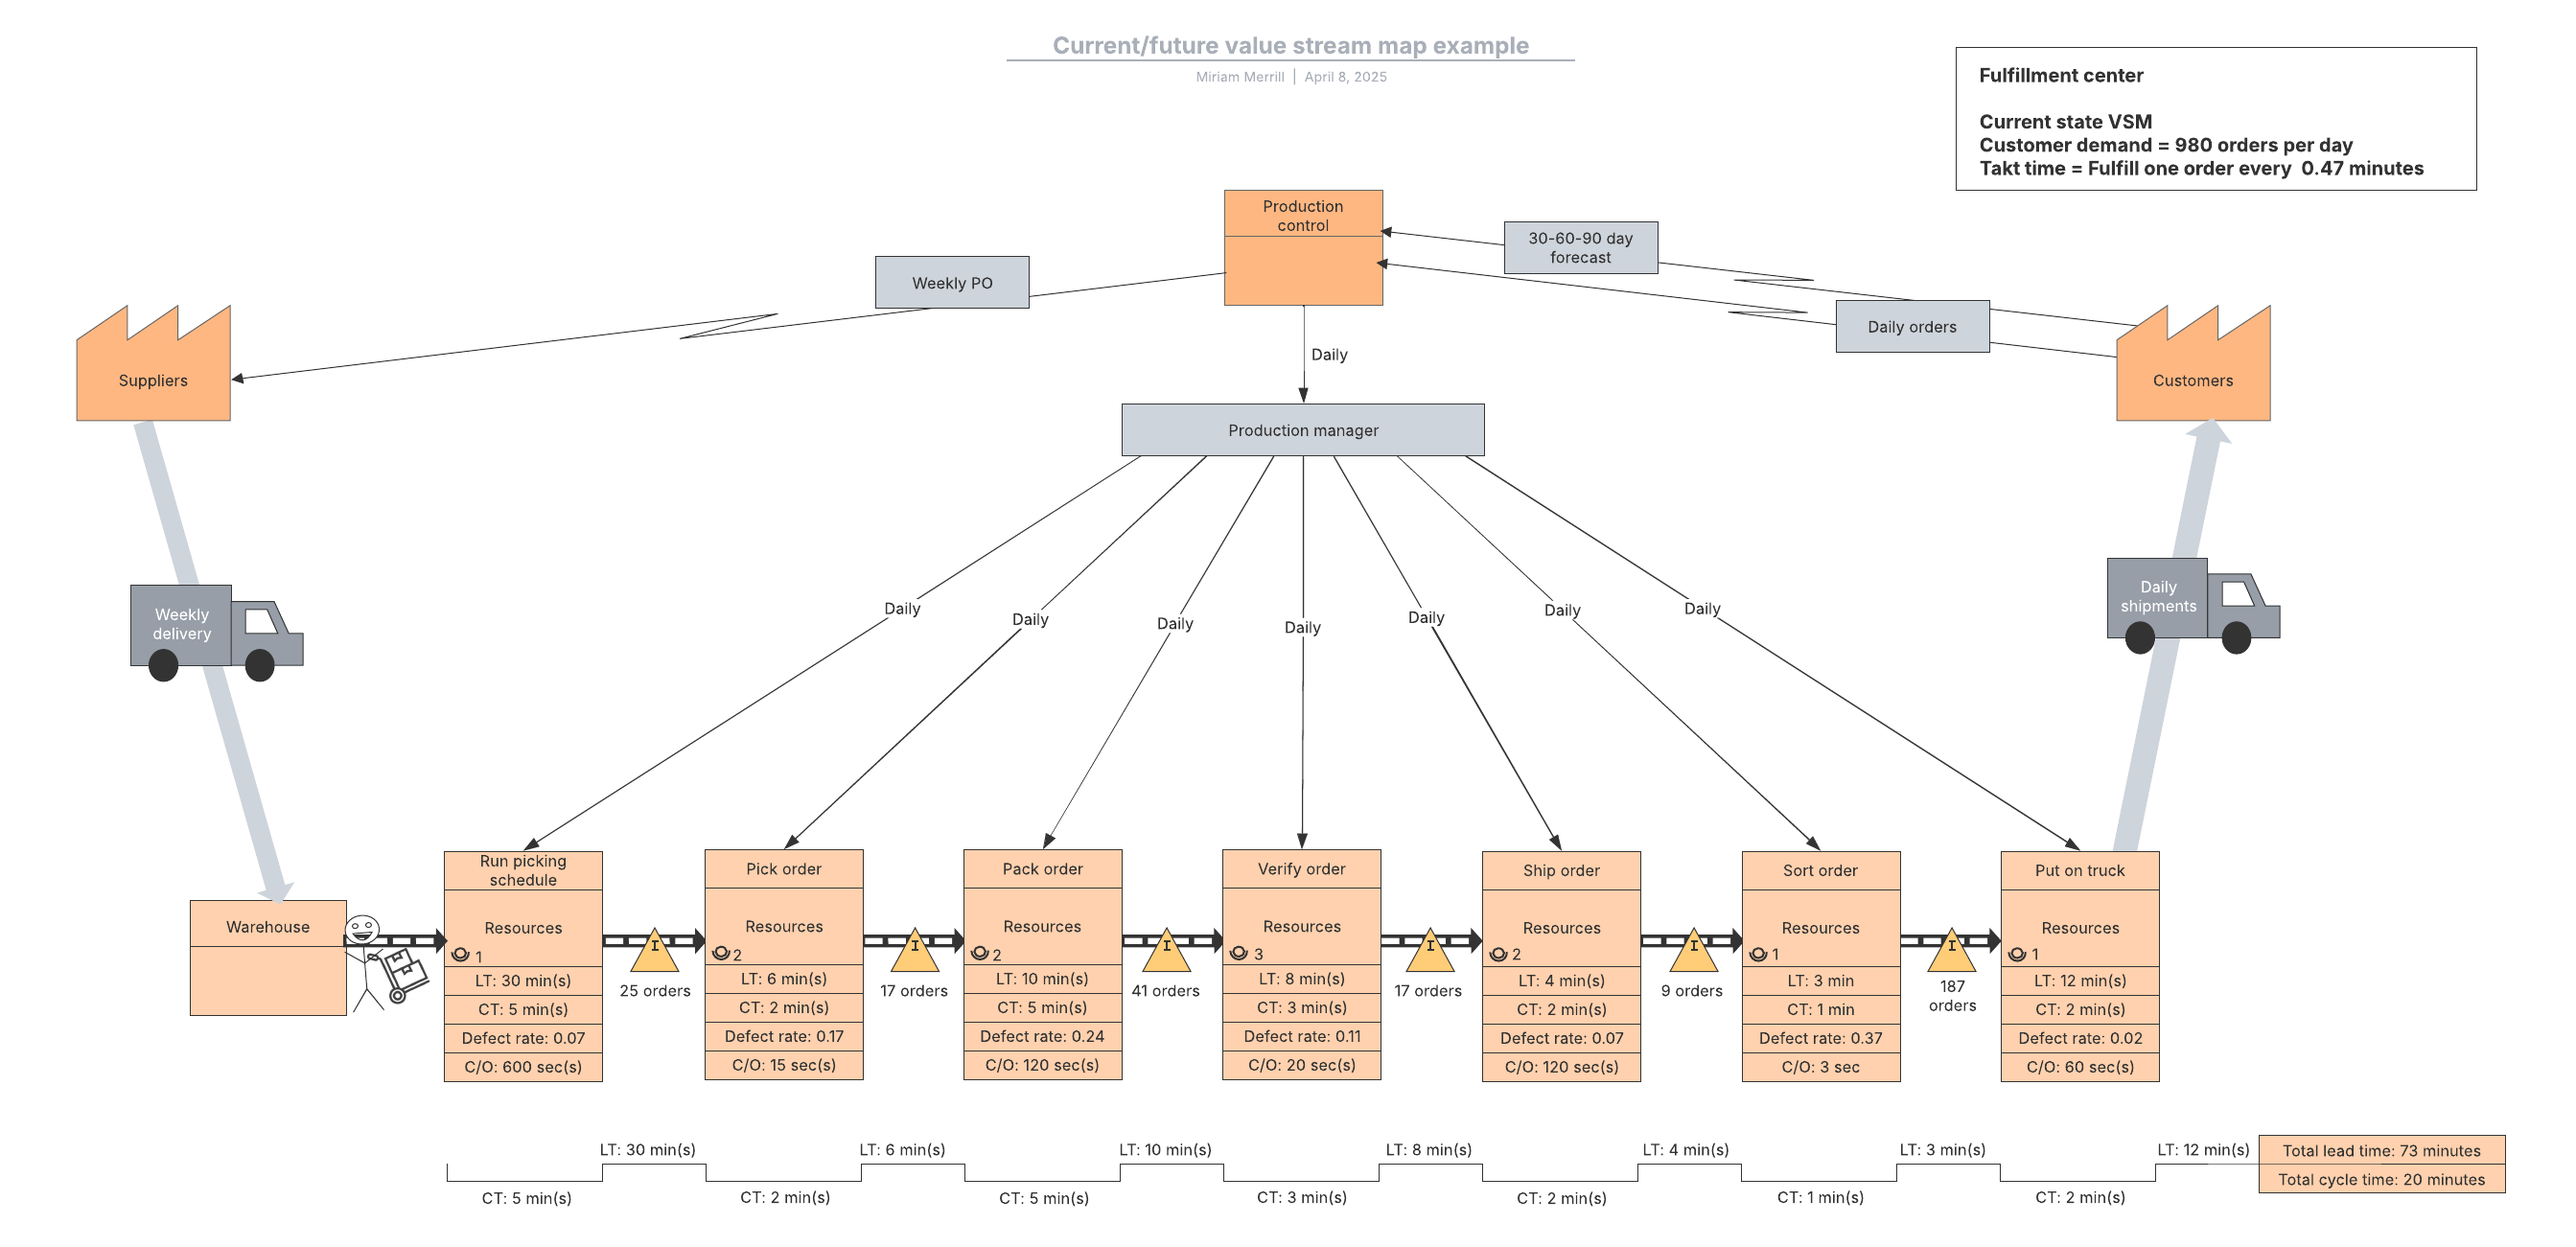
Value stream maps are helpful Lean tools to get you started. Keep in mind, there is a lot of crossover between these various business process improvement methodologies as far as the diagrams they use to analyze processes. Business process maps, for example, could prove helpful in detecting waste or organizing a plan to eliminate it. Many process engineers, however, use value stream maps as part of Lean manufacturing process improvement.
Value stream maps: Document all the steps for delivering a product or service, from the start of production to delivery. Layer the process with a timeline measuring value-added activities and non-value-added activities, so you can see which activities you should remove from the process.
Lean Six Sigma
Just as the name suggests, Lean Six Sigma is a combination of the previous two methodologies.
Taking a Lean approach to Six Sigma process improvement methodology helps you eliminate waste from your organization and reduce process defects. Lean Six Sigma helps you save time, improve quality, and cut costs. It relies on DMAIC and combines the tools from both process improvement methodologies, such as value stream maps and SIPOC analysis diagrams.
Total Quality Management (TQM)
Total Quality Management predates Six Sigma and Lean methodologies for process improvement, gaining a lot of attention in the late 1980s when the US Federal Government began using it. Success results from customer satisfaction within this system. As with Six Sigma, TQM can vary from company to company, but organizations using TQM generally follow these principles:
-
Organizations should follow a strategic and systematic approach to achieve their goals.
-
Customers determine the level of quality.
-
All employees work toward common goals. Effective communication and training ensure that everyone understands the definition of quality and strives to achieve it.
-
Organizations should define the required steps of any process and monitor performance to detect any deviations. They should continually look for ways to be more effective and more competitive.
Measurements for quality depend on the company, though some use established standards, such as the ISO 9000 series.

Explore the top Total Quality Management principles for improving processes.
Get startedDiagrams for TQM
TQM companies have used many different diagrams to troubleshoot quality issues. The original TQM plan instituted by the US Navy used seven tools to measure quality, including the Ishikawa diagrams mentioned earlier, flowcharts, and check sheets. Many companies also use PDCA cycles.
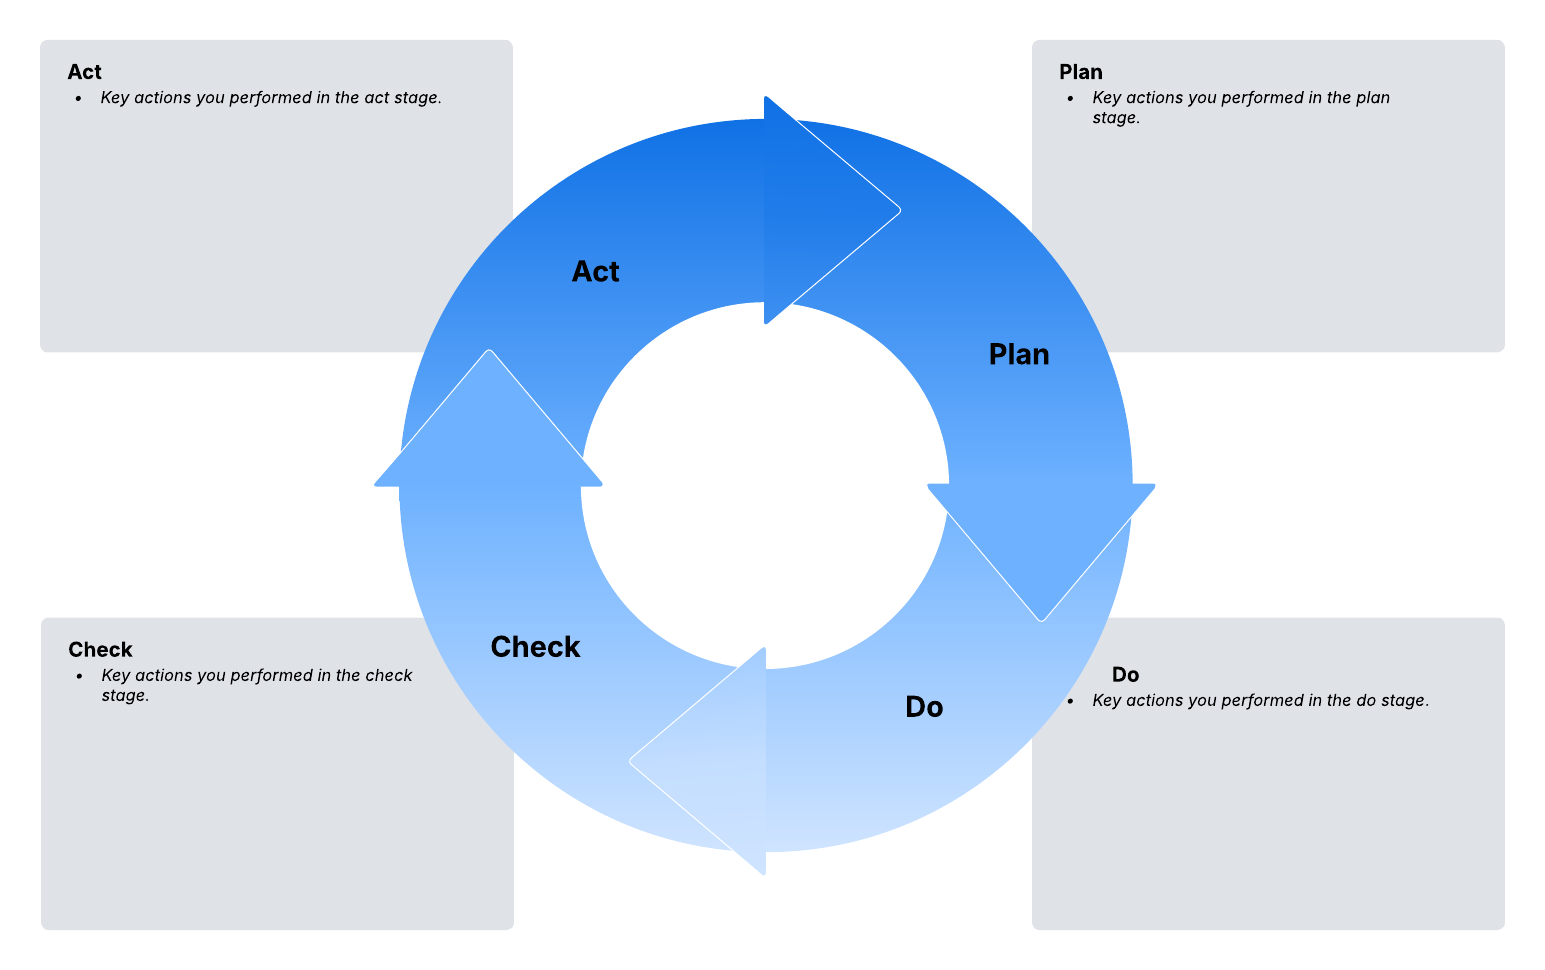
PDCA cycles: PDCA (Plan, Do, Check, Act) goes by many names such as the Deming cycle and the control cycle. Businesses use it for continual process improvement, listing out the proposed plan, testing the plan, and checking the plan's success.
Toyota Production System/ Just-in-time
Also known as just-in-time, the Toyota Production System (TPS) was developed by Taiichi Ohno after World War II, to save time during production and reduce inventory cost. Using the Kaizen approach of small, positive improvements, the basic tenant of TPS is to only produce products when needed, avoiding large inventory stocks.
TPS is typically used by process engineers in tandem with Kanban project management to easily see and track current processes while preventing hidden problems. There are four main principles of TPS:
1. Philosophy
Use your organization's long-term philosophy to guide decisions rather than short-term financial goals.
2. Process
Find the right process to produce the right results. This principle may involve:
-
Using an ongoing process flow to find problems quickly
-
Implementing the "pull" system to prevent overproduction
-
Employing visual controls to see the entire process to avoid hidden problems
-
Using only reliable technology necessary for your people and processes
3. People and partners
Invest in the people to create leaders who embody the company's philosophy and can teach it to others.
4. Problem-solving
Instill a culture of learning for continuous improvement. Fully understand the problem before determining a solution, and avoid rash decisions. Instead, take time to reach a consensus.
Diagrams for Toyota Production System/Just-in-time
When Toyota first implemented the TPS methodology, they used a visual, card-based system to find inefficiencies. Today, there are different tools to help process engineers visualize and manage processes.
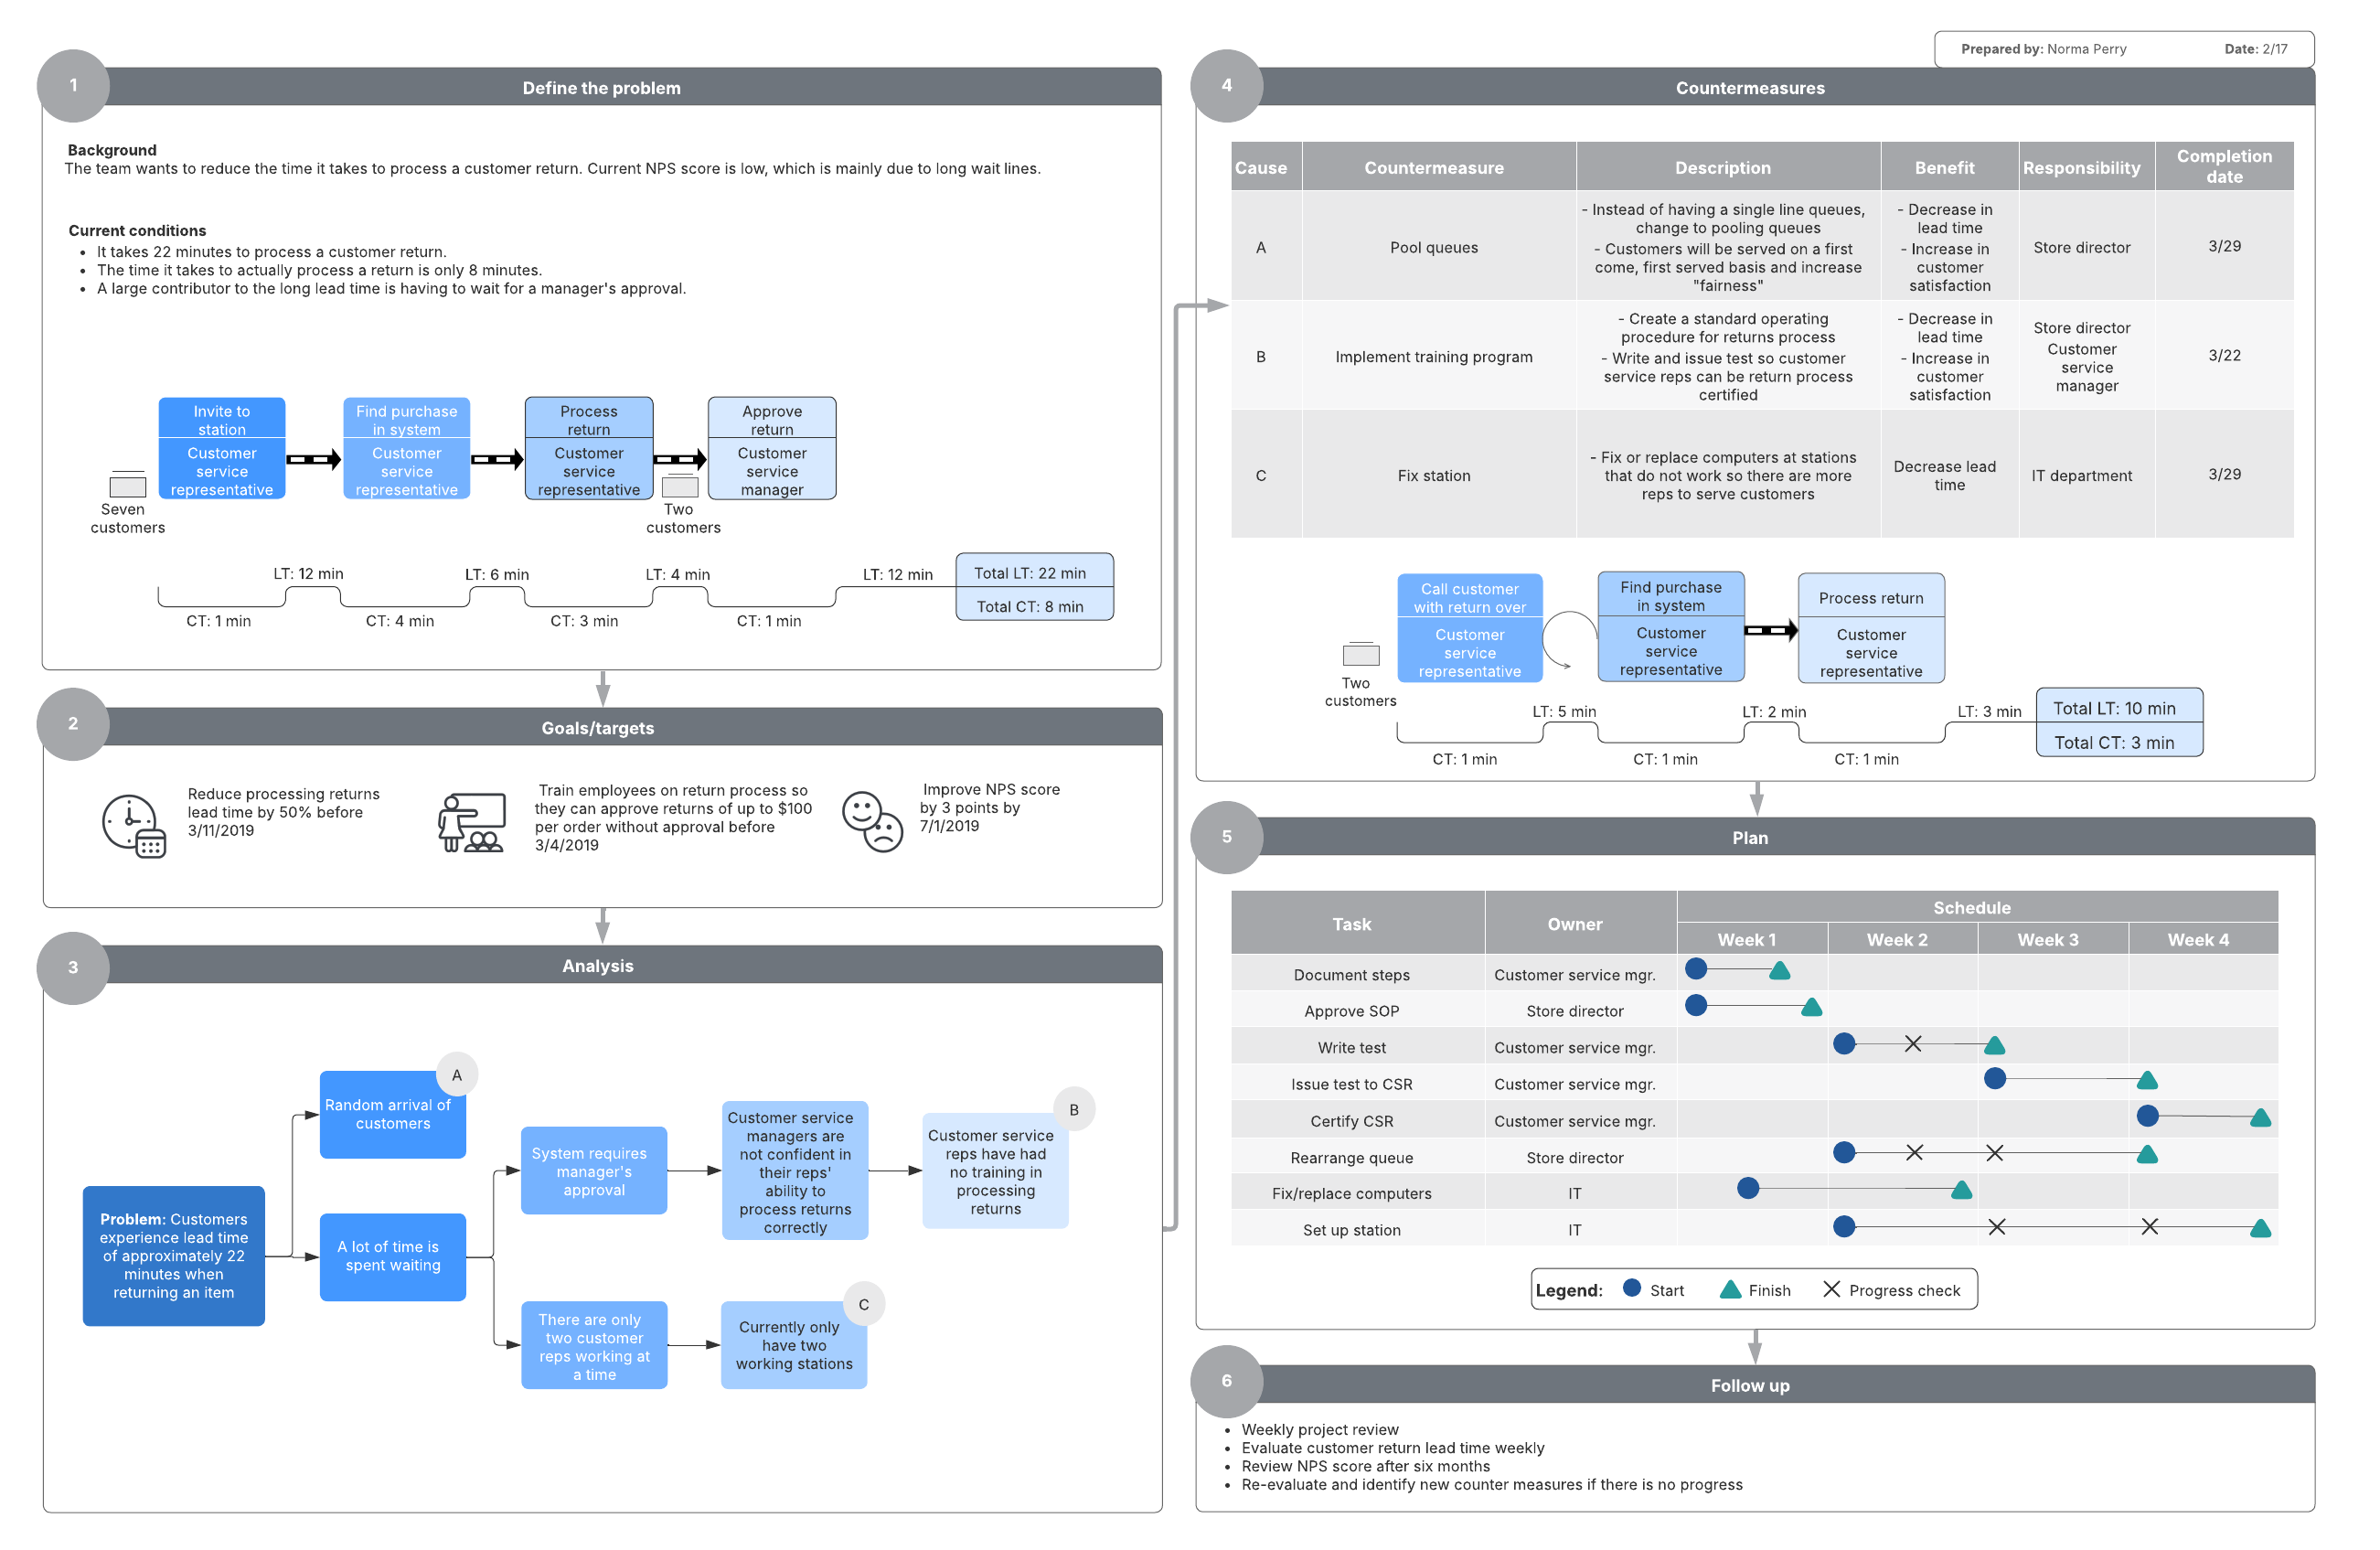
A3 report: A one-page report that easily identifies and communicates crucial process information. The report helps workers solve problems quickly guiding continuous improvements.
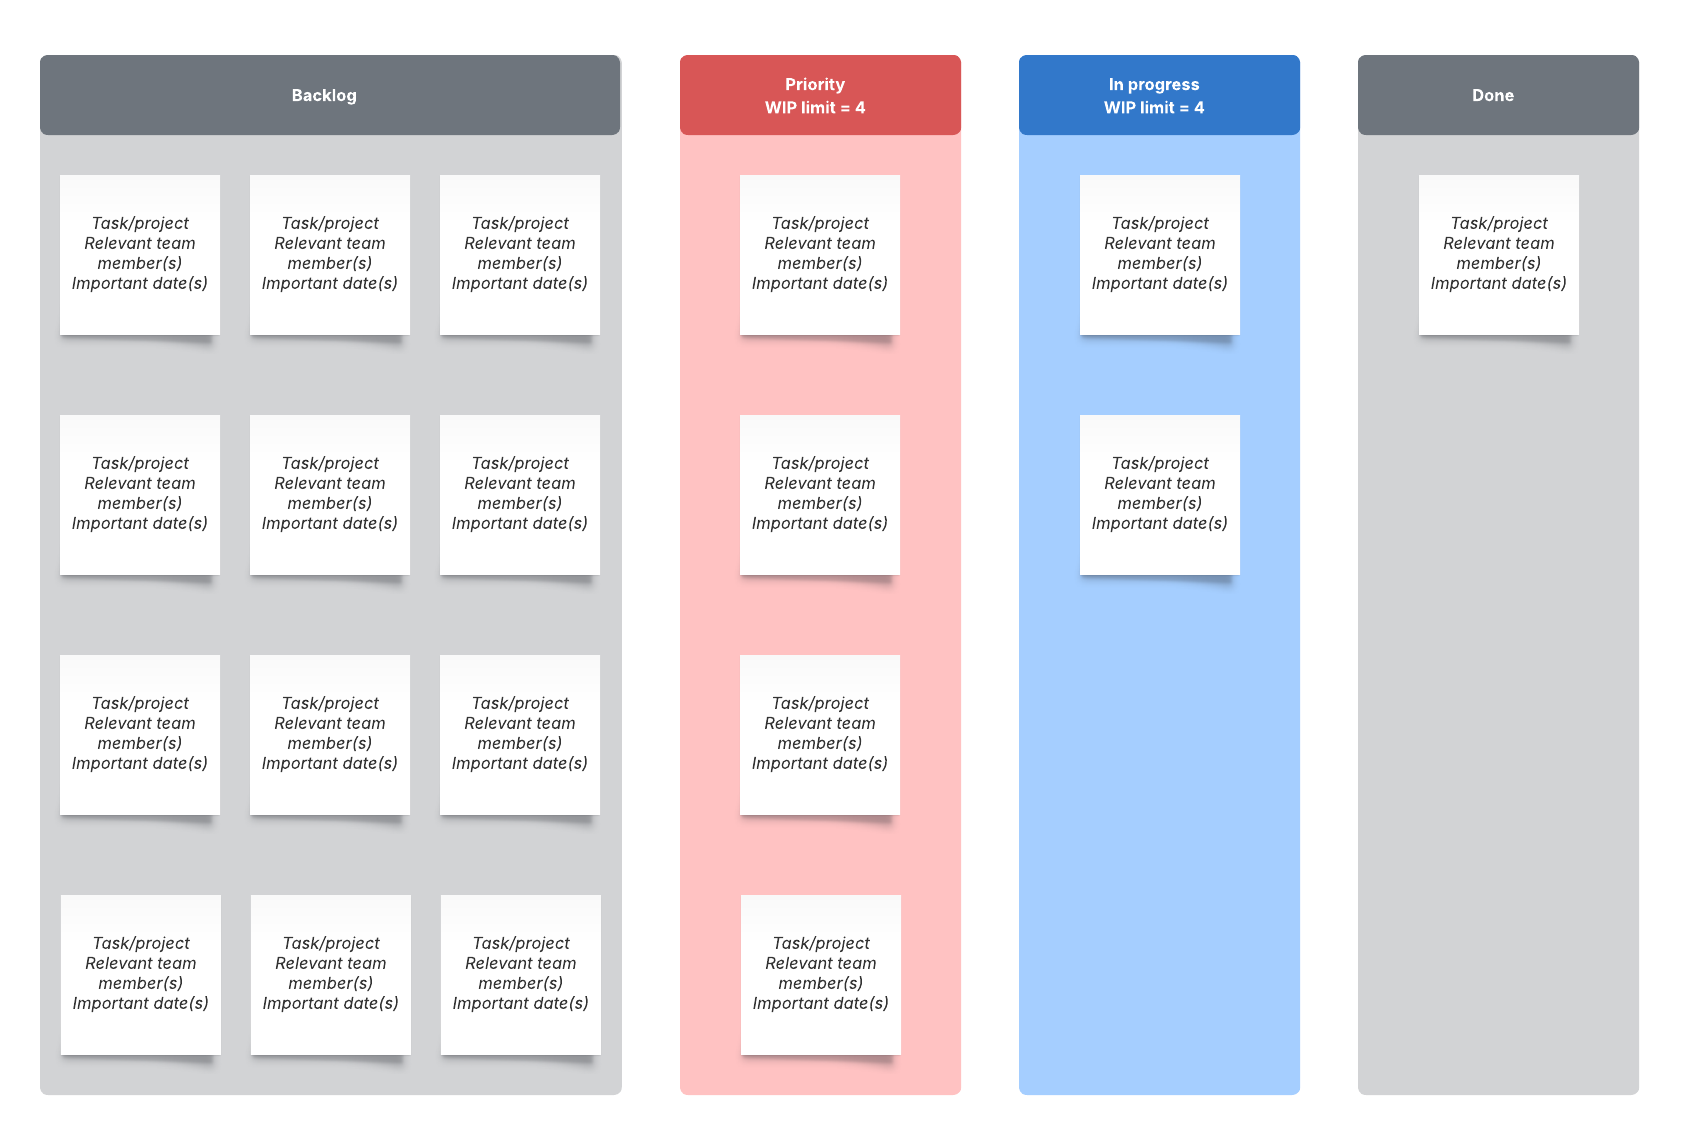
Kanban board: A visual workflow diagram used to track progress, identify problems, eliminate bottlenecks, and improve efficiencies.
Theory of Constraints
First introduced in the early 1980s by Dr. Eliyahu Goldratt, Theory of Constraints (TOC) identifies the biggest factor preventing a goal from being achieved and then uses a systematic process to improve the constraint until it is no longer a limitation.
According to TOC, organizations will always face at least one constraint, meaning that there will always be something to be improved. To apply TOC, to remove the constraint, use these five repeatable steps:
-
Identify the constraint.
-
Decide how to exploit the constraint.
-
Subordinate and synchronize to the constraint.
-
Alleviate the constraint.
-
Repeat the process as needed.

Get our best tips for applying the Theory of Constraints in your business.
Go nowDiagrams for Theory of Constraints
Diagrams make it simple to visualize and understand what influence a constraint has on other parts of the process and where the constraint can be alleviated. Again, there is a lot of crossover between these various process improvement methodologies as far as the diagrams they use for analysis. Many users of TOC tend to use Lean tools and diagrams to monitor processes.
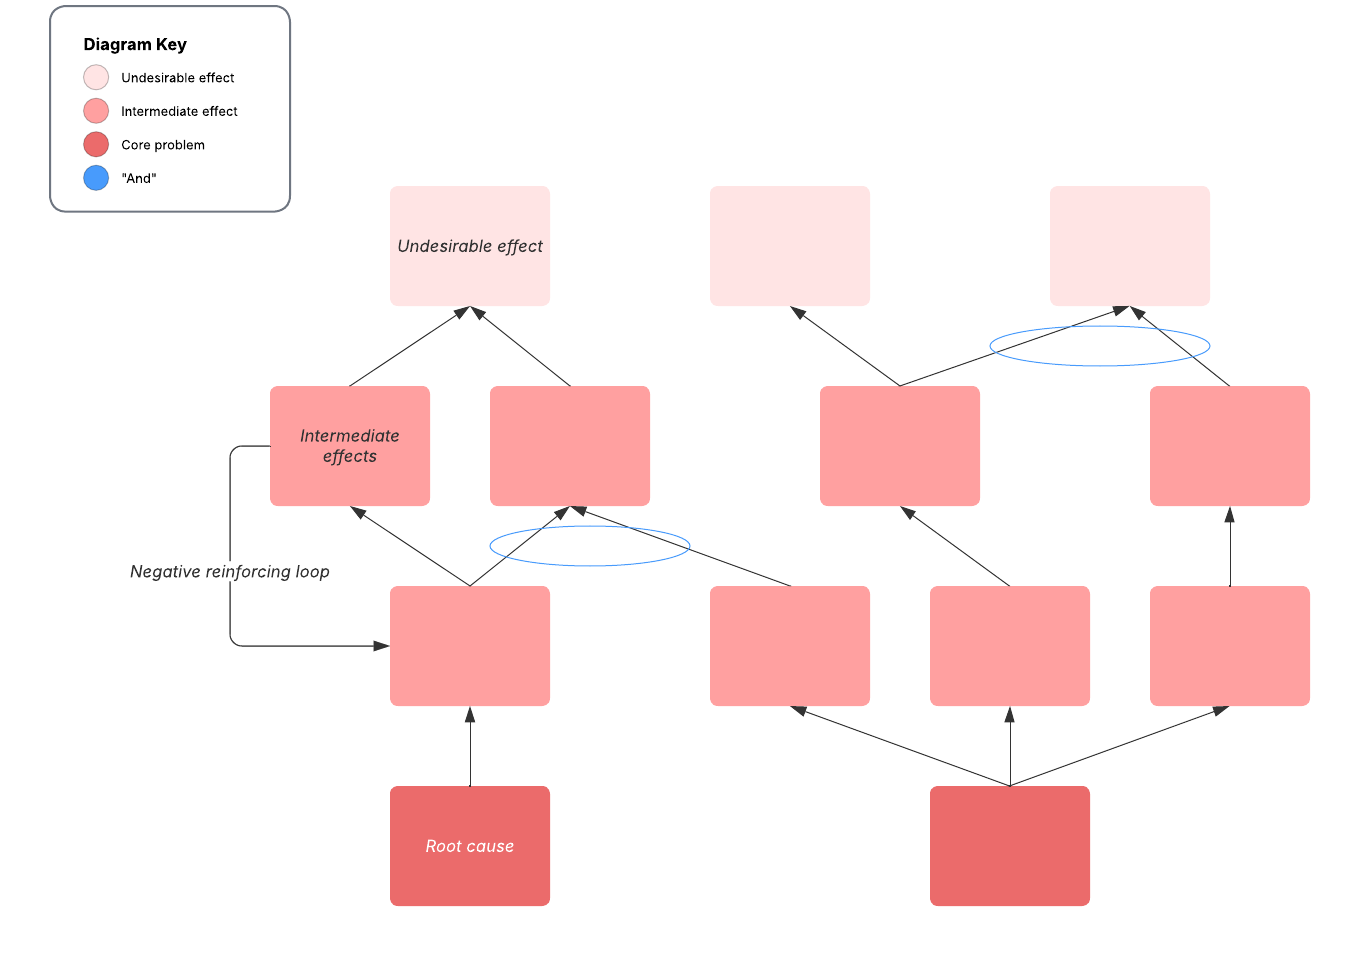
Reality tree diagram: There are future and current reality tree diagrams. Reality tree diagrams are used to analyze and identify problems that hurt organizational processes, determine which is causing the greatest constraint, and begin to alleviate it.

Guide to business process improvement
Regardless of which business process improvement method resonates with you the most, Lucid can help you efficiently implement it into your org for lasting change.
Get the guide

