Accounting flowchart example
This template works on the following products:

*For Team and Enterprise plans
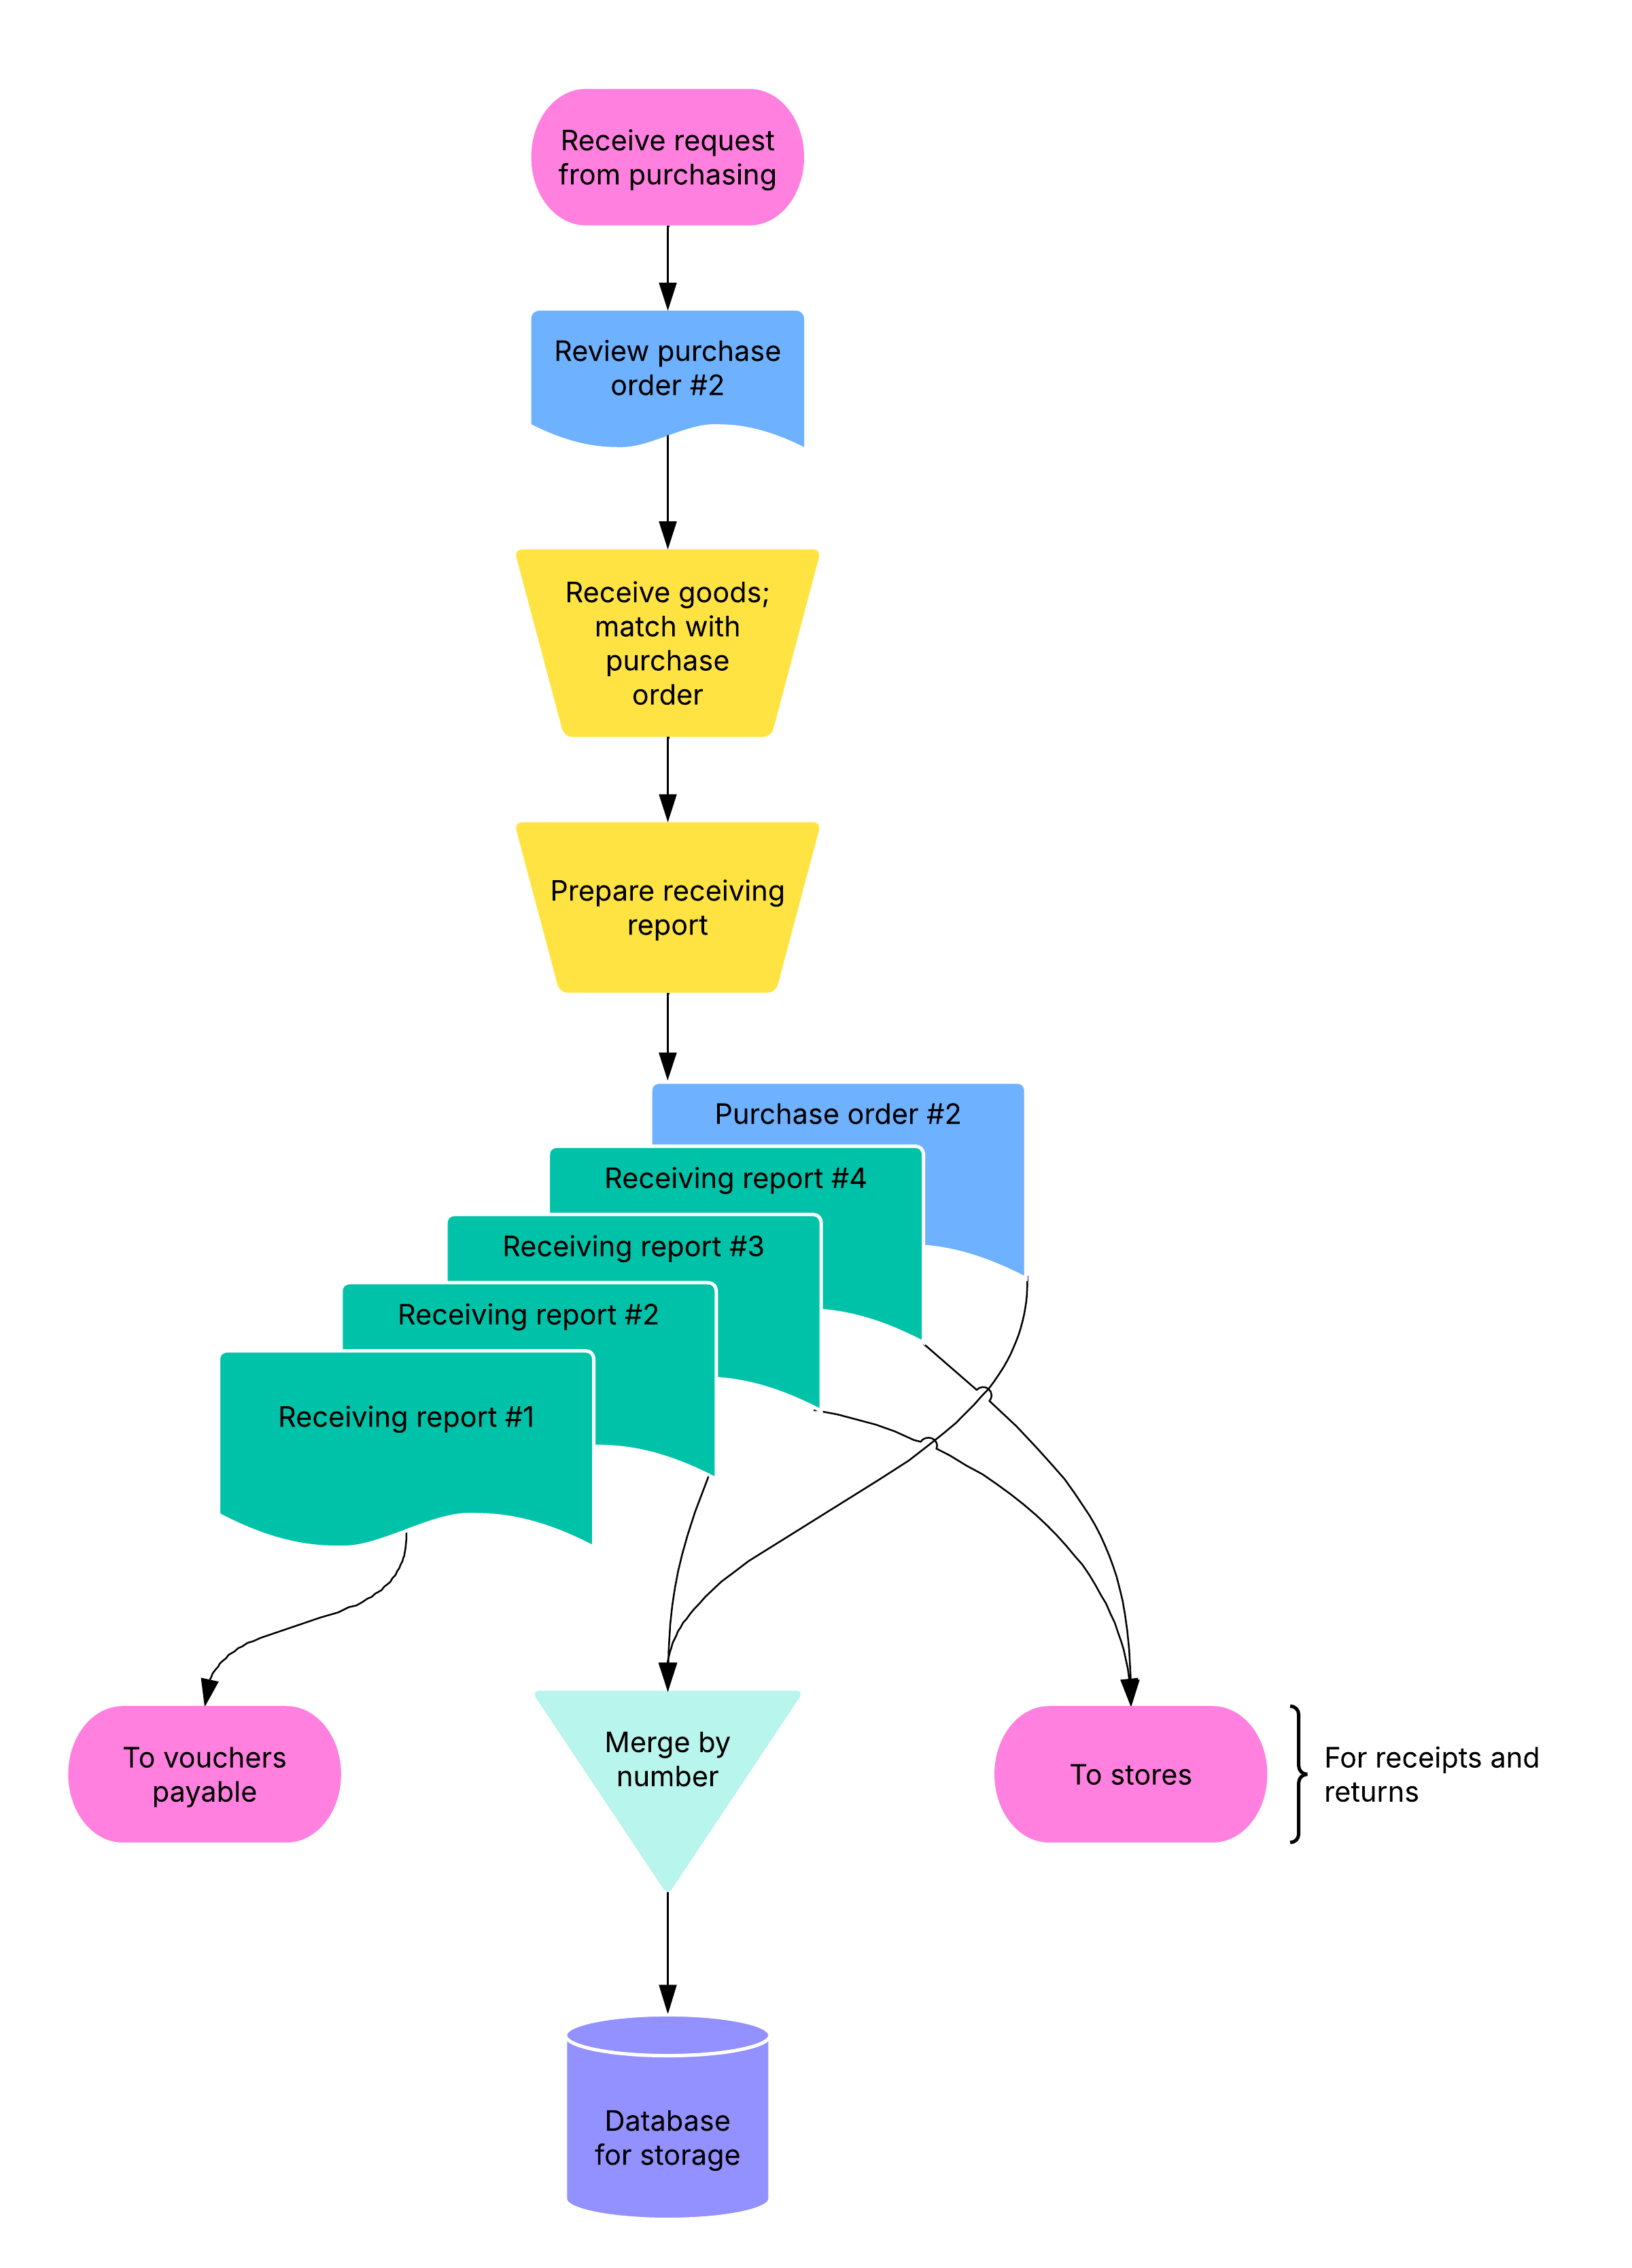
This accounting flowchart template can help you:
- Show the process for reporting financial information.
- Outline the relationship between receiving and purchasing orders.
- Access the flowchart shape library.
Open this template to view a detailed example of an accounting flowchart that you can customize to your use case.
What is the accounting flowchart template?
An accounting flowchart allows you to visualize the different steps and business processes that make up the flow of your accounting work. Our accounting flowchart template includes an example to give you inspiration for your own visual—and the building blocks to edit and make it your own.
Benefits of using the accounting flowchart template?
An accounting flowchart gives you insight into the process of reporting financial information. Easily outline the individual steps that make up the process, as well as the relationships between receiving and purchasing orders, reporting, and more. Our templates provide an intuitive, customizable base for you to build your visuals exactly to your team’s specifications. With real-time data updates and easy sharing, stakeholders can stay aligned on the latest, whether they’re working in-person or remotely.
How to use the accounting flowchart template in Lucidchart
Here’s a step-by-step guide to getting started with your flowchart template:
- Look over the accounting flowchart example to get ideas for how you might want to structure your own, then begin making edits to customize the diagram to your needs. Connect your flowchart to data by clicking "Import Data" on the bottom left corner, so your flowchart updates in real-time as you make changes to your data.
- Add text to a shape by selecting it and typing.
- To format shapes, click on a shape and then use the properties bar at the top of the canvas to choose colors.
- Hover over a shape and click on any red circle to add lines, then add text to a line by double-clicking.
- To format lines, click on a line and use the properties bar at the top of the canvas.
- To view tutorials, click on the button to the right of the document.
- Invite team members to view, edit, or comment on your document via email or published link.