How to measure innovation: Metrics that actually matter
Reading time: about 8 min
Topics:
Let’s get one thing straight right away: Yes, you can measure innovation. In fact, you should measure innovation if you want to get better or more consistent at it.
That said, we know measuring innovation, an inherently nebulous activity, isn’t easy, especially if you haven’t formalized an innovation strategy yet. However, those who define their organization’s innovation metrics will have a significant advantage over those who don’t: a clear way to optimize their investments and scale innovation.
So what are the most important innovation metrics to track, and how do you go about collecting that data? We posed these questions to Lucid’s innovation experts, Jeff Rosenbaugh, Christopher Bailey, and Patrick Saul (all from Lucid’s professional services team). Here are their top recommendations for effectively measuring innovation.
Why bother measuring innovation, anyway?
Innovation metrics are not merely a way to feel good about your team’s efforts. Quite the contrary: Measuring innovation is one of the most fundamental elements of managing innovation and helps teams overcome innovation barriers.
The benefits of measuring innovation include:
- Reduced risk: Innovation metrics are the only sure way to know which innovation projects are worthwhile to continue pursuing and which ones should be stopped. Regularly evaluating your metrics allows you to invest incrementally, reducing the risk of allocating too many resources to a product or service that could flop in the market.
- Increased transparency across the business: Tracking innovation metrics gives the necessary stakeholders visibility into innovation progress, making it easier to gain support and buy-in for future projects.
- Greater accountability: Metrics can be powerful motivators. Measuring innovation results allows teams to see the impact of their efforts and creates a sense of accountability in moving the needle.
Now that you know why you should measure innovation, let’s dive into how.
The innovation metrics that matter
Here are the most important innovation KPIs to track—at both the individual project and overall portfolio level.

Project-level metrics
Most innovation portfolios will consist of core innovation projects as well as adjacent and transformational innovation projects. Core innovation is focused on optimizing existing products, services, or processes, so there is a high degree of certainty, making measurement relatively straightforward. For that reason, ROI (return on investment) is a solid measure of success for core innovation.
Adjacent and transformational projects, on the other hand, involve exploring new opportunities and, therefore, come with much more uncertainty and risk, making them far more challenging to measure. “In these cases, you cannot necessarily use ROI as an effective measure as these projects are only in the early stages,” said Saul. “Instead, you want to look at metrics that indicate learning since the goal is to reduce risk and uncertainty.”
In other words, the metrics used for adjacent and transformational innovation should inform which projects you should move forward with, which ones you should pause, and which ones simply need to take a different direction. Here are the best metrics to help you reduce risk early on:
- Rate of learning: This metric will show you how quickly teams are learning—that is, validating or invalidating assumptions. You can think of this metric as similar to velocity measures in an Agile team. Calculate the learning rate by taking the number of critical assumptions validated/invalidated within a certain timeframe (such as a sprint) over the overall number of critical assumptions identified. The higher the rate, the better.
- Cost of learning: For each item we learn about the project, how much, on average, does it cost? Calculate the cost of learning by looking at how much you’ve invested compared to the number of assumptions validated. The lower, the better on this one.
The rate and cost of learning will be the most important metrics to track in the early stages of each innovation project. Use the combination of these two scores to make strategic decisions about which projects to continue investing in.
Note: Keep in mind that you may need to add another, more granular layer of metrics to determine whether you’ve validated assumptions. These are custom to your unique business goals but may include metrics such as product usage, percentage of return visitors, or your Net Promoter Score.
In the innovation space, one of our primary jobs is to reduce uncertainty with new products and services. Your metrics should show what you’ve done this month to reduce uncertainty. And that may not be that you actually delivered a product to a customer, but that you answered a critical question that, had it remained unanswered, would mean you’d have to stop your effort completely.
—Jeff Rosenbaugh, senior director of professional services, Lucid
Portfolio-level metrics
Tracking each individual project is certainly important, but to truly figure out how to allocate your investment between innovation projects, you’ll need a bird’s-eye view of your entire portfolio. We recommend looking at these key portfolio-level innovation metrics:
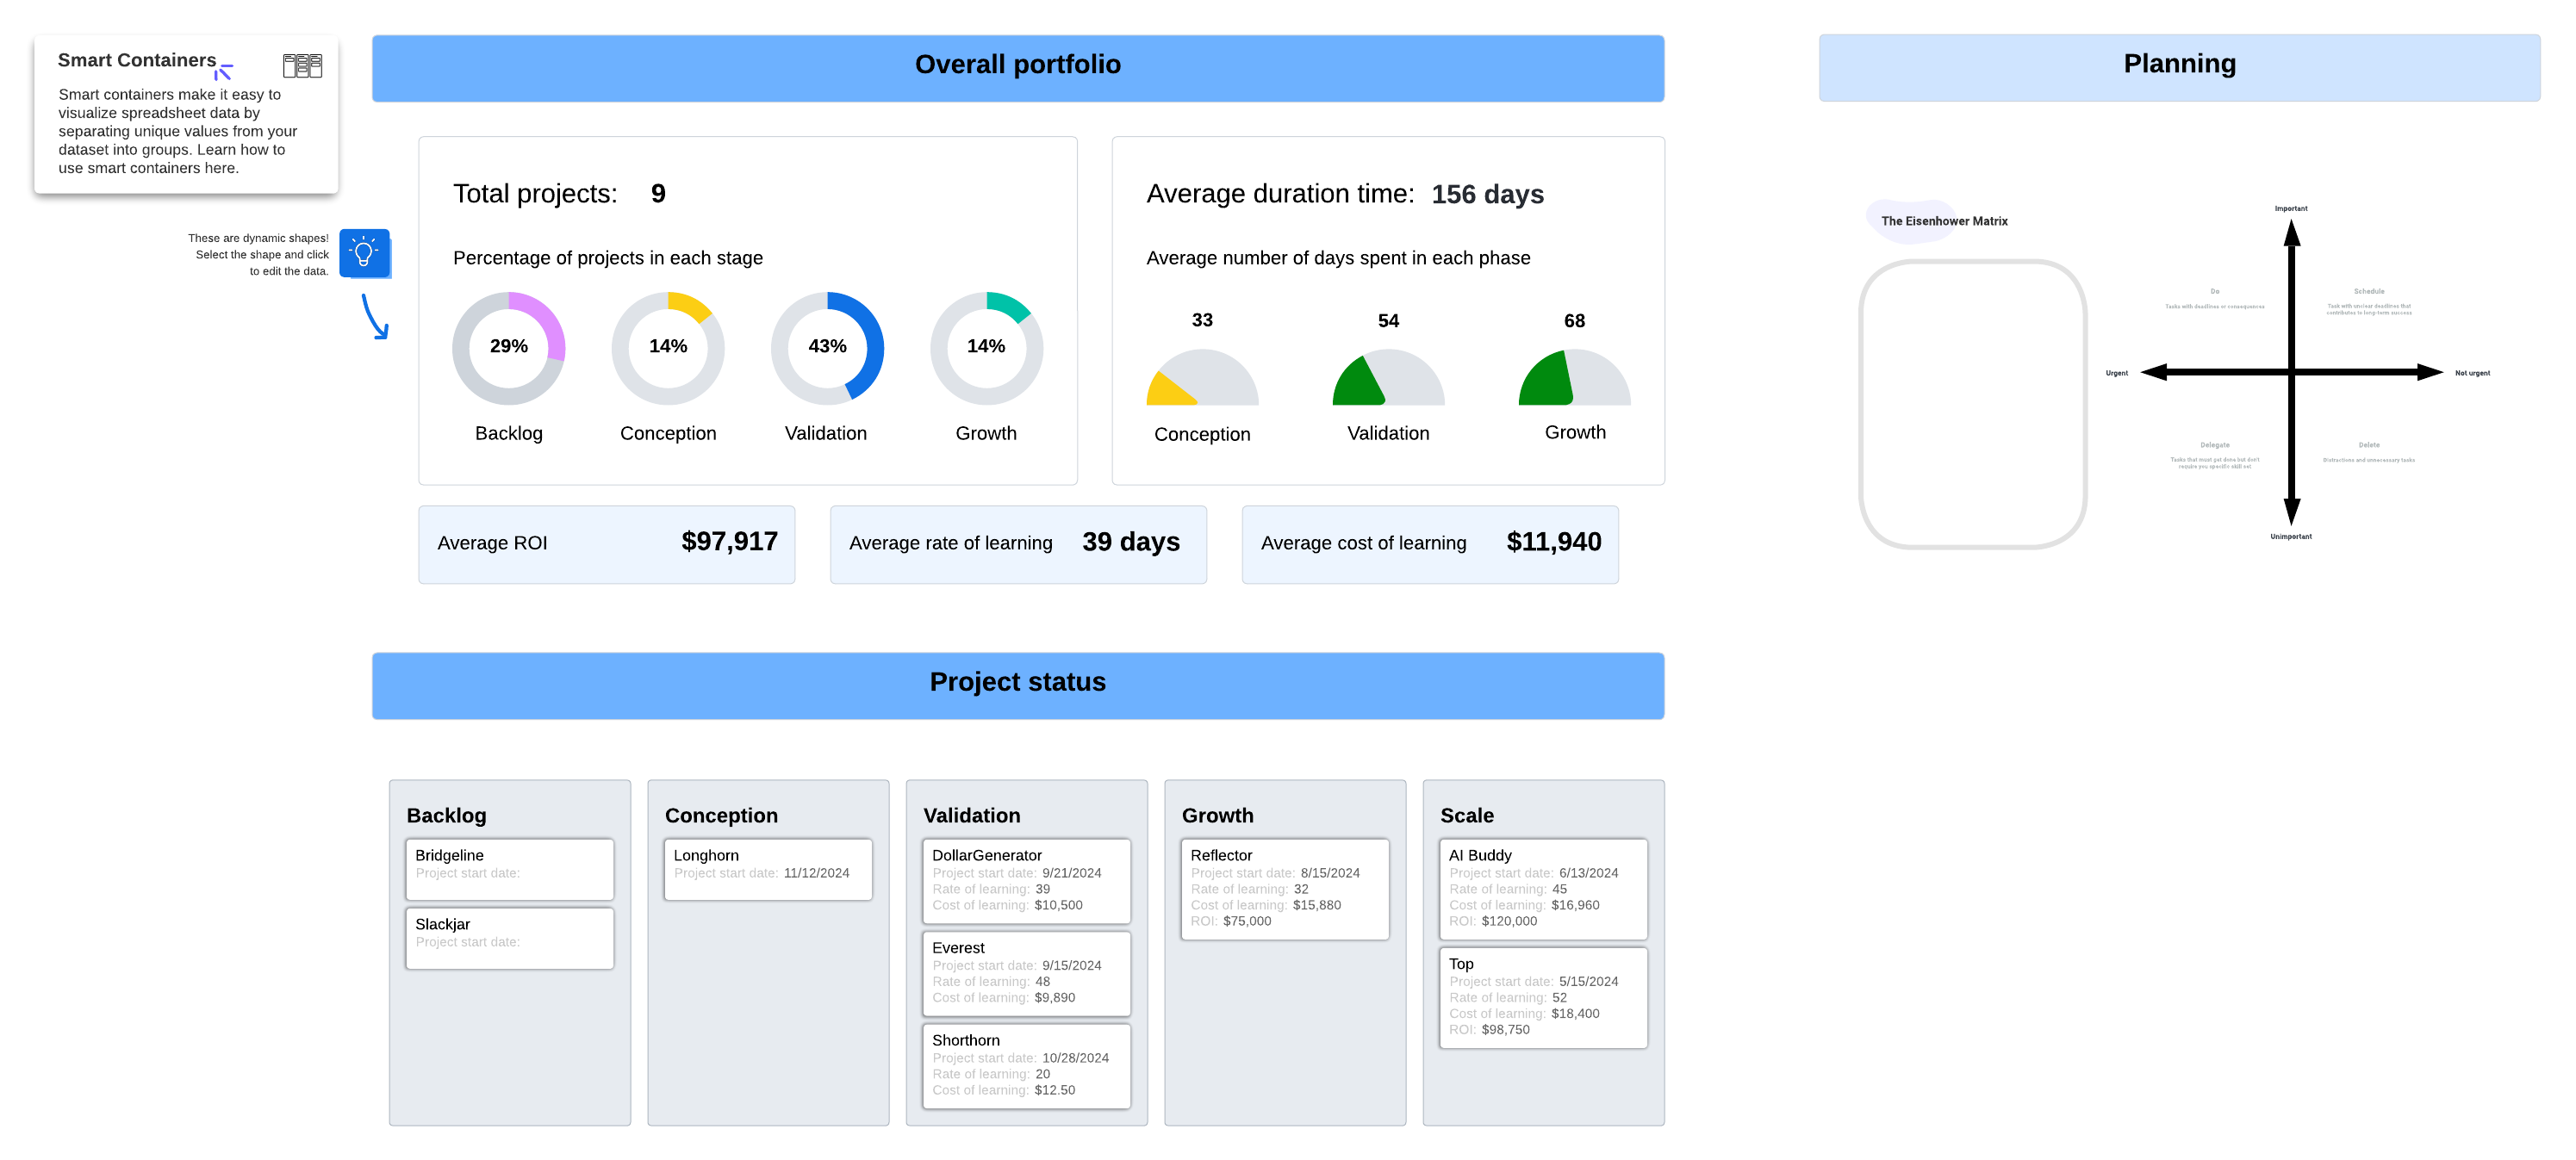
- Percentage of projects in each stage of the innovation process: How many projects are in the backlog, conception, validation, and growth stages? Use this number to determine if you’re making a balanced number of bets. (Need help determining which projects are in which stage? Use Lucid’s innovation framework for clarity.)
- Cycle time of projects in each phase: Look at how long projects spend in each stage of the innovation process. This metric will show how fast you’re learning and progressing.
- Average duration of projects in the pipeline: Use this metric to determine how efficient your innovation process is and identify areas to streamline.
- ROI from projects exiting the growth stage: Okay, now you can measure ROI. Projects exiting your pipeline have been validated, with little uncertainty remaining. Look at project income compared to project cost to determine the ROI from your innovation pipeline.

Innovation management guide
Learn what practices and processes are needed to manage innovation.
Read the guideHow to measure innovation: Tips to get started
How do you actually collect these metrics to measure innovation at a company? Here are a few tips to ensure that you’re on track.
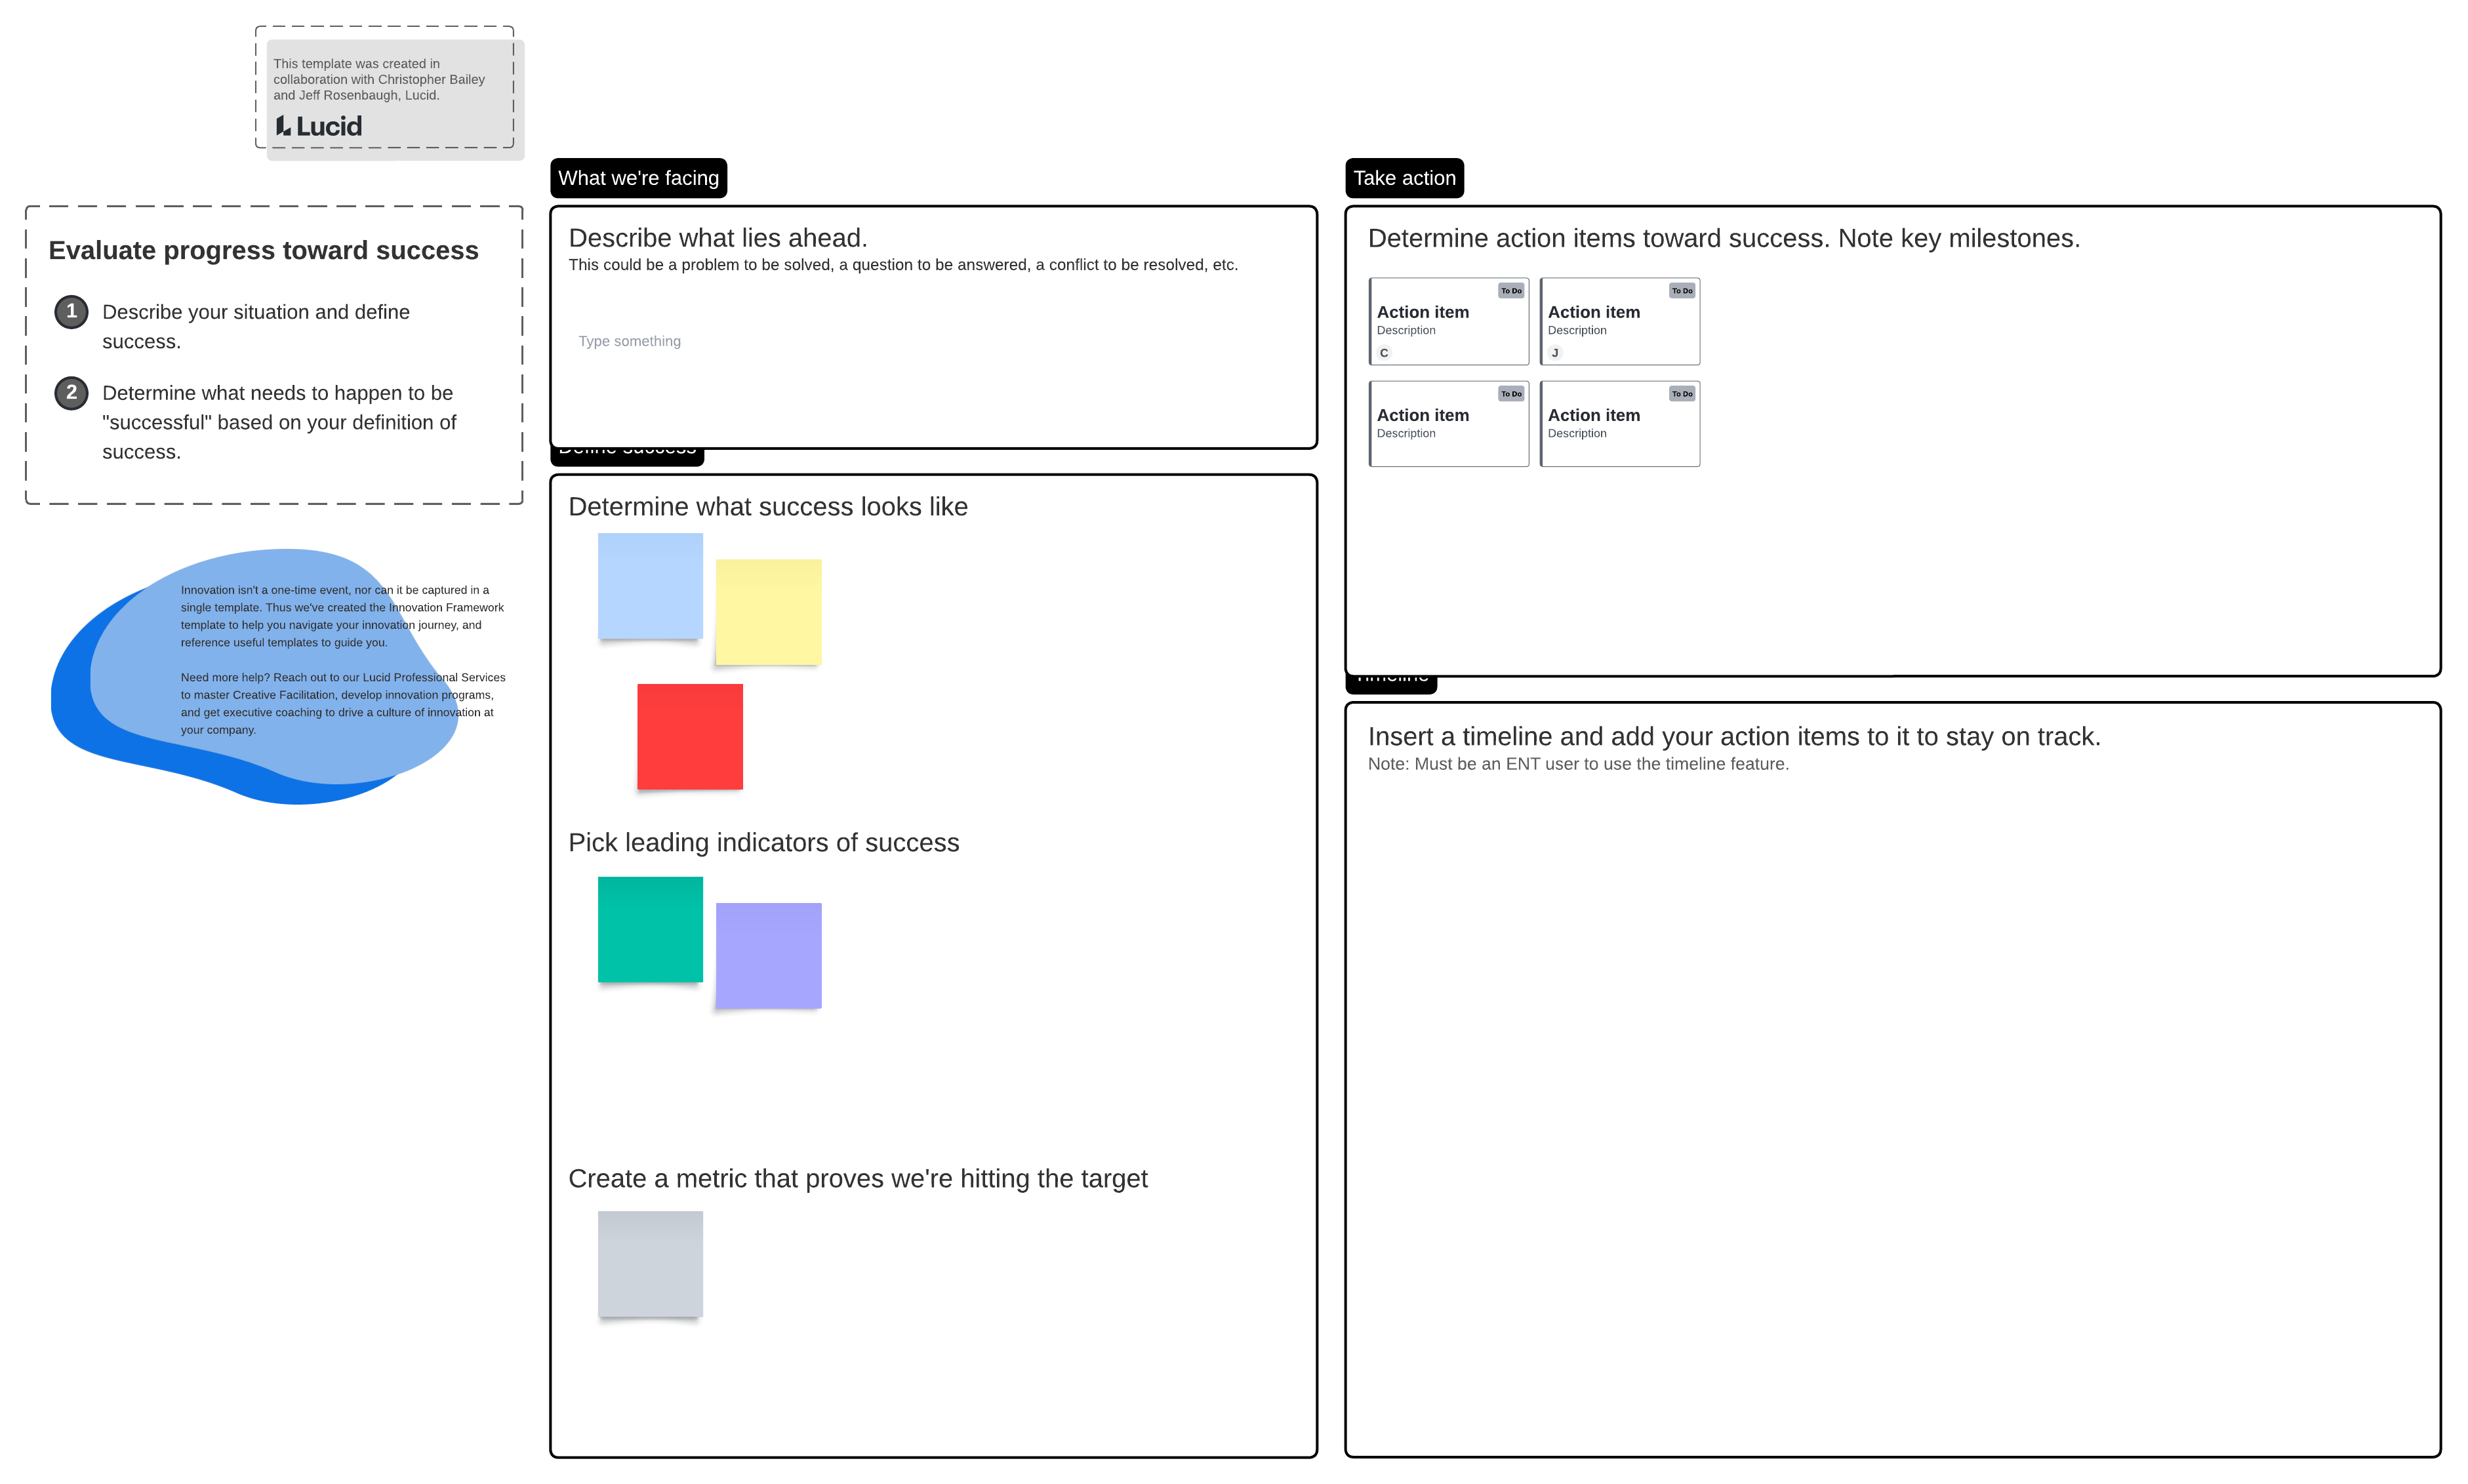
Tip #1: Set up goals for your innovation portfolio
Before you can set up any metrics, take some time to define the goals for your innovation program. These goals are often driven by what needs to change at an organization—that is, what isn’t working. Examining internal weaknesses, vulnerabilities, or threats to the business could also help identify areas needing innovation. There may also be an external trend, like AI, that creates a unique opportunity for you and your organization. In these cases, you’d want to quickly explore and identify the true value of that opportunity.
Saul recommends framing your goals as “how might we” questions. For example, If there’s a new technology that recently emerged with significant implications for your workforce, you might challenge your team with: How might we apply this technology to improve the way we work together? Or, if you’ve identified an unmet need for your customers or clients, you could ask: How might we change our product lines to meet these newly identified needs?
These questions can help teams focus their innovative efforts in the right direction so they come up with ideas that can be tested against overarching goals within your innovation program.
Tip #2: Design experiments around your most critical assumptions
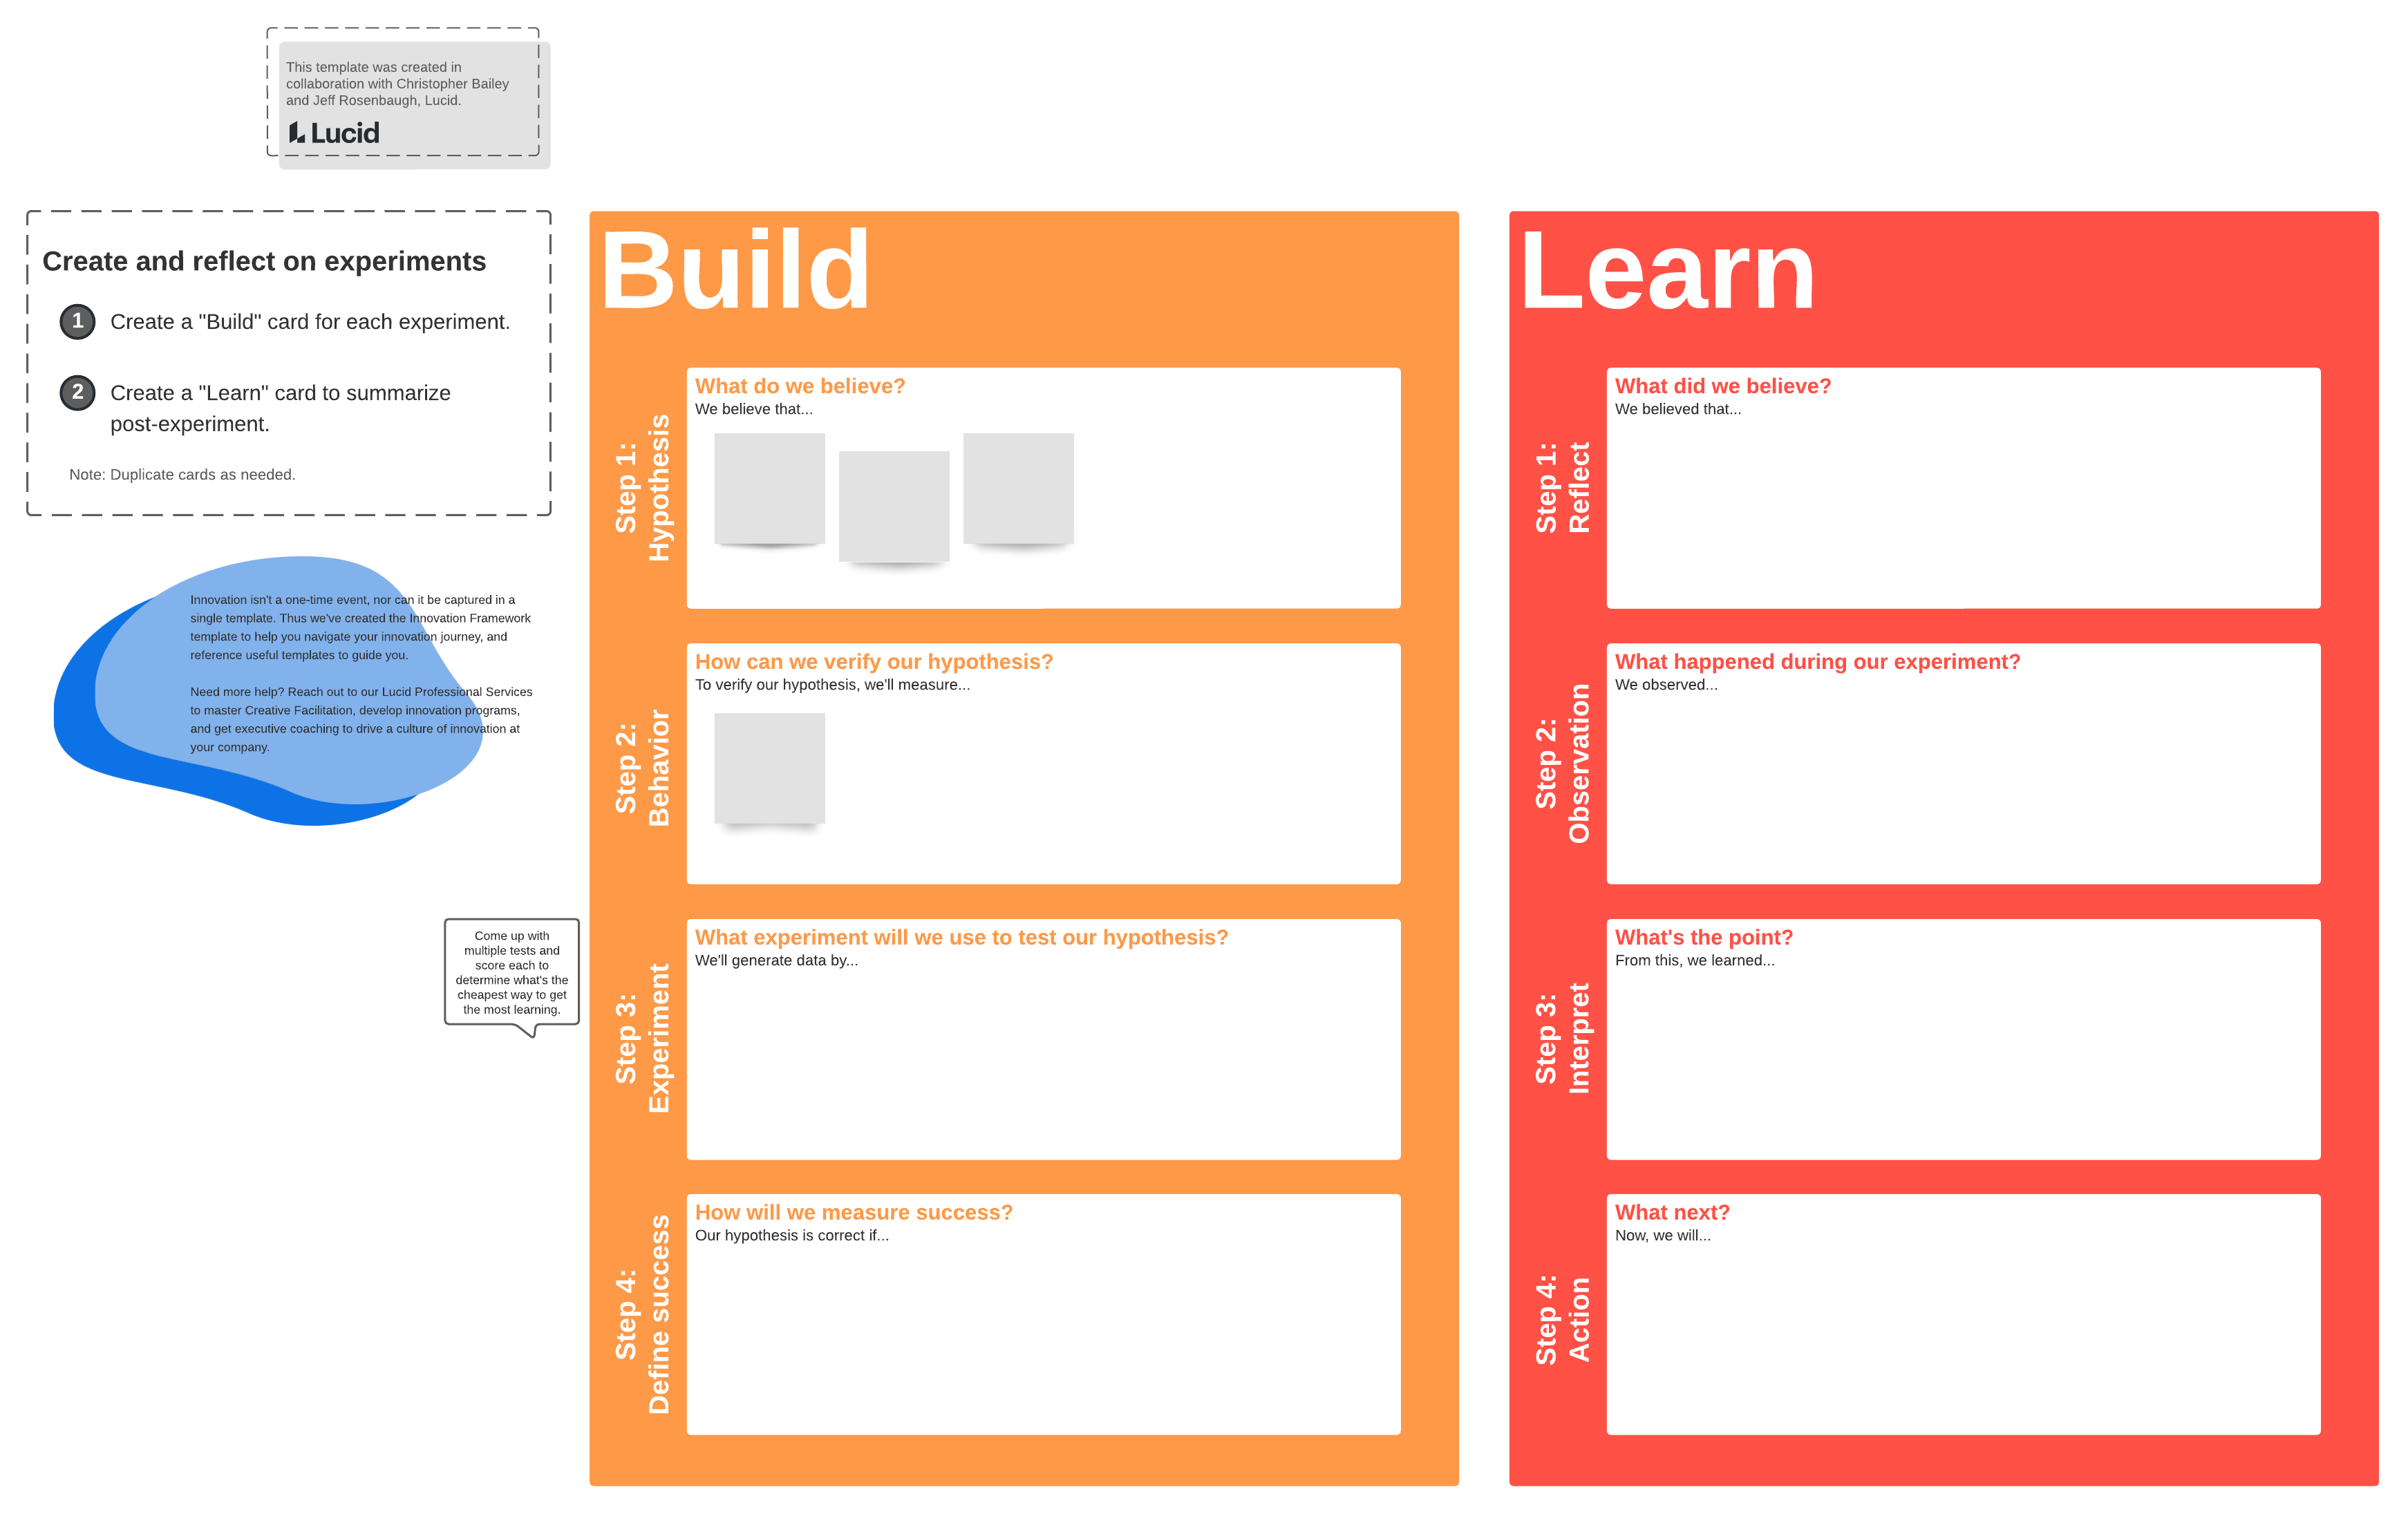
How can you determine whether you’re actually learning and reducing risk in each project? By setting up experiments that put the most critical assumptions to the test.
Critical assumptions are factors that need to be true for your innovation effort to succeed. They should align with the portfolio goals you’ve established. For example, you may assume that people would rather use your new product over the existing solutions available or that demand for your new product will increase over time.

Design your experiments around your most critical assumptions first. As you progress through your experiments, either validating or busting assumptions, you’ll gather the data you need to decide whether to continue working on each project.

Agile innovation
Learn how to set up experiments to learn and measure innovation incrementally.
Read moreTip #3: Measure projects in rates or percentages, not counts
To accurately measure the success of each experiment, you need to define the desired outcome. Typically, outcomes look like a behavior change in a customer, such as returning to your product or using your product in a new way. With the outcome in mind, you can measure whether you’re reaching it.
“Many times, when you get into a conversation around metrics and innovation, a lot of people bring up the leading indicators, things like number of ideas created or the amount of interest that somebody has in something,” said Bailey. “And those are fine things to measure, but they don’t necessarily tell us whether we are actually achieving the outcomes that we want through this funding that we're spending on innovation.”
The key here? Instead of using count metrics, use rates or percentages. Simple count metrics, often referred to as vanity metrics or “innovation theater,” measure activity and provide no context as to what the data means. Percentages, on the other hand, measure progress toward your desired outcome and help you better understand the impact of your innovation efforts.
For example, if you hope to increase repeat users, you’d measure the percentage of your users who are returning users (not the number).

Tip #4: Create visual dashboards to document your innovation metrics
Innovation metrics are clearly powerful decision-making inputs, but not if they’re hard to understand. Instead of using spreadsheets or other static tools to track innovation, we recommend using visual dashboards. Visual charts and graphs can help stakeholders easily understand innovation performance and make it easier to gain support and buy-in.
Consider using one of Lucid’s dashboard templates to get started. You can even connect other sources, such as spreadsheets or project management tools, with Lucid to instantly create visual representations of your data and project progress.
With virtual whiteboarding and intelligent diagramming in a single platform, Lucid supports innovation across the

Boost innovation with Lucid
Find out all the ways Lucid helps organizations streamline and scale innovation.
Go nowAbout Lucid
Lucid Software is the leader in visual collaboration and work acceleration, helping teams see and build the future by turning ideas into reality. Its products include the Lucid Visual Collaboration Suite (Lucidchart and Lucidspark) and airfocus. The Lucid Visual Collaboration Suite, combined with powerful accelerators for business agility, cloud, and process transformation, empowers organizations to streamline work, foster alignment, and drive business transformation at scale. airfocus, an AI-powered product management and roadmapping platform, extends these capabilities by helping teams prioritize work, define product strategy, and align execution with business goals. The most used work acceleration platform by the Fortune 500, Lucid's solutions are trusted by more than 100 million users across enterprises worldwide, including Google, GE, and NBC Universal. Lucid partners with leaders such as Google, Atlassian, and Microsoft, and has received numerous awards for its products, growth, and workplace culture.
Related articles
Why you need an innovation strategy ASAP (with tips to get started)
You can’t innovate consistently without a strategy. Uncover all the benefits and how to get started here.
How to turn your document repository into an innovation repository
Not all document repositories will help you innovate. Find out how to create one that boosts alignment and creativity here.
How to develop an efficient innovation process
Bringing new ideas to life is not a linear process. Let’s examine the phases of innovation and review actionable tips for making them more efficient.
Innovation management guide: Techniques and tools to scale innovation
Maximize ROI on your innovation projects with tips from Lucid’s own innovation experts.