
How I use Lucid and airfocus for streamlining user research
Aubrey Matthias
Reading time: about 9 min
The combined power of Lucid and airfocus have completely transformed my role as a product manager—particularly how I identify my customers’ pain points and develop solutions. I need to collect a lot of user research to figure out the most impactful problems to solve, but that’s not easy when the research and data are spread across tools with no easy way to visualize the end-to-end user experience.
Before my current role at Lucid, my process for conducting research was painstakingly siloed and disorganized. I’d even just have papers on my desk with research from focus groups and customer interviews. The flexibility of Lucid combined with the structure of airfocus has helped me centralize my research, collaborate with teammates, and create deliverables for stakeholders, which makes it easier to determine action steps.
I’ve gone from a siloed, antiquated way of working to a new way that’s more efficient. I hope any product managers who are struggling with centralizing and sharing their research can draw inspiration from my examples of how I use Lucid and airfocus for user research.
Gathering and synthesizing user research
As I conduct user research, I often have a series of hypotheses or assumptions that I seek to challenge which inform the broader research goal or objective I’ve identified. I’m able to use airfocus as my central hub for user feedback and management tool for voice of the customer. In airfocus, my user research is all documented and tracked in one place.
I start by reviewing all existing user feedback relevant to the questions I have in airfocus. Before airfocus, I had to manually collect feedback from emails, surveys, support tickets, and more. It was time-consuming and difficult to identify trends, but airfocus automatically brings all this data together. I often find that we have a lot of signal already, saving me time from having to start from scratch.
As I’m doing primary research collection, I develop a set of interview questions that help me validate one hypothesis at a time. I interview a lot of different people and ask them the same questions, gathering different insights. I’m able to add new research findings to airfocus as I go.
With Insights, airfocus’s feedback management tool, I can start linking key takeaways to the airfocus items in my backlog to inform our overall product strategy and requirements. My airfocus items represent work, like features or projects, to focus on next, and they also help inform epics that my team will work on.
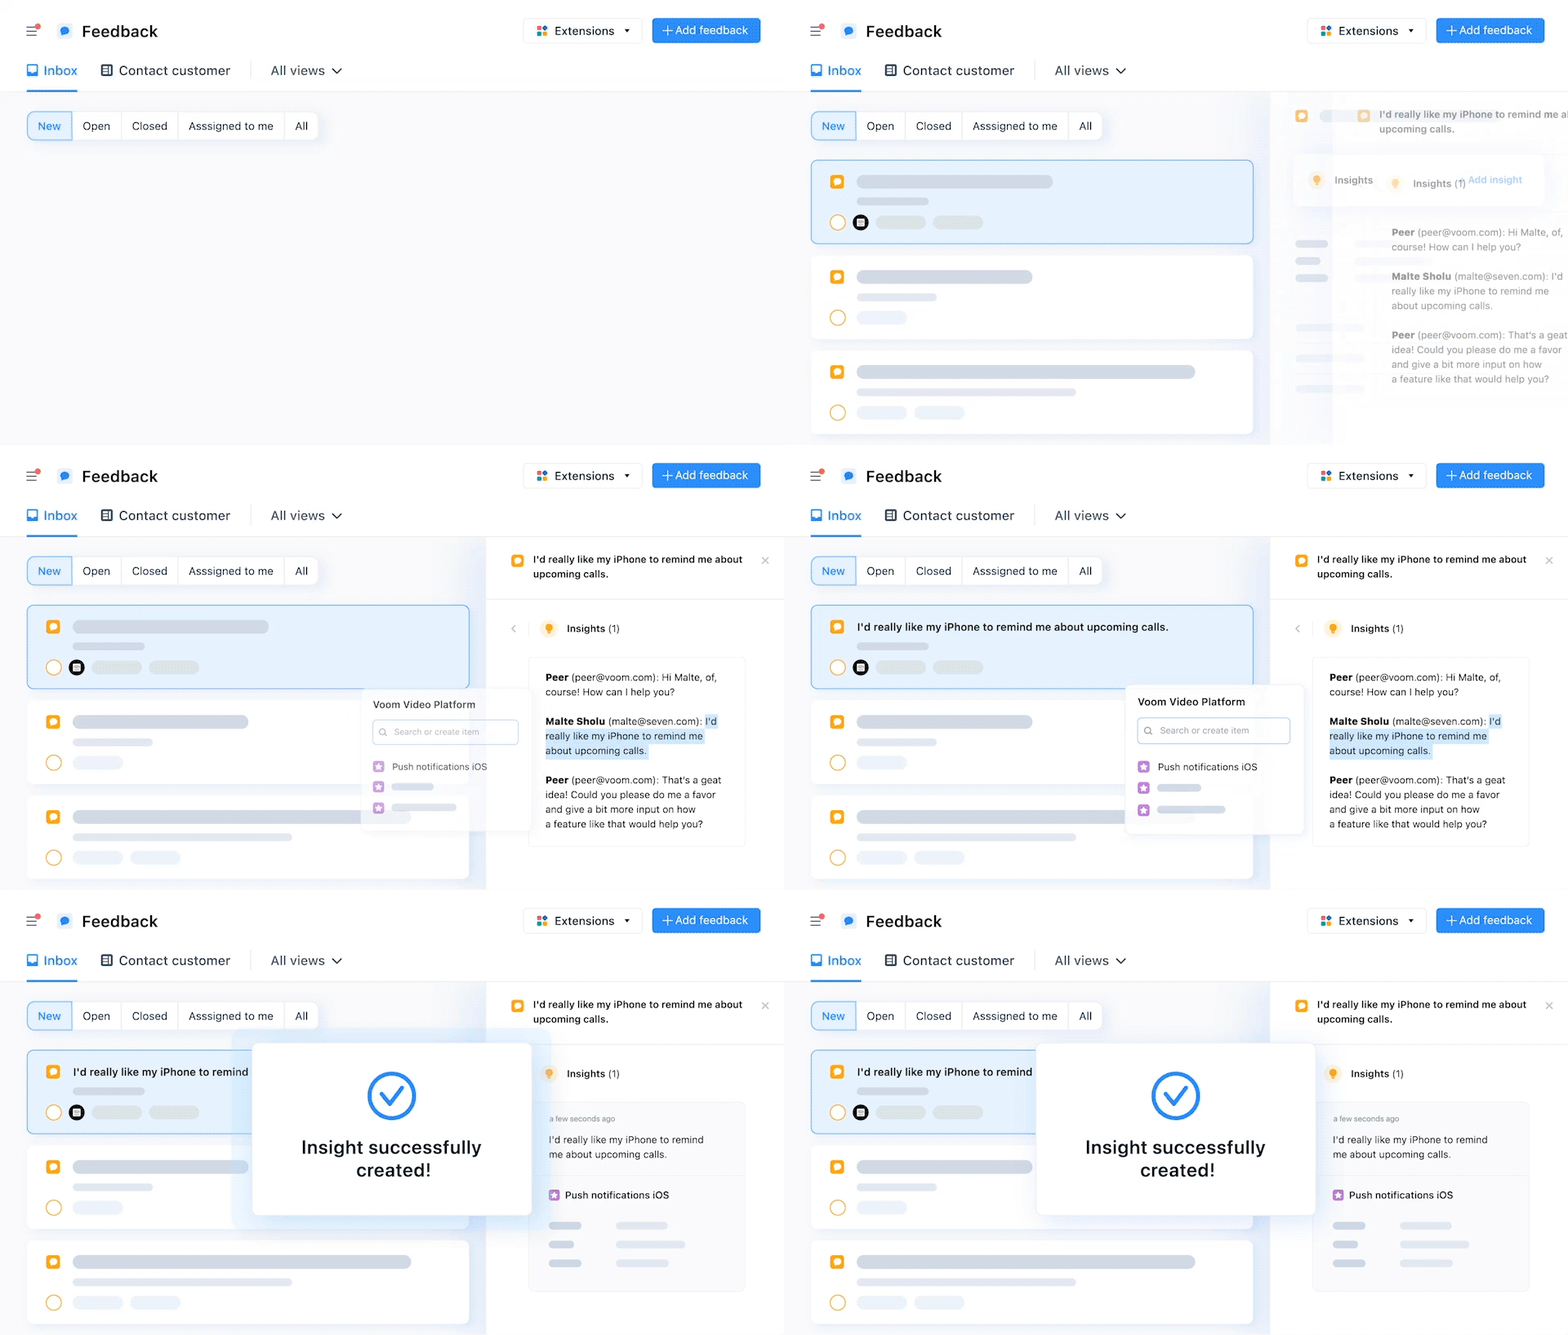
Once I’ve gathered user research, I can use AI Assist in airfocus to summarize customer insights. I can quickly analyze customer feedback, analyze sentiment, and get brief summaries. Using the AI feature saves me so much time since it means that I don’t have to spend hours combing through my research. Once all of my customer responses are summarized, I can start determining next steps.

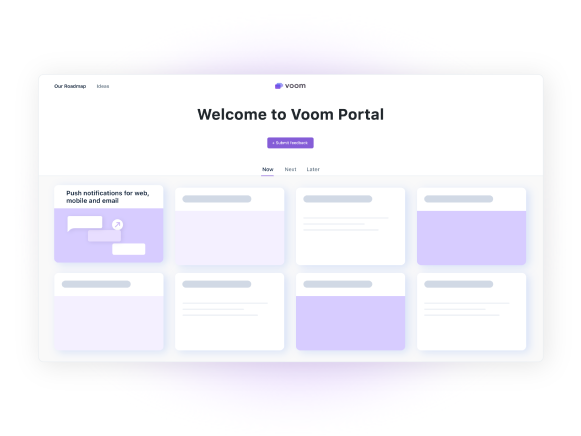
As themes in my research start to emerge, perhaps into potential initiatives, I can use the airfocus Portal as a great way for me to engage with users. A portal is a customer-facing branded website that I can use to share ideas, gather feedback, and validate concepts. airfocus helps me surface problems that should be prioritized and better understand customer needs.
Leveraging both qualitative and quantitative user research
For successful user research, both qualitative and quantitative data need to be gathered to make data-driven decisions and recommendations. Qualitative research informs the user journey, pain points, and jobs-to-be-done. Quantitative research helps me better identify where within the user journey the biggest gaps are and, from there, what should be prioritized to build or fix.
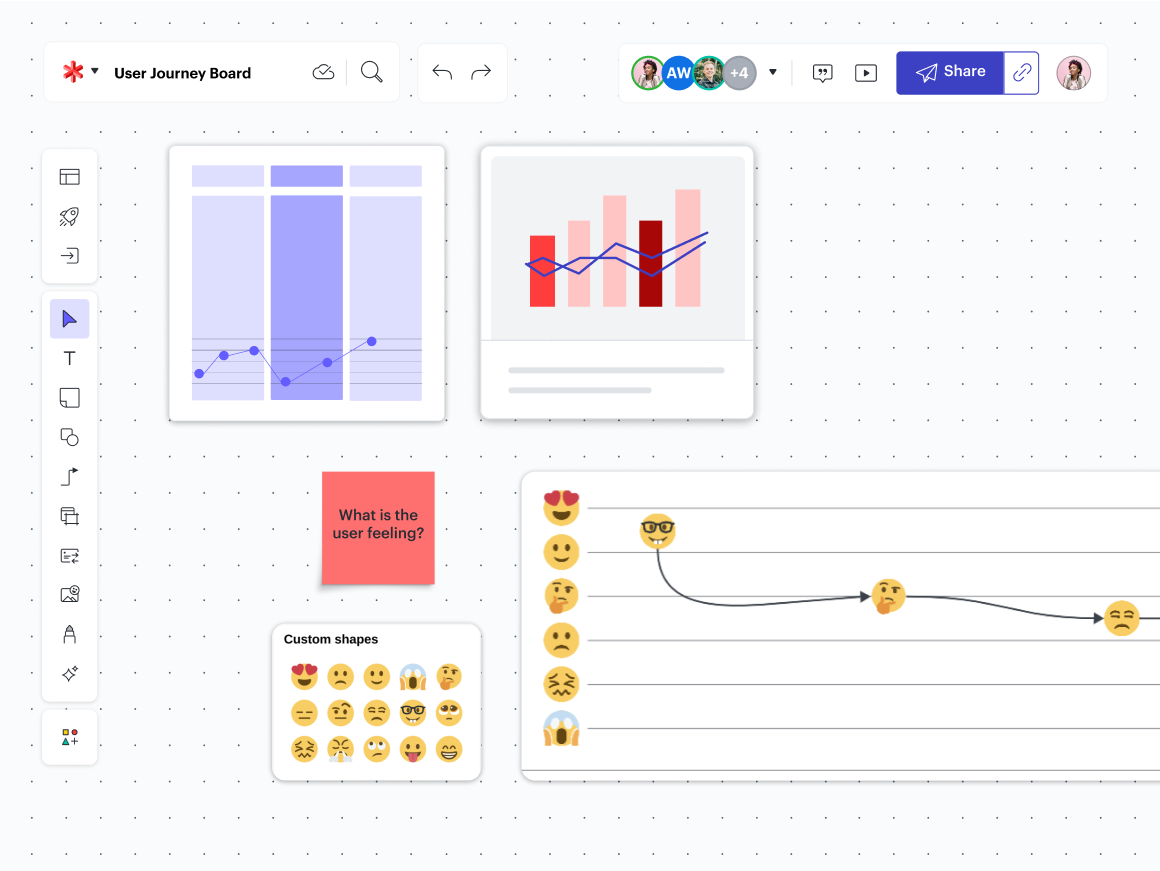
I use Lucid to create a research synthesis board because I’m able to include both types of data, showing qualitative customer insights and quantitative analysis all in one place. I can present a summarization of my customer interviews while including graphs and charts of quantitative data that inform my recommendations. Stakeholders can easily see actionable steps to take to improve the customer experience and why.
Then I’m able to use airfocus’s integration with Lucid to embed this research synthesis board into my airfocus initiative. That way, I keep my research with me as I continue to work and plan in airfocus. Thanks to the integration, my summary document isn't reviewed once and forgotten; I continue to have it at hand to help guide decisions as the project unfolds.
Together, Lucid and airfocus make it easy to leverage my quantitative and qualitative research to make successful product decisions.
Brainstorming and prioritizing next steps
When it comes to brainstorming which features to focus on next, my team uses Visual Activities in Lucid. Lucid is great for brainstorming lots of feature ideas quickly with my team, then a visual activity helps us do a quick initial filter to determine the best ones.
We like the impact and effort matrix, filling it out based on the research we get from users and our data. The whole team is equipped with the right information to make informed decisions about impact and effort. By using this activity, we collectively agree on features that are both important to customers and achievable for our team. This way, leaders are also confident in how we have prioritized, because they know our decisions are based on data and research.
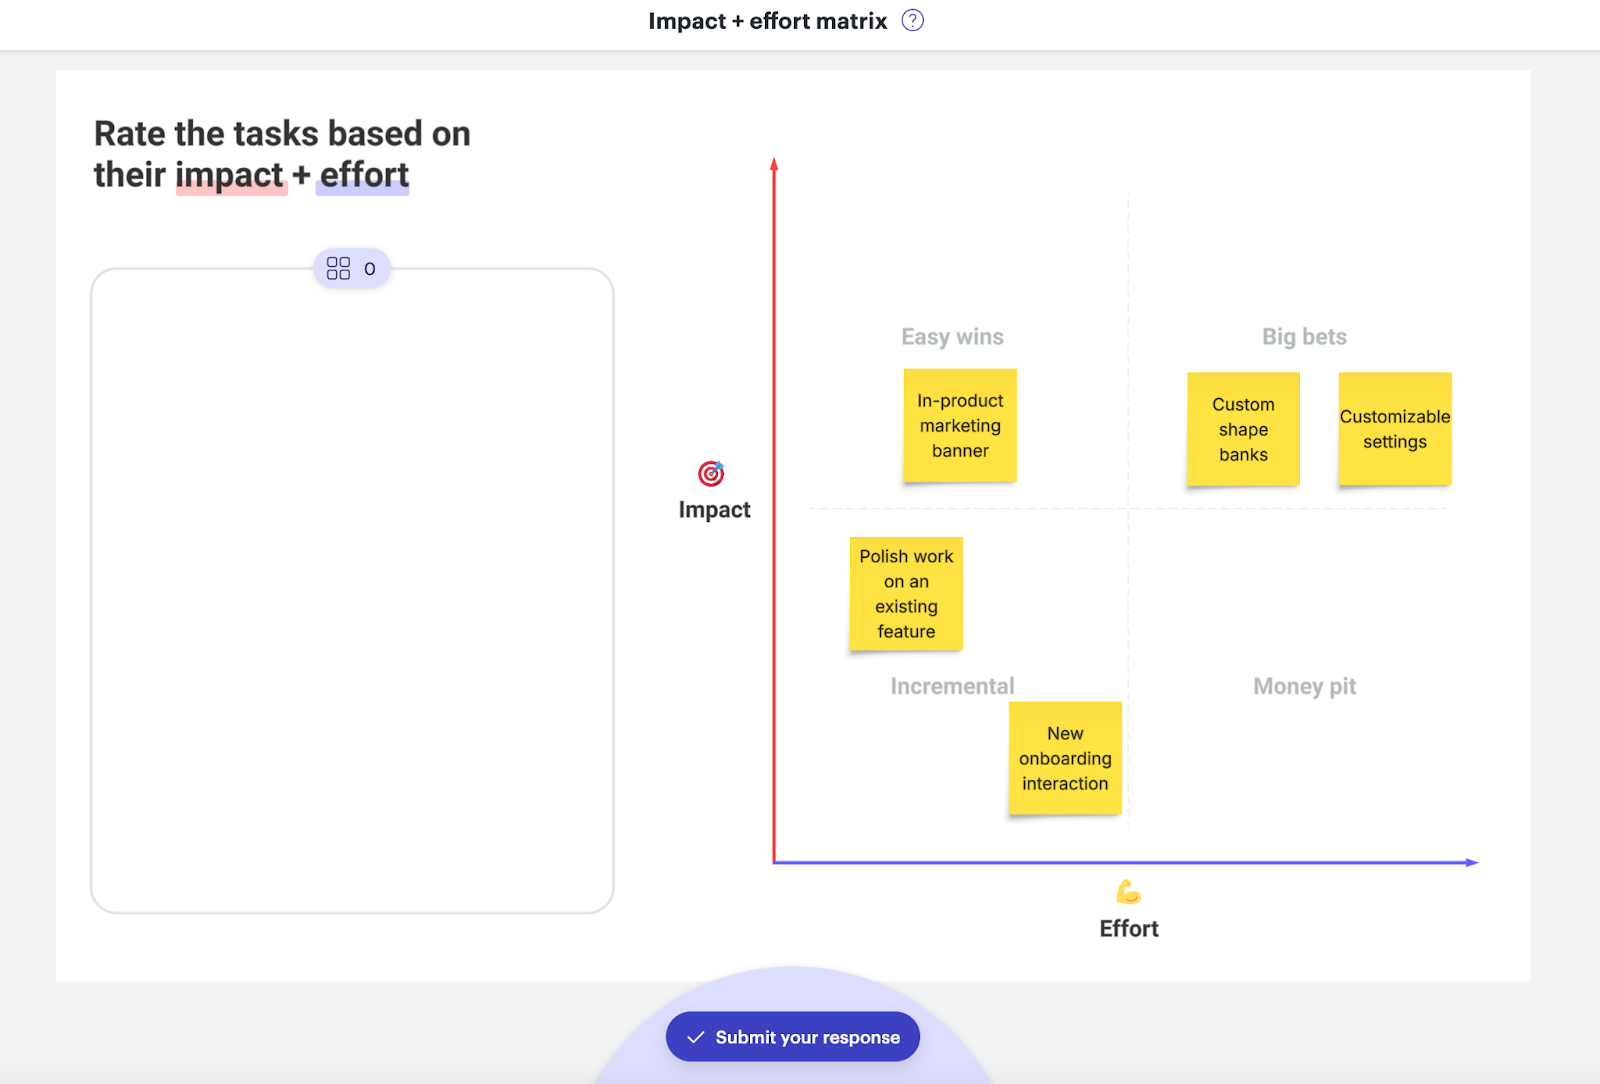
Once my team has brainstormed and done a visual activity in Lucid, we send our top ideas to airfocus as new items via the integration. In airfocus, we can formally prioritize ideas by using a rigorous prioritization framework like RICE or ICE. The airfocus Priority Ratings application is particularly helpful for making strategic decisions on which potential features to prioritize.
Then, the next step is to turn all of my research and work into deliverables.
Transforming user research into deliverables
With Lucid and airfocus, I have everything I need to visualize my user research and develop insights that I can share with my team, leadership, or stakeholders. For the next step in user research, I use Lucid to create user journey maps and research readouts, and I use airfocus to develop product roadmaps that communicate our overall strategy.
Research readouts
When I need to create a presentation of my user research to help inform strategic decision-making on our product, I create a research readout in Lucid. It provides a high-level overview of my research goals, the user journey, pain points, gaps, and solutions. A research readout is a great way to deliver my research synthesis to stakeholders with recommendations for next steps.
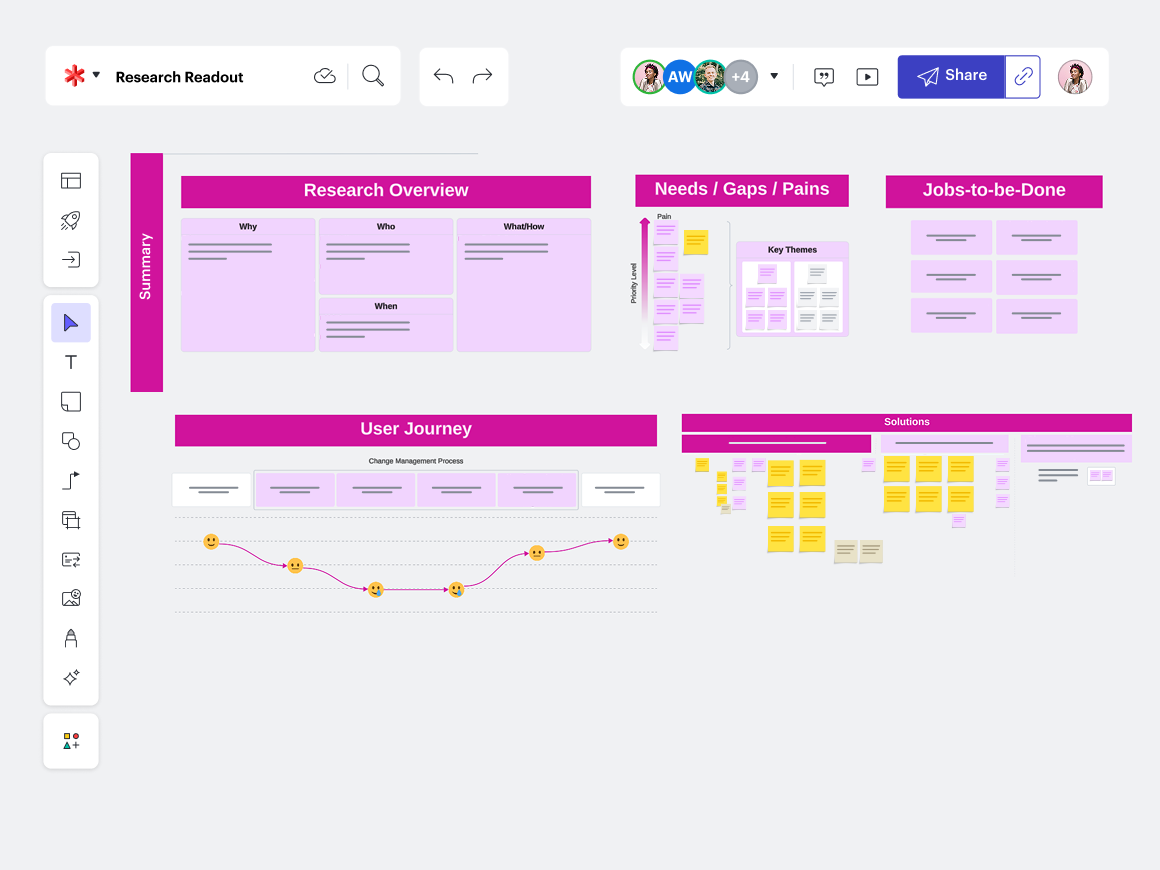
In Lucid, I can add an agenda to guide the discussion and clearly communicate the goals of my presentation. As I share my research, people can leave sticky notes on the board to ask questions or provide feedback. I’m also able to split my readout into two parts: a very high-level summary and a more detailed deep dive. By including everything on one board, stakeholders have all the context they need to understand the solutions I’m proposing and why.
Sometimes my research readouts are informal asynchronous reviews, but when I need to do a formal presentation, the Paths feature in Lucid makes it really easy for me. With Paths, I can present my research in a specific order as stakeholders add real-time feedback that I can address as I’m presenting. There’s no need to spend any extra time building out presentation slides in a different tool.
The main purpose of a research readout is to get everyone aligned on what we’re learning and what the best path forward might be. In Lucid, I can seamlessly guide viewers through my research, ultimately ensuring alignment on my findings so we can make data-informed product decisions.
User journey mapping
With a customer journey map, I can develop insights based on the data I’ve gathered and find data-driven solutions to make features better for customers. In Lucid, it’s easy to break down how exactly customers are using our product and visualize their journey; I can get started with a user journey map template or quickly create my own map.
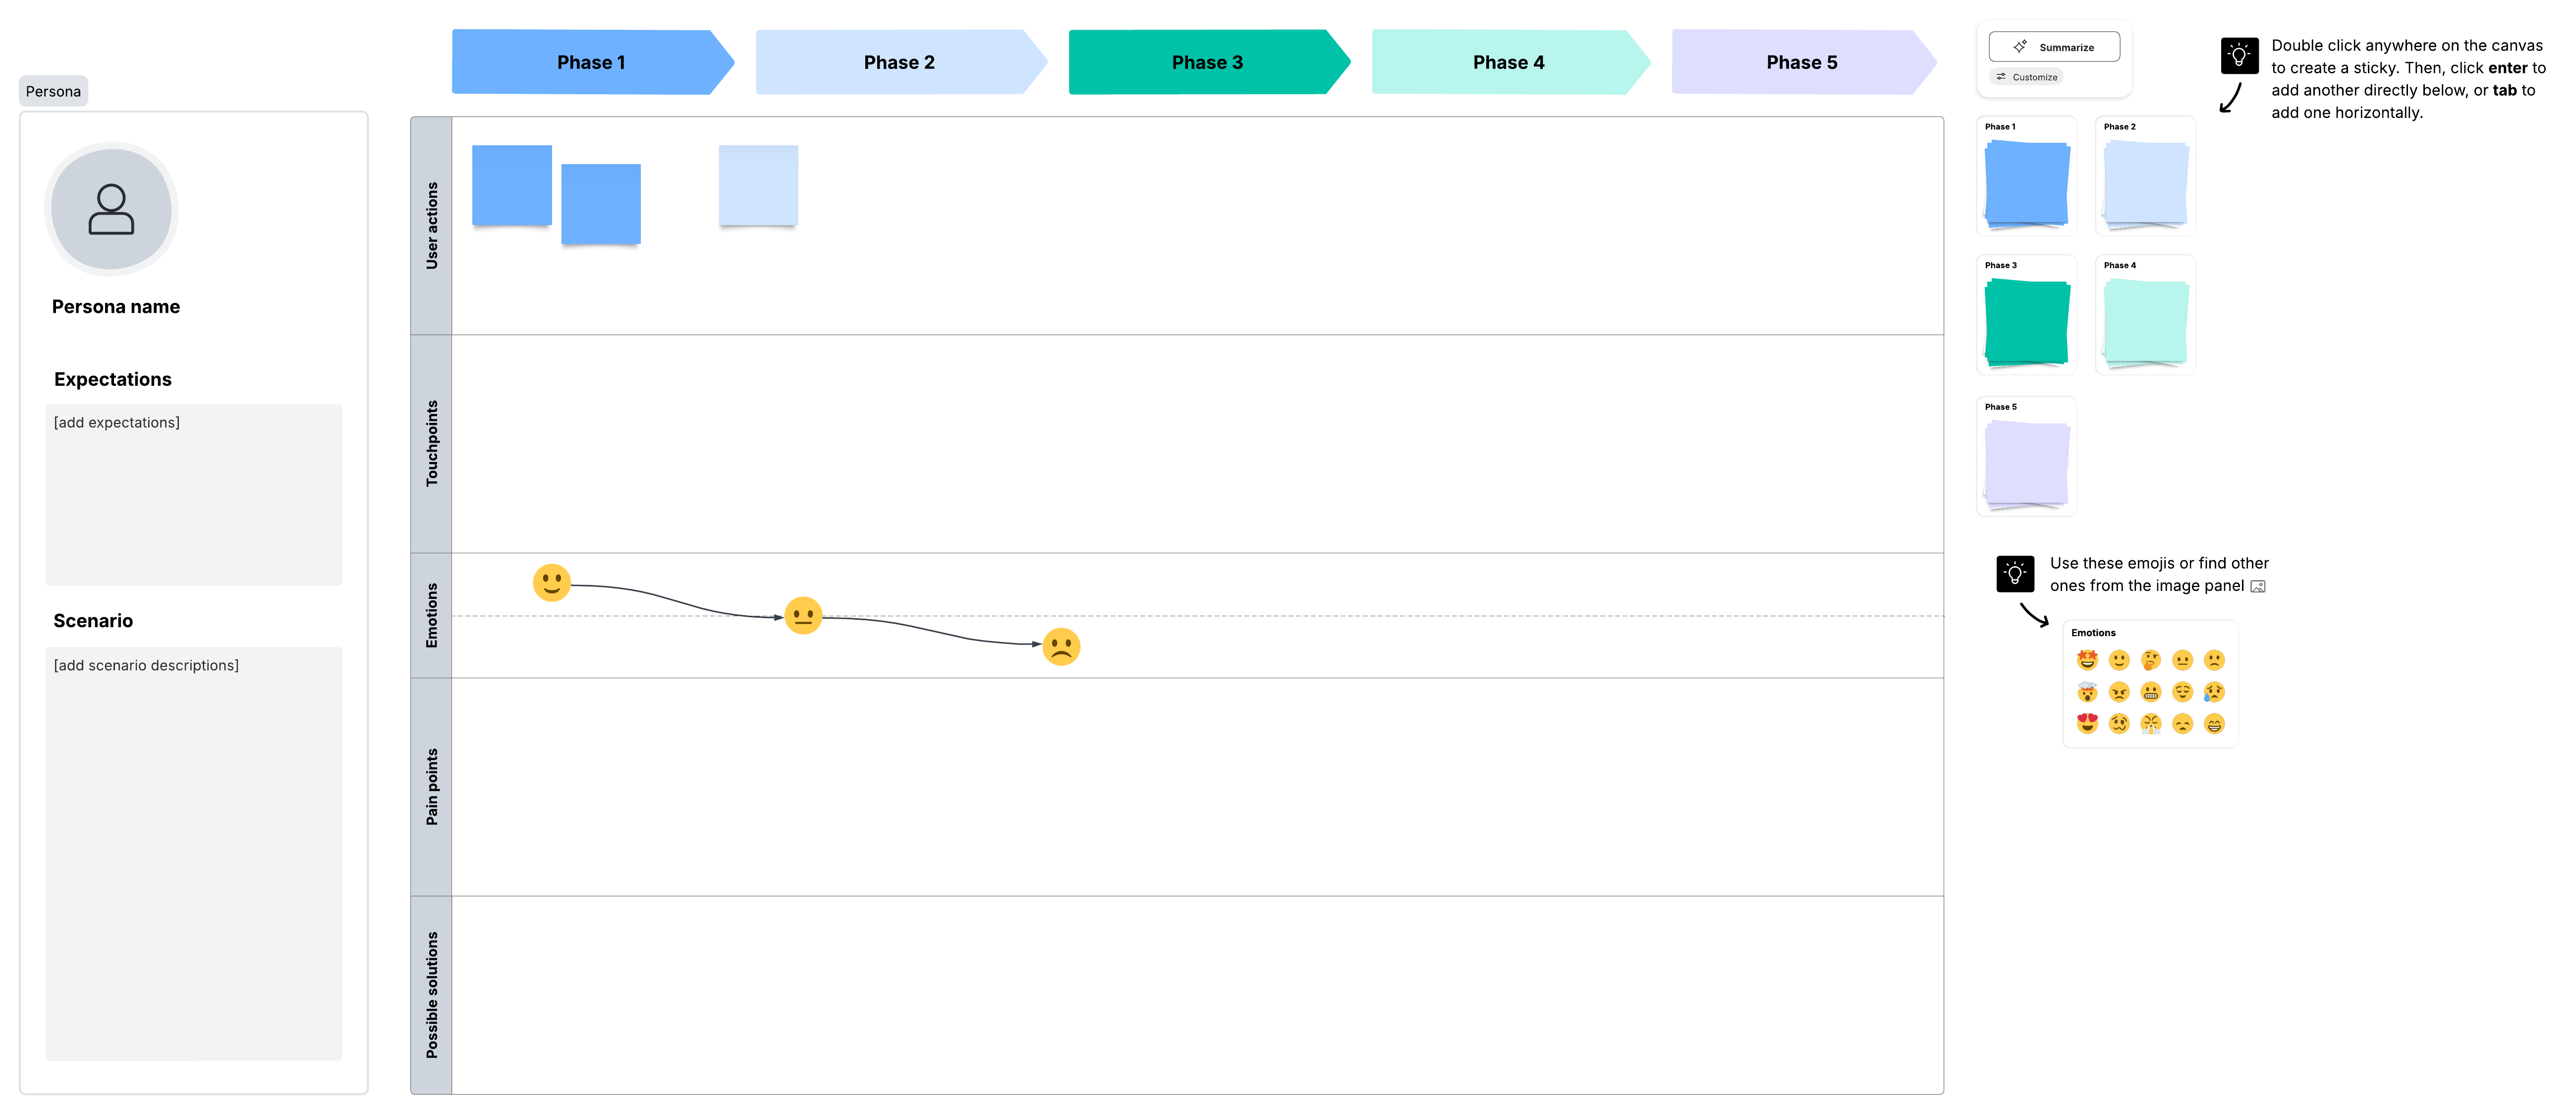
My research really informs how we’re able to understand and visualize the user experience. Sometimes I include a user journey map in my research readout to showcase the user experience to stakeholders. Emotions are a common section of user journey maps, and in Lucid, my team created a custom shape library of emojis to portray a customer’s emotions—from delight to frustration—as they use a specific feature of our product.
What’s remarkable is that with Lucid, I can have everything on the same board: the journey map that visualizes the customers’ experience, graphs, customer quotes, screenshots, formulas, and more. Having all of this in one place creates a valuable record of the decisions we’ve made and how we reached those decisions.
Product roadmaps
The research I conduct ultimately informs what product roadmaps look like. It’s easy to use airfocus for product roadmapping, where I can showcase our product vision with tailored views of a single roadmap for different audiences.
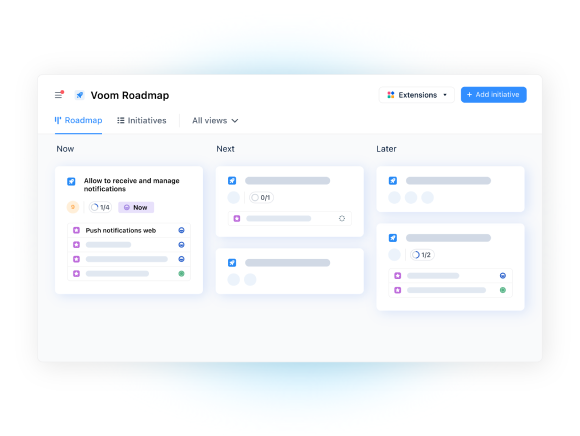
The roadmap that my team will use, for example, is really detailed, while a more high-level one, like an outcome-based roadmap, is better for stakeholders. In airfocus, I can also map dependencies and use timeline view to visualize milestones. These features make it easy to turn my research into easy-to-understand roadmaps that showcase our product strategy in one place. And, with airfocus Portal, I can share my roadmaps right from my workspace.
Benefits of using Lucid and airfocus for user research
Before Lucid and airfocus, I was using tedious, manual methods to maintain, consolidate, and share my research. Using Lucid and airfocus combined has transformed how I conduct user research by:
-
Allowing me to synthesize my research quickly and organize it in a visual way.
-
Making it easier to collaborate and present my findings, driving decision-making with my teammates and stakeholders.
-
Supporting my research from end to end, from understanding customer pain points to prioritizing which features we will build next to solve them.
My work is now more streamlined, organized, and collaborative, ultimately helping me deliver a higher-value experience to our customers.
Learn more about our solutions for product innovation
Visualize and synthesize your user research as you enhance collaboration with Lucid.
Check it outAbout the author

Aubrey Matthias, product manager I, has been at Lucid for four years and on the product team for two. She is passionate about solving complex user problems by delivering delightful product experiences that provide frictionless value to users’ day-to-day lives. Outside of work, her interests include sewing, crocheting, weightlighting, camping, being spontaneous, and trying new things.
About Lucid
Lucid Software is the leader in visual collaboration and work acceleration, helping teams see and build the future by turning ideas into reality. Its products include the Lucid Visual Collaboration Suite (Lucidchart and Lucidspark) and airfocus. The Lucid Visual Collaboration Suite, combined with powerful accelerators for business agility, cloud, and process transformation, empowers organizations to streamline work, foster alignment, and drive business transformation at scale. airfocus, an AI-powered product management and roadmapping platform, extends these capabilities by helping teams prioritize work, define product strategy, and align execution with business goals. The most used work acceleration platform by the Fortune 500, Lucid's solutions are trusted by more than 100 million users across enterprises worldwide, including Google, GE, and NBC Universal. Lucid partners with leaders such as Google, Atlassian, and Microsoft, and has received numerous awards for its products, growth, and workplace culture.
Related articles
How I use airfocus and Lucid for product roadmapping
See how a product manager at Lucid uses Lucid and airfocus to increase collaboration, clarity, and alignment during product roadmapping.
How Lucid’s product and UX teams use Lucid to drive innovation
Discover how Lucid’s own product and UX teams use Lucid to keep us on the cutting-edge of the technical industry.
The product designer’s toolkit for simplified documentation
In this article, we've compiled a toolkit of templates for common product designers' use cases.
Bring your bright ideas to life.
By registering, you agree to our Terms of Service and you acknowledge that you have read and understand our Privacy Policy.