
The operations team’s toolkit for effortless documentation
Reading time: about 7 min
Topics:
Jump to:
Keeping an operations department running efficiently requires lots of documentation. Teams often need to create process diagrams, flowcharts, org charts, onboarding and training documents, project management dashboards, and more. However, traditional documentation doesn’t meet the needs of modern operations teams. Static documentation is highly manual, isn’t visual, often isn’t centralized, and doesn’t update in real time. This can make it cumbersome, confusing, and less useful for operations leaders and their teams.
That’s where Lucid can help.
Lucid delivers a visually collaborative environment where you can leverage the power of a virtual whiteboard and intelligent diagramming software in one single platform (and even on the same canvas). Using Lucid, operations teams can collaborate both asynchronously and synchronously, visualize complex concepts and relationships, and link data directly to Lucid documents to provide real-time insights into operations.
When documentation is so essential to your workflows, it can be overwhelming to know where to start. That’s why we’ve put together this toolkit of operations templates to help you.
Templates for process improvement
Processes, systems, and policies are the backbone of operations’ workflows, making documentation a daily priority.
Another reason process documentation is so critical? It drives innovation. Documentation helps record successful practices, breakdown inefficient processes, identify bottlenecks, and find areas for improvement. Employees don’t have to worry about the steps to follow because they’re already documented.

How Delta Airlines uses Lucid
Learn how Delta Airlines documents and improves their processes with Lucid
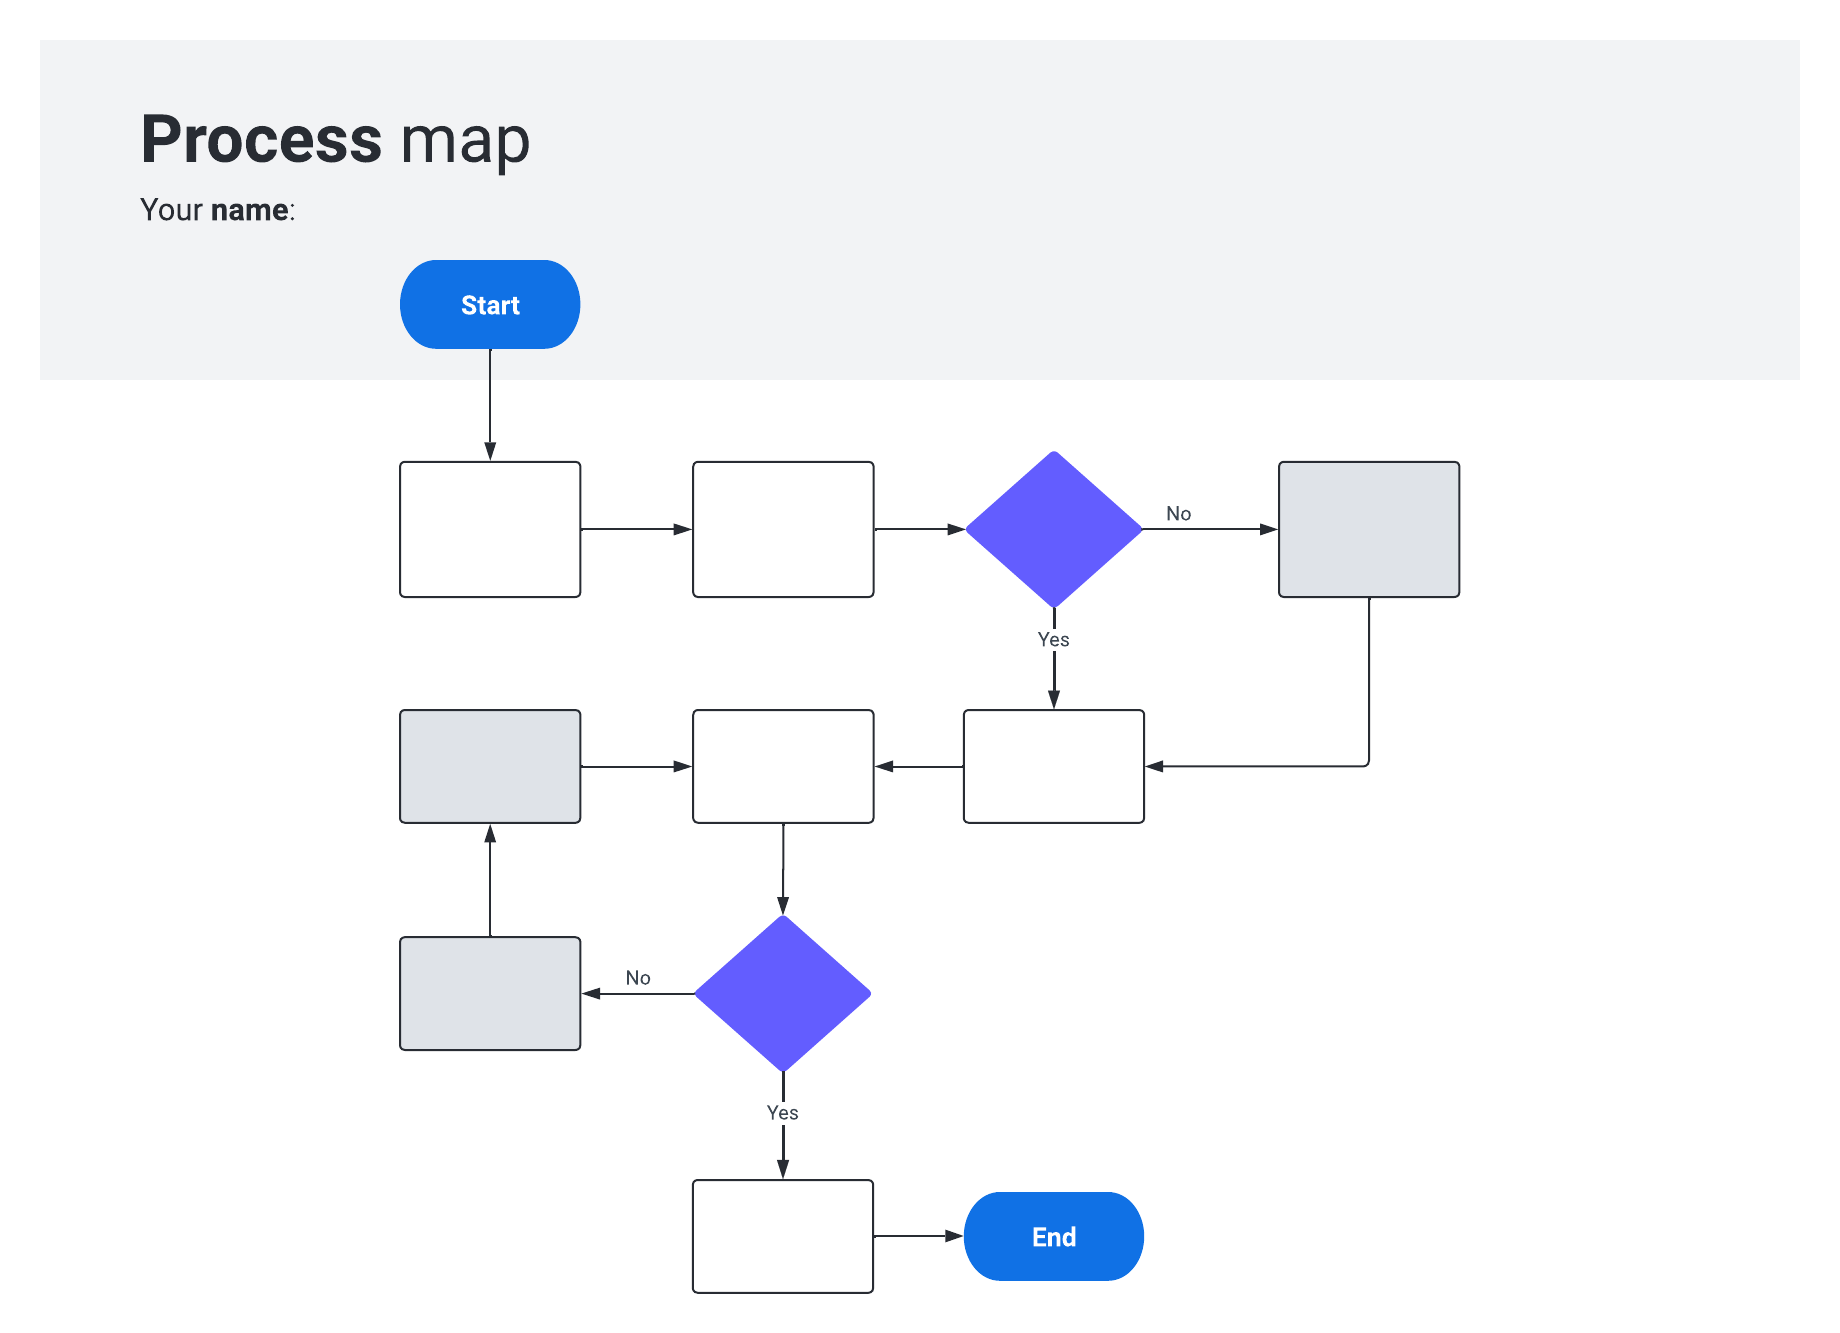
Read moreProcess map
Easily visualize your business processes with this process map template. Map the flow of work, and who is involved at each step so you can quickly uncover key opportunities for improvement, clarify roles, and get everyone on the same page.
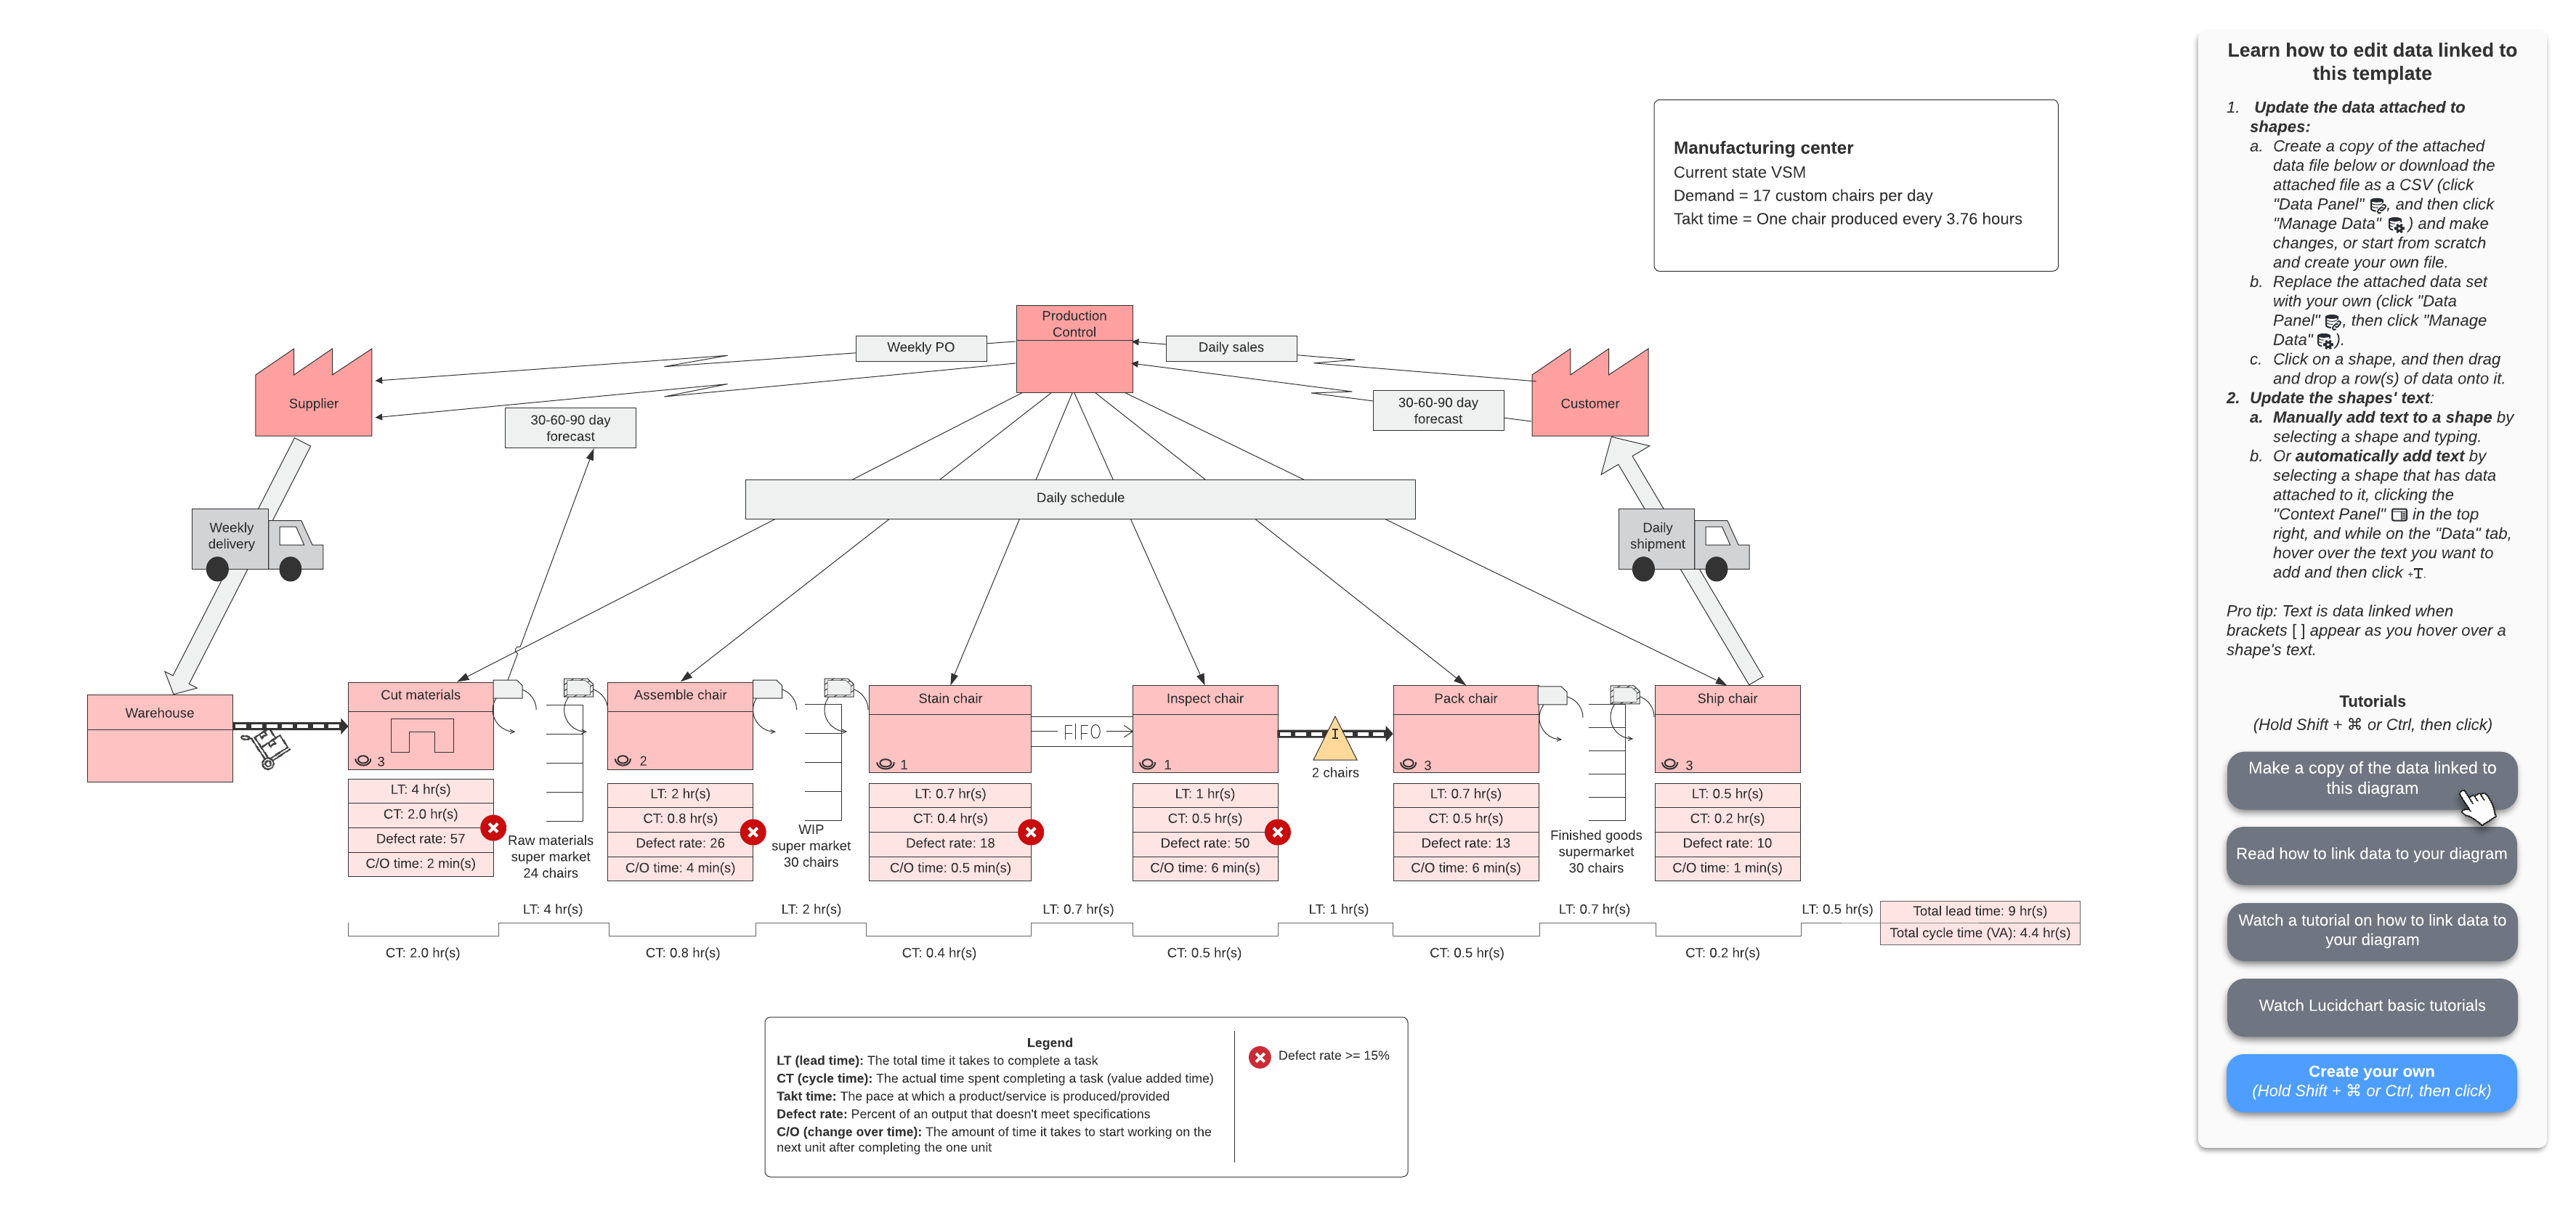
Value stream map
Use this value stream map to illustrate, analyze, and improve the steps involved in delivering a product or service. With Lucid’s extensive shape library and color coding you can simplify and clarify complex processes.
Templates for strategic planning
Whether in a formal meeting or asynchronously, operations teams look for ways to make strategic planning sessions more efficient. How can teams save time and clarify concepts while improving collaboration? By visualizing and creating planning documentation in Lucid.
Lucid’s strategic planning templates centralize that documentation and enable teams to collaborate, brainstorm, and strategize in one place—even if the team is spread across locations or time zones.
Strategic planning
With this strategic planning template, teams can align on the big picture and document plans to achieve goals. Fill in the problems you want to solve, your goals or priorities, your current team capabilities, and the actions you need to take to meet those objectives. Lucid lets you work together in real-time or asynchronously, making it easy to get everyone’s input.

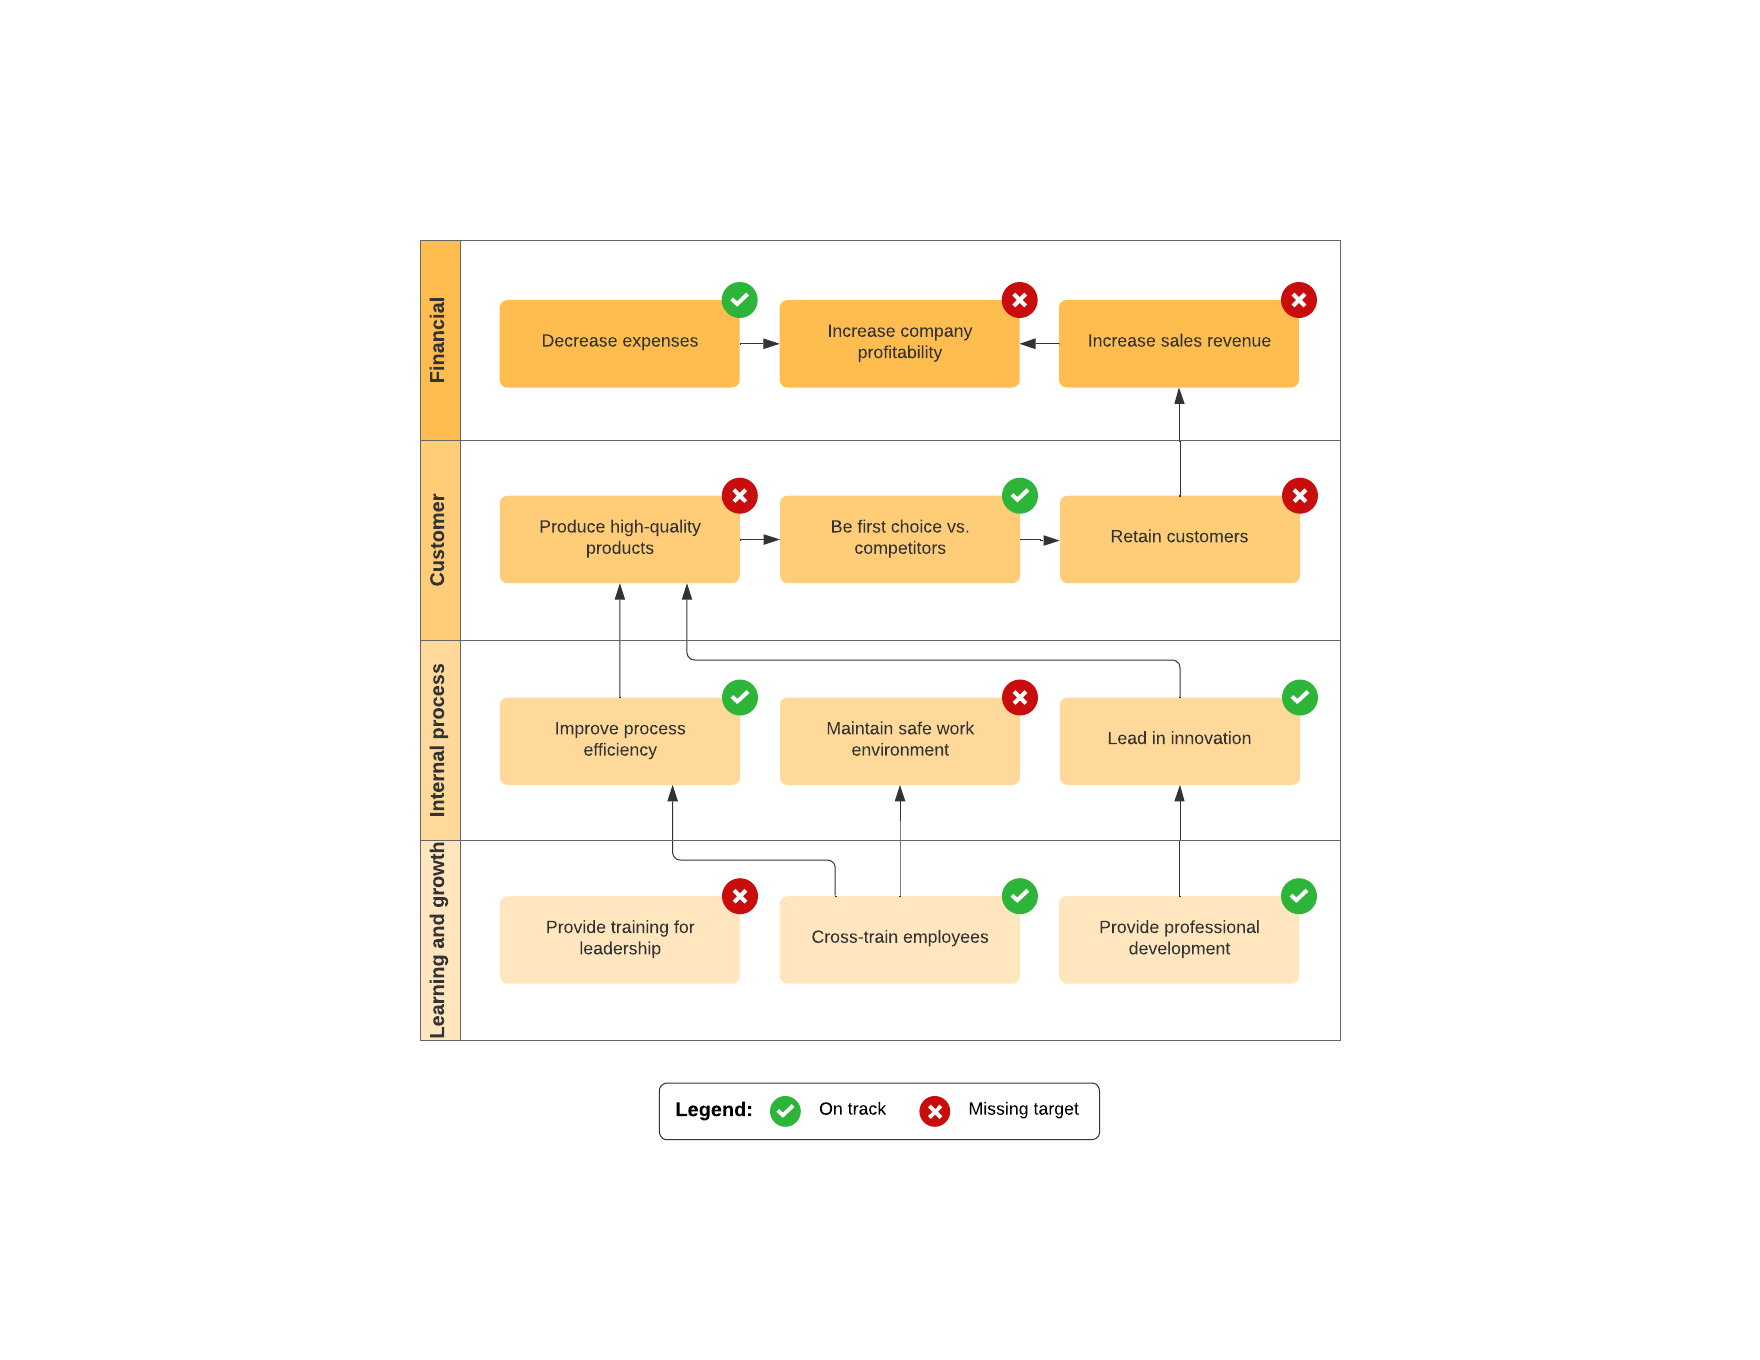
Strategy map
Visualize your strategic goals and how they intersect across the organization with a strategy map. Organize goals by team or department with swimlanes, show connections between goals with arrows, and track progress on your goals with regular updates.
Templates for project management
Project management templates can help project managers stay on top of critical initiatives in a visual, easily digestible format.
With these Lucid templates, you can streamline project collaboration, facilitate communication between stakeholders, and manage cross-functional teams and departments.
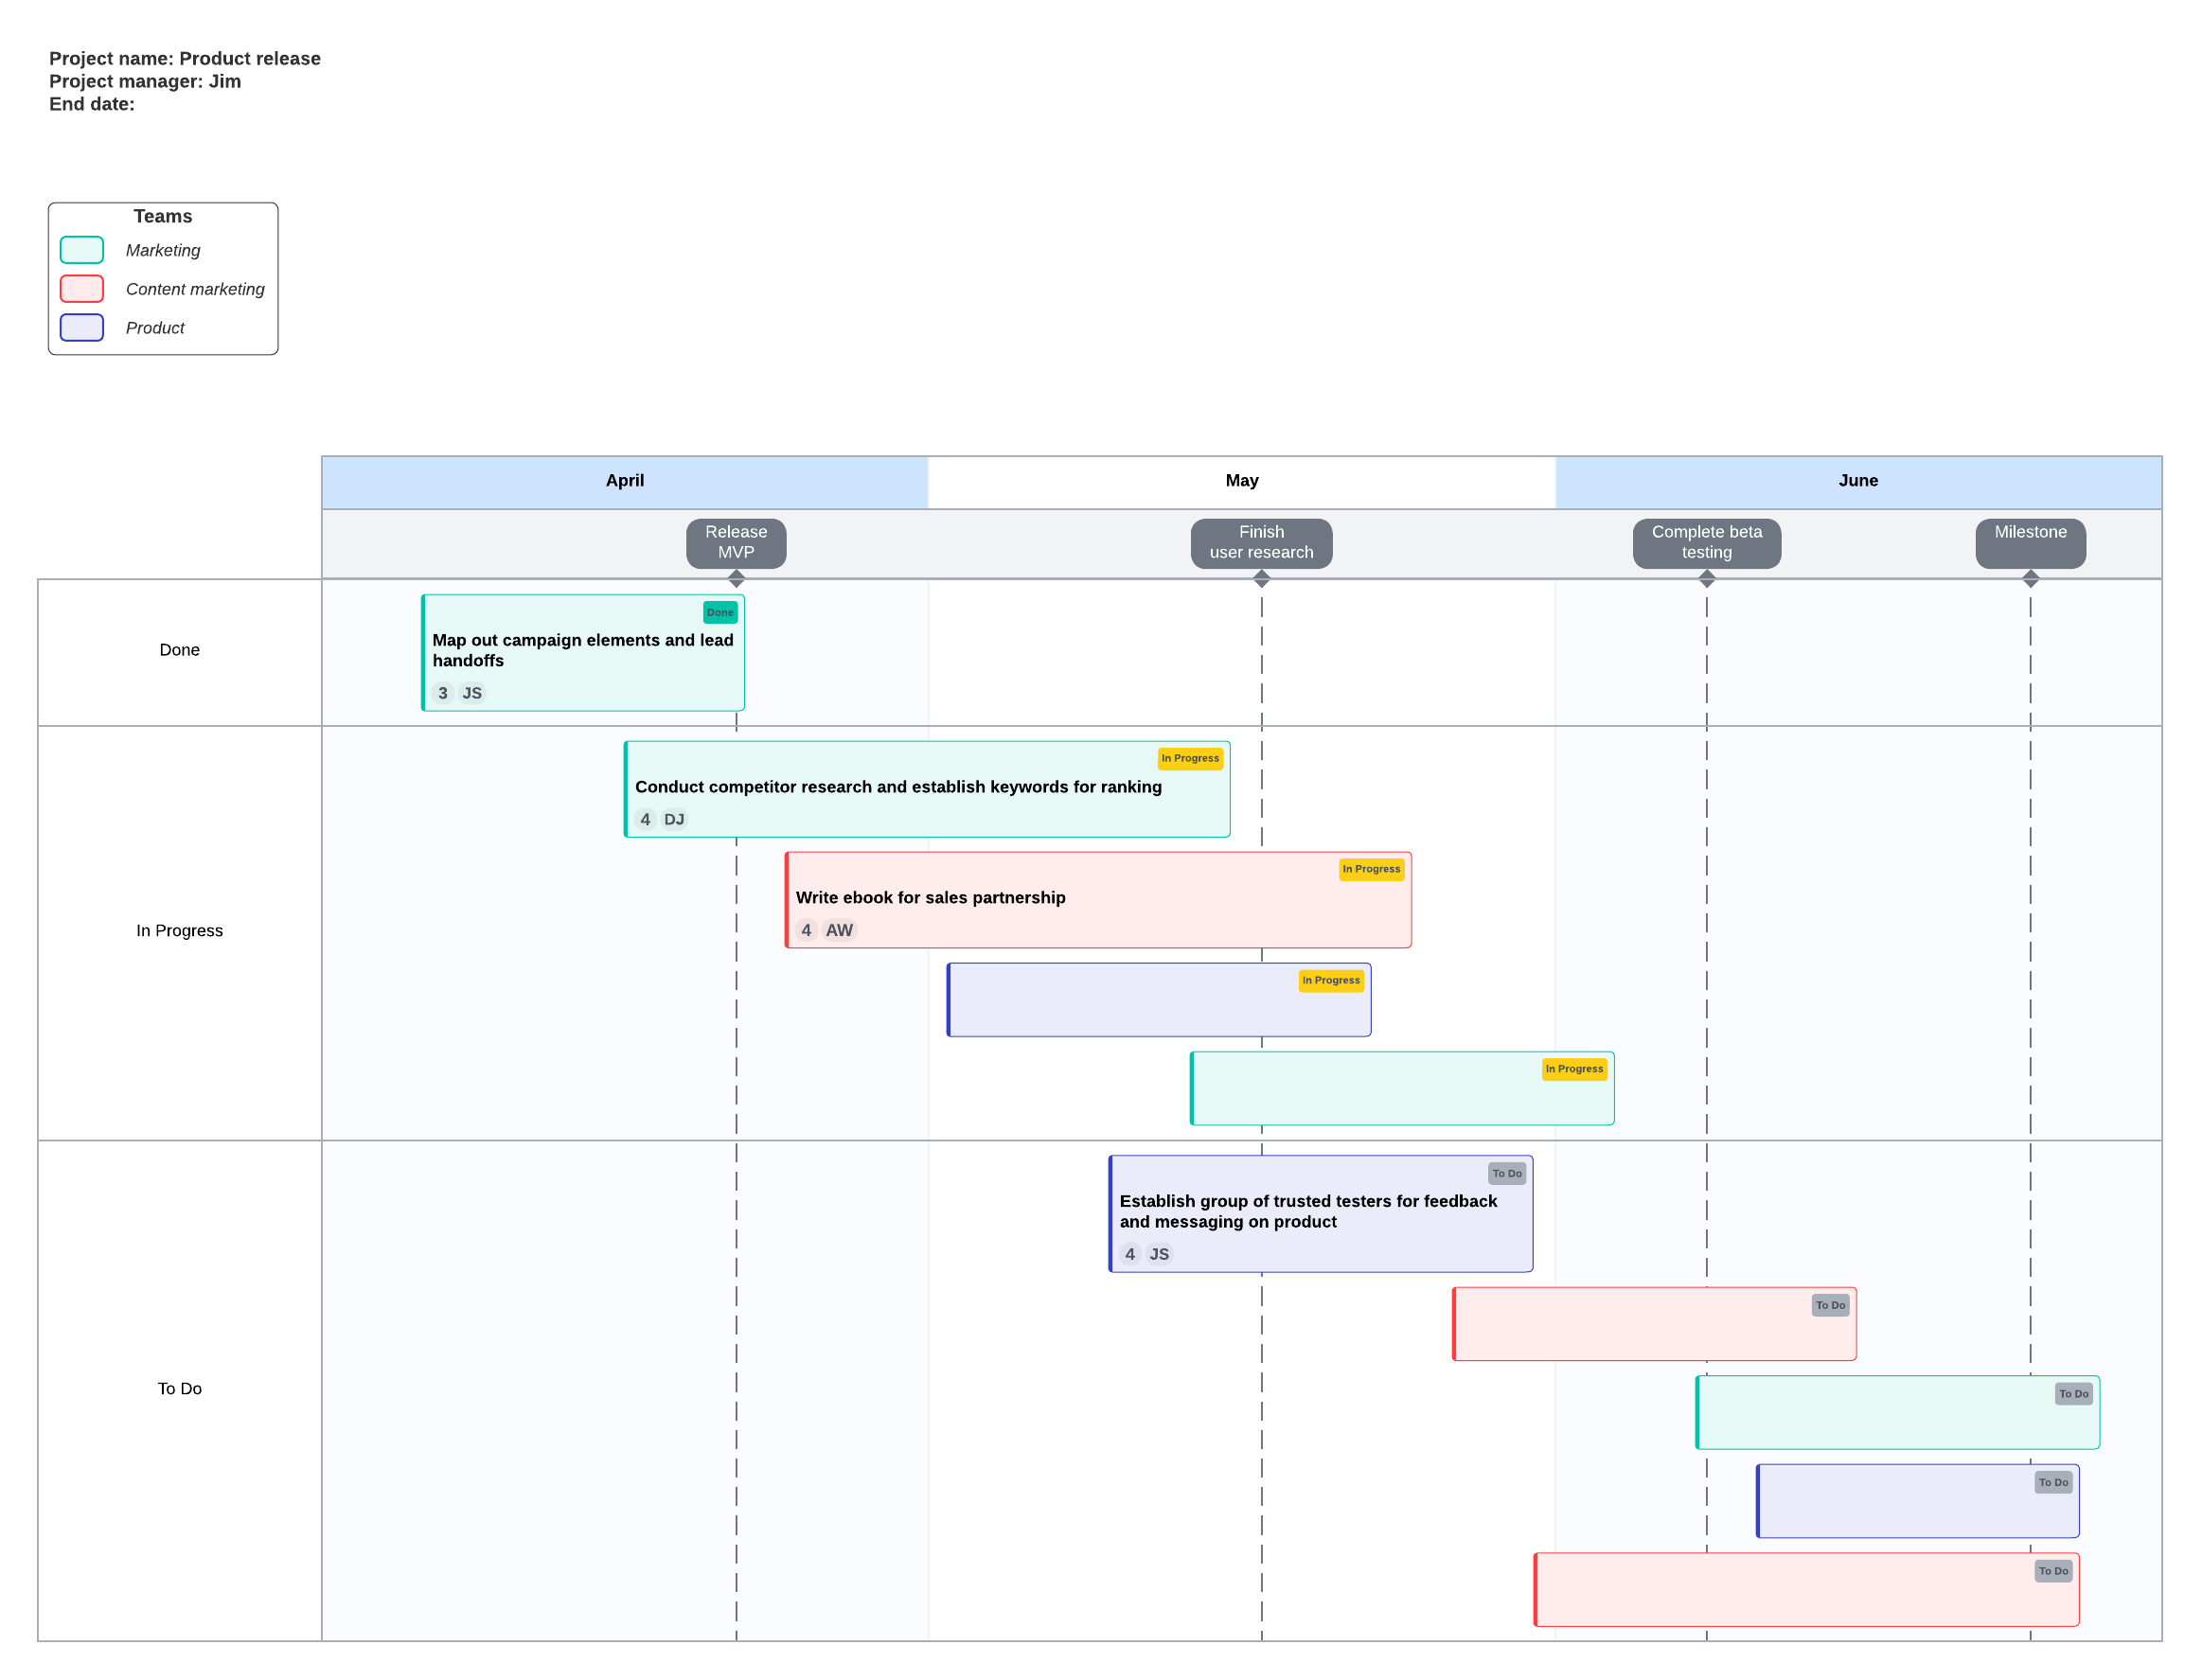
Project timeline
Keep your teams on track with a dynamic project timeline. Document tasks, assign roles, track progress. Organized project timelines ensure smoother handoffs, better communication, and stronger team alignment from start to finish.
Stakeholder map
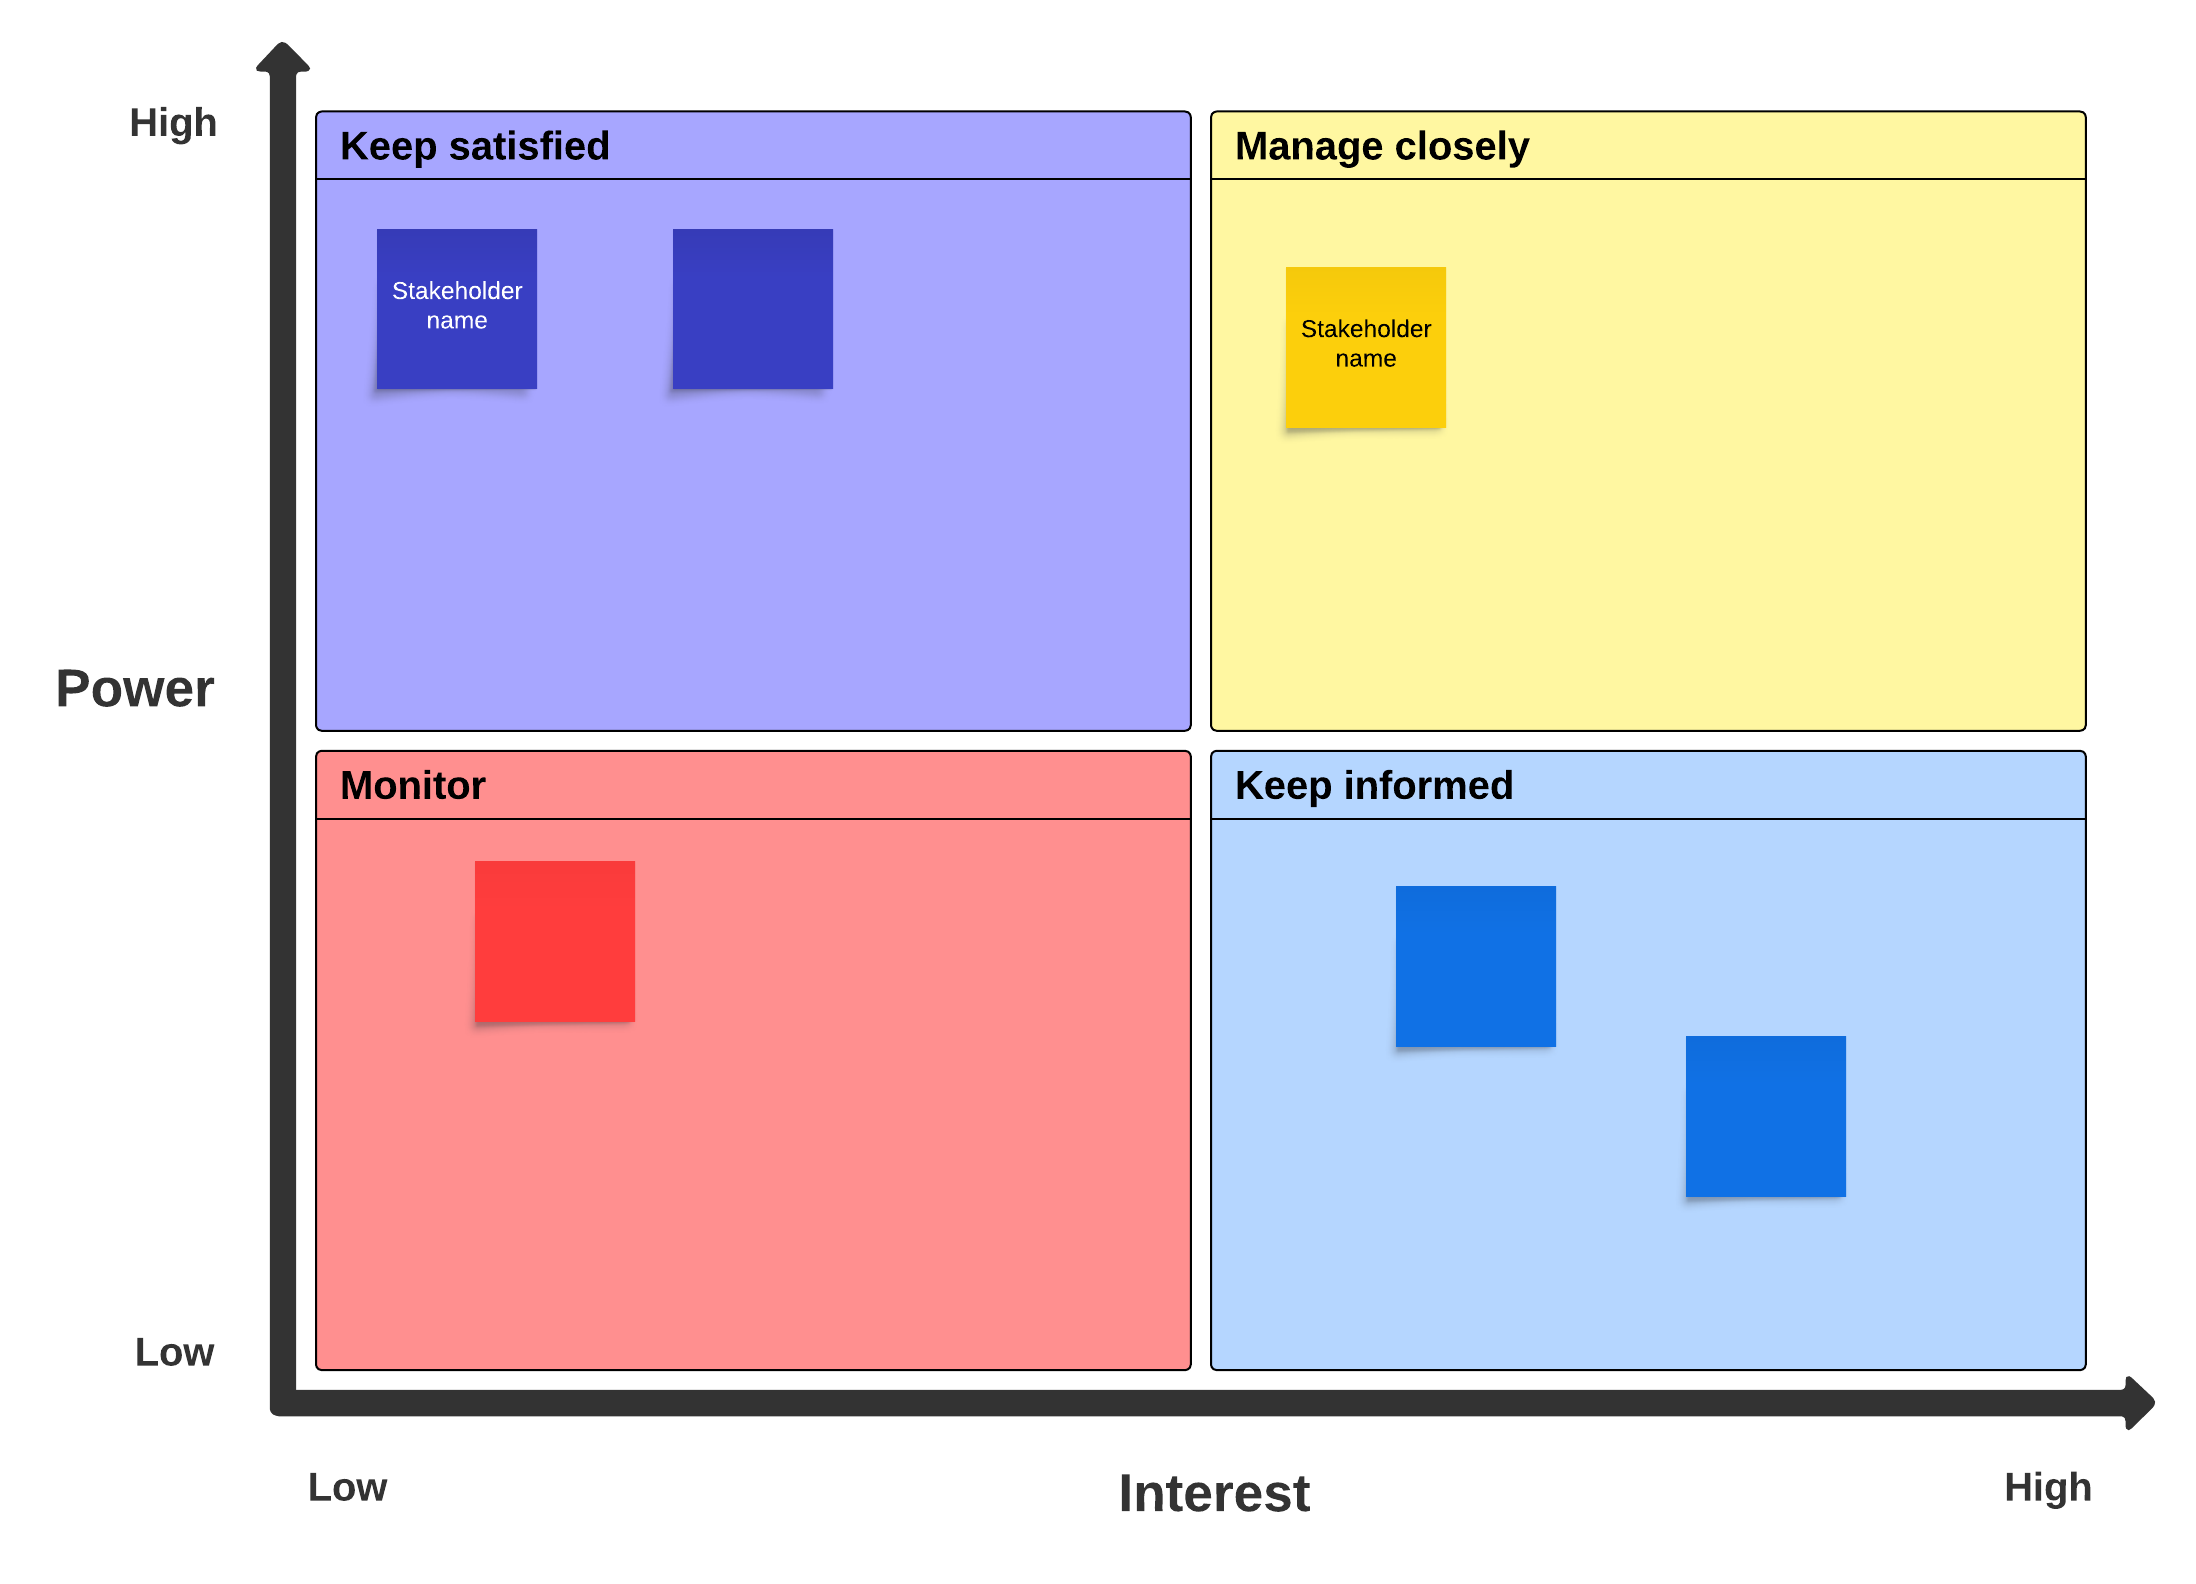
Keeping operations running smoothly means making sure all stakeholders are accounted for and aligned. Use this stakeholder map template to document your project stakeholders and organize them based on their level of interest and influence. Use sticky notes to add names to the right category and draw lines or shapes to indicate key relationships or connections.
Weekly project status report
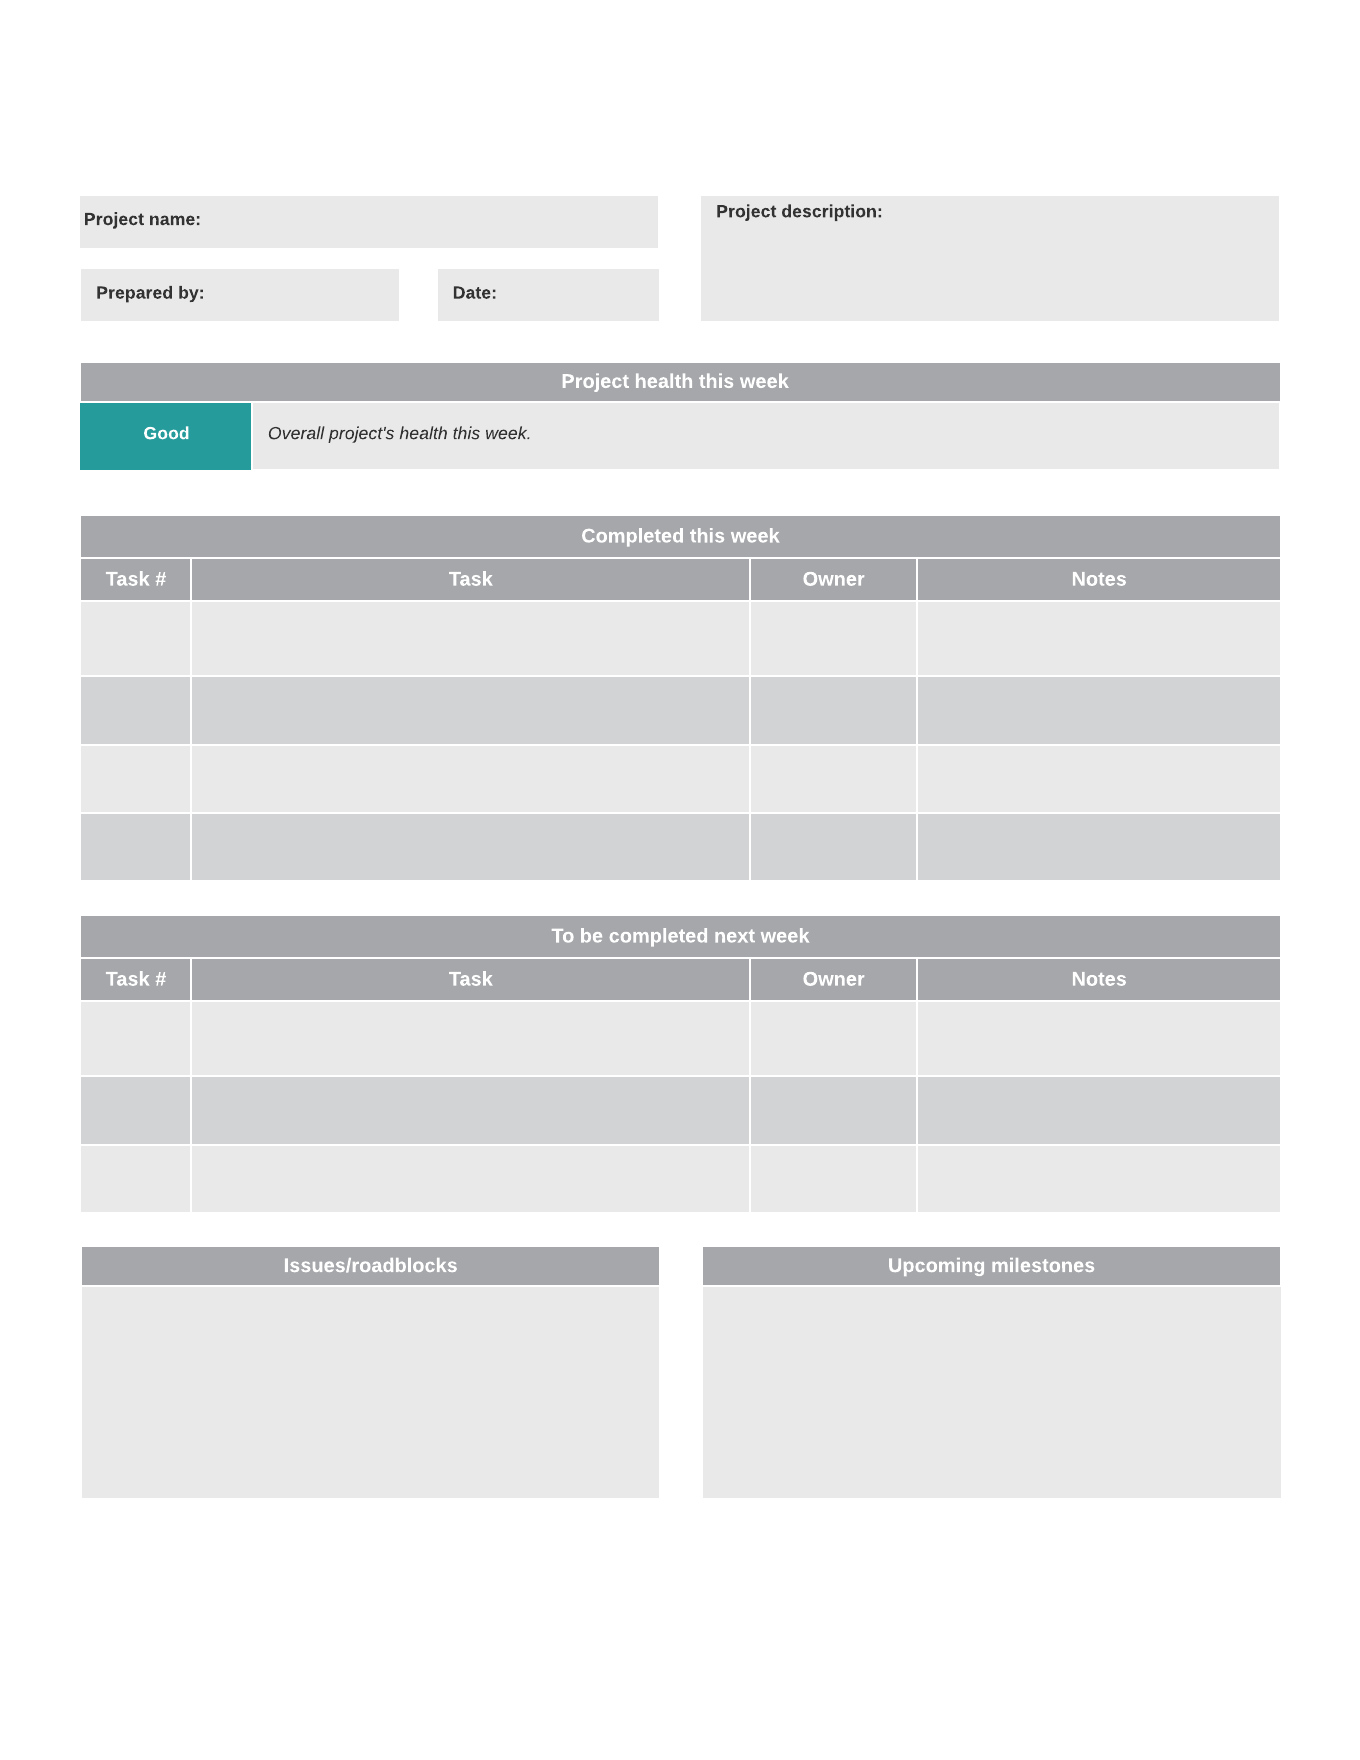
Documentation is all about communication. Keep your communication clear with weekly status reports that team members and other stakeholders can access and add to. Use this template to share what tasks were completed and what work still needs to be done, plus any priorities or key challenges to prepare for.
Project task board
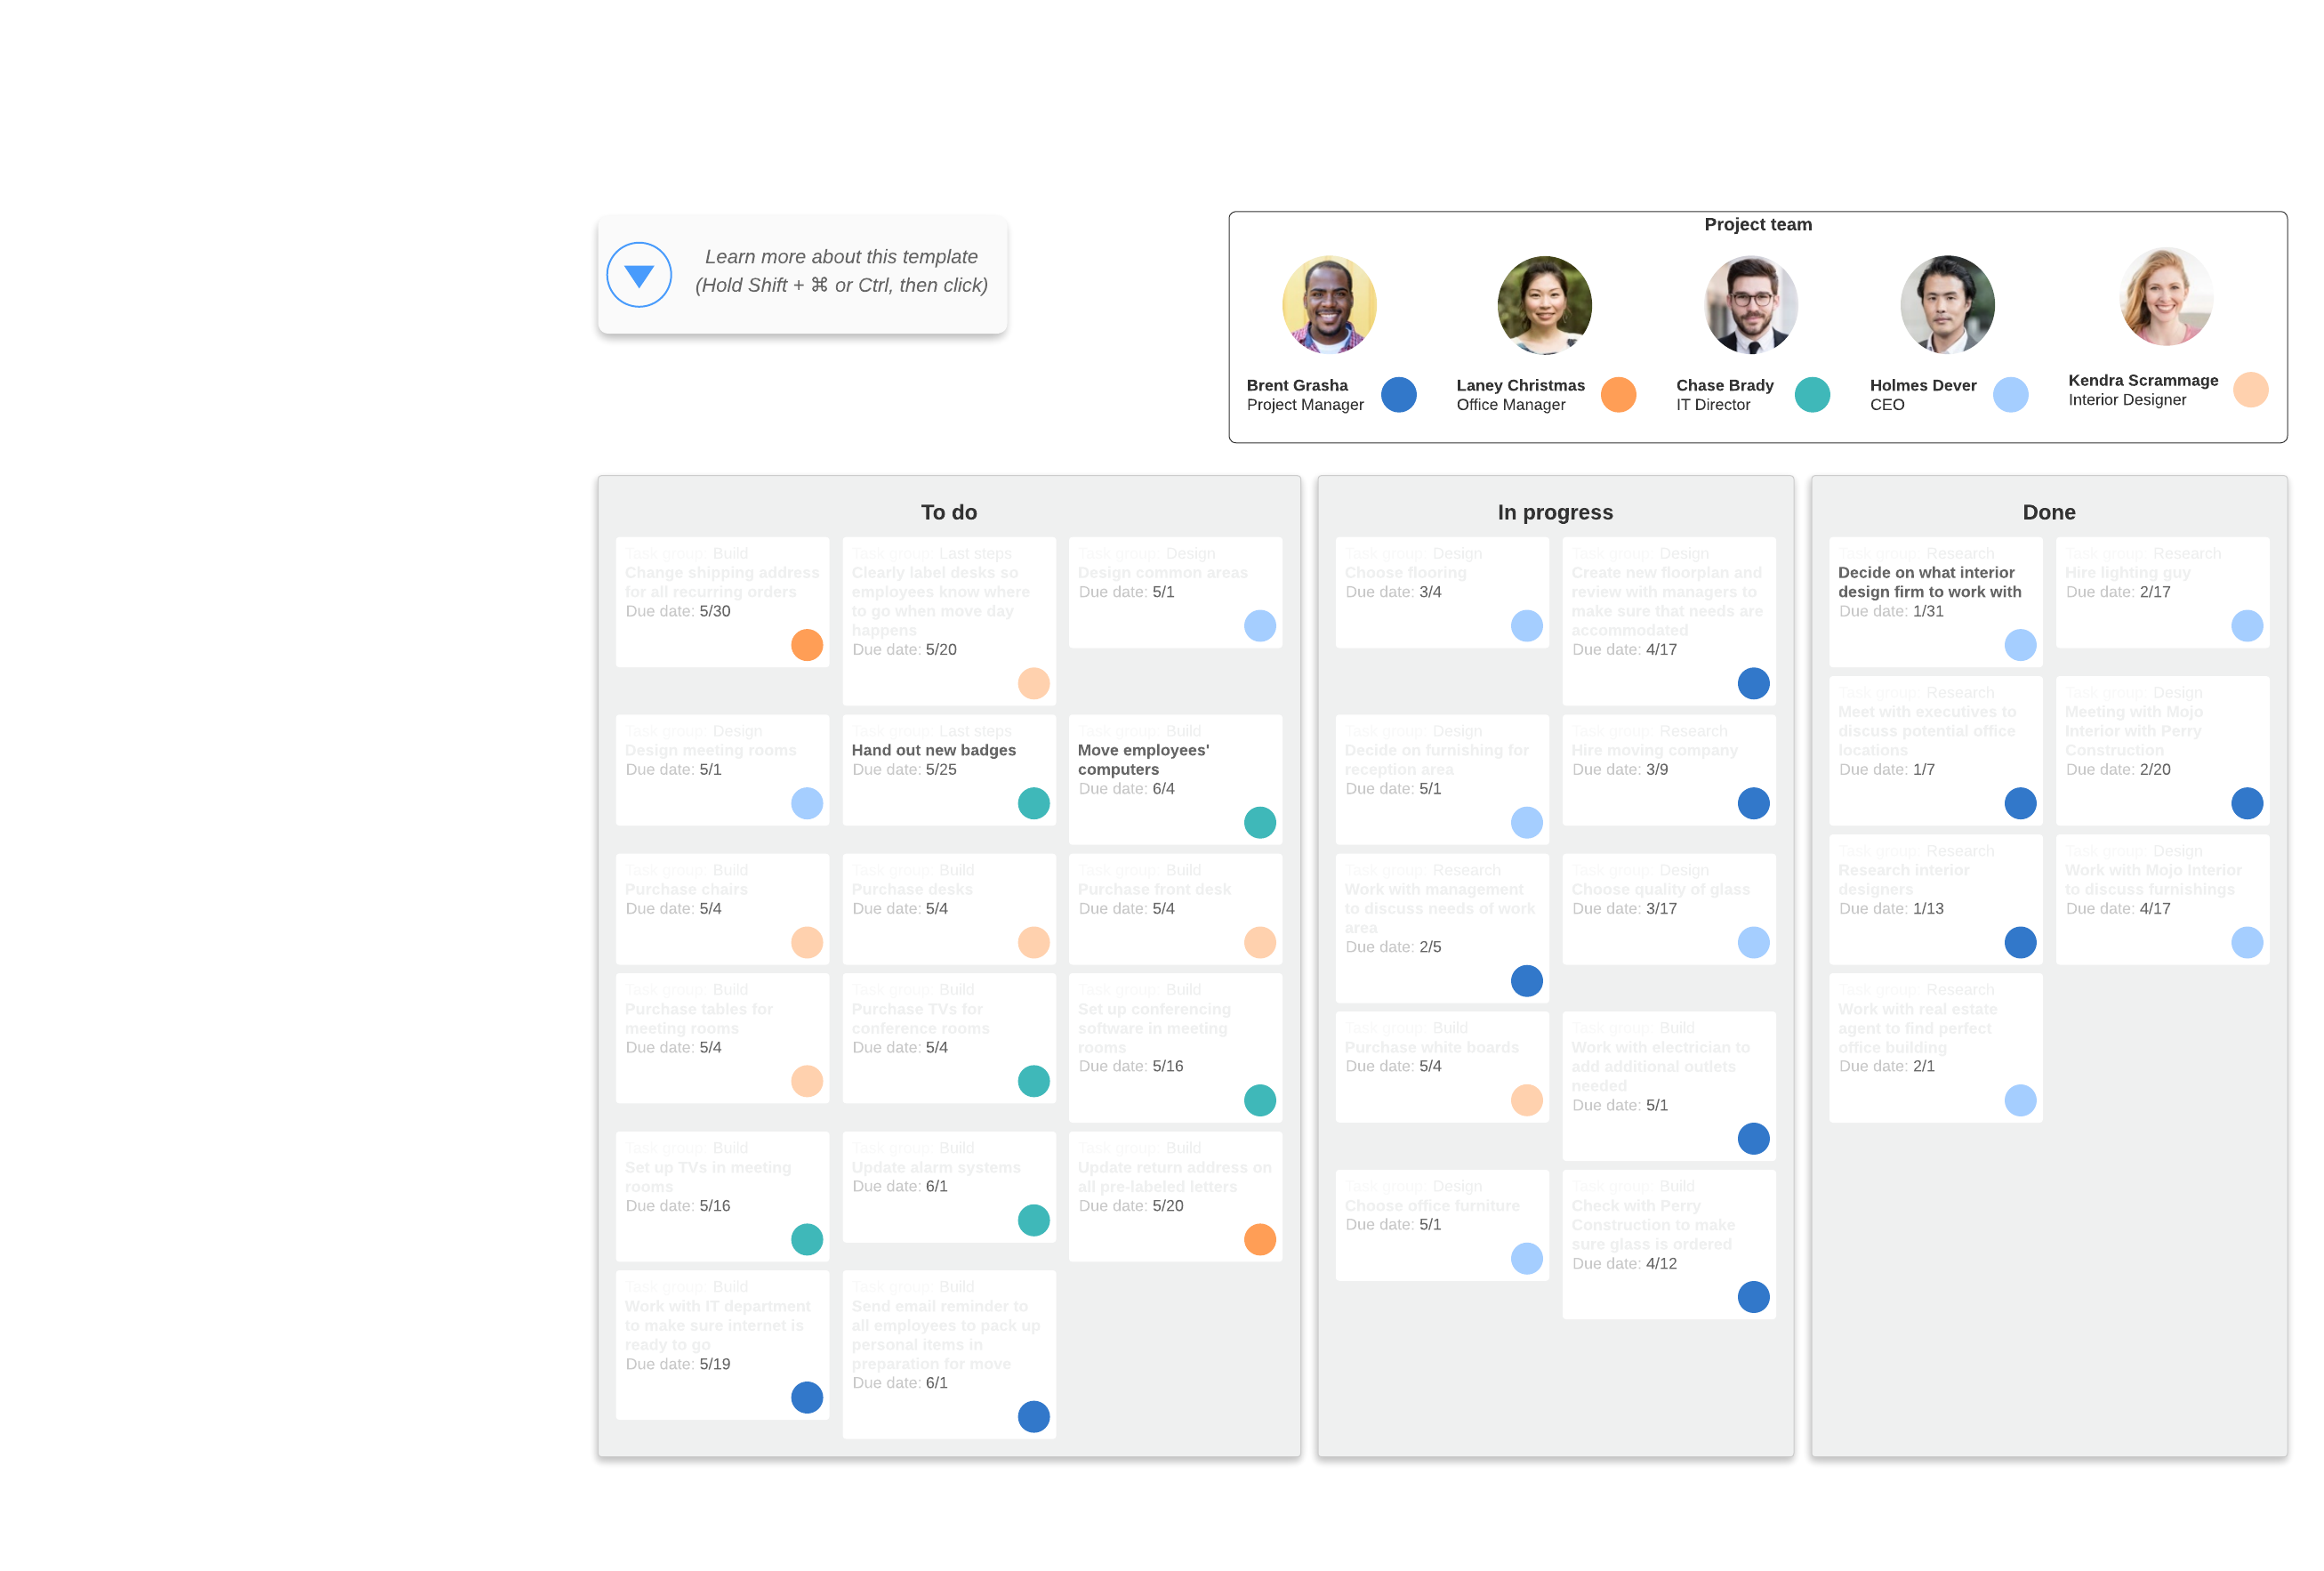
Documenting projects with static task planners is cumbersome and inefficient. Use this project task board in Lucid to track tasks in real-time. Auto-generated smart containers enable you to import your data directly to the dashboard so it’s always up to date. Quickly see task status and assignments to understand project progress at-a-glance.
Templates for business analysis
Business analysts are constantly engaged in strategy sessions in order to improve operations. Visualizing workflows can make that process much easier compared to traditional static documentation methods, especially when it comes to sharing documents with clients or stakeholders once they’re finalized.
SWOT analysis
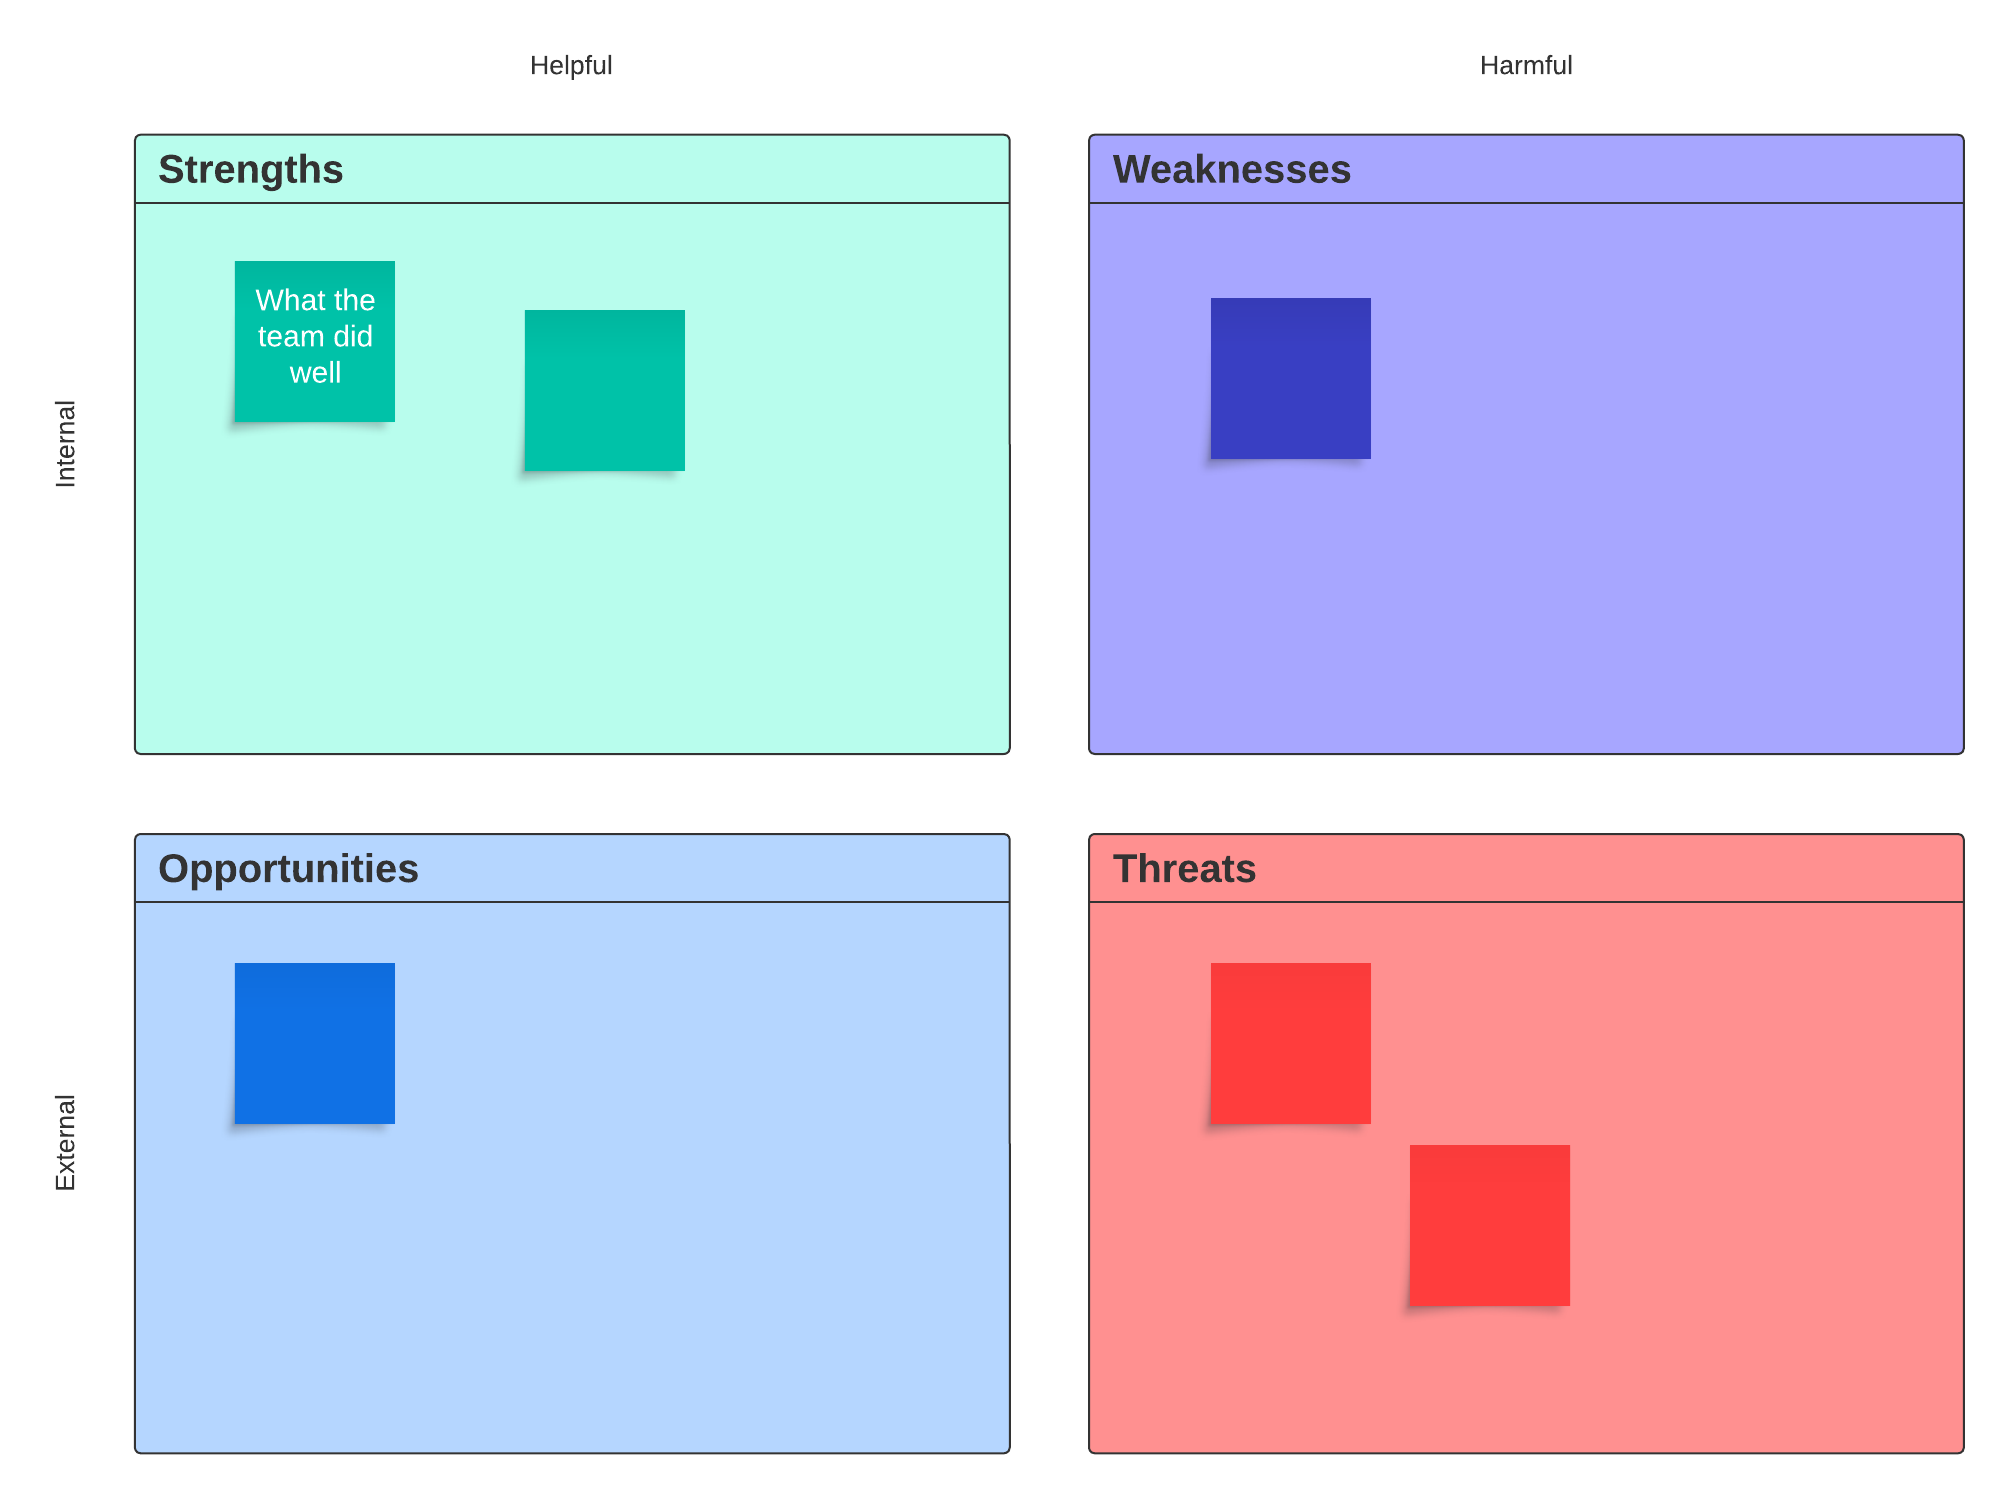
Understand where your business is and where it needs to go with a SWOT analysis. Whether you’re launching a new product, evaluating your service offerings, or identifying channels to bring in more clients, use this template to analyze your organization’s strengths, weaknesses, opportunities, and threats.
PESTEL analysis
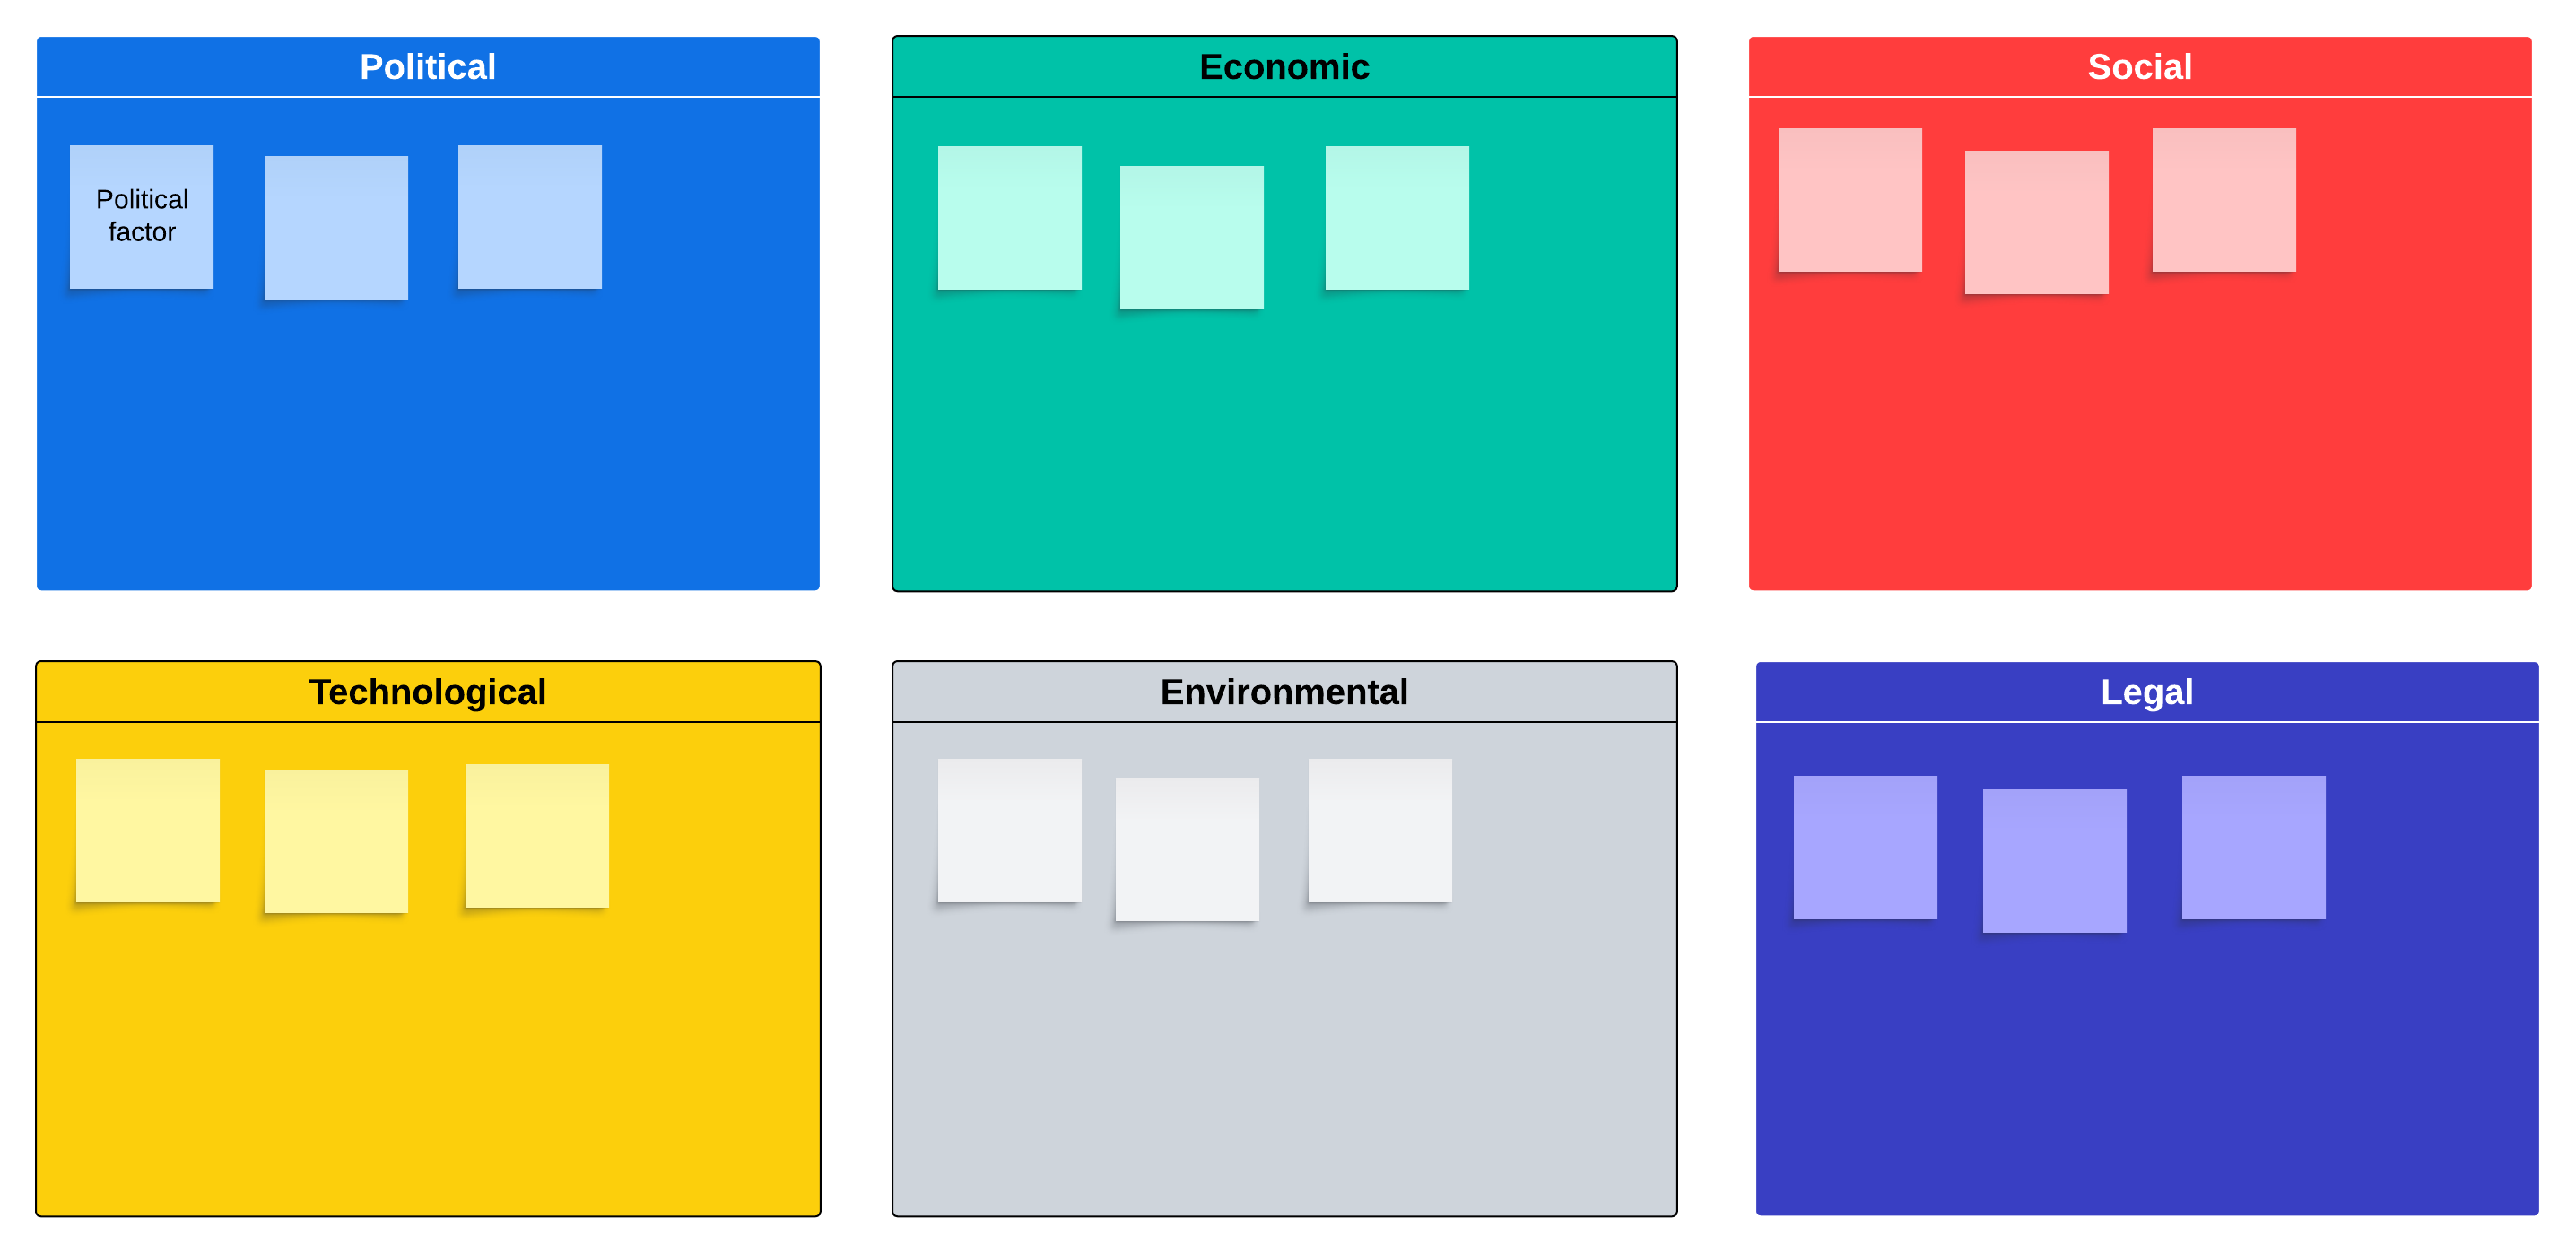
If you’re planning a reorganization, product launch, or strategic update, you’ll likely conduct a PESTEL analysis to understand the external factors that could impact the business.
Use this template with six pre-built containers to identify key political, economic, social, technological, environmental, and legal factors. Tag sticky important notes to prioritize key issues to come back to later. Use Lucid’s sorting feature to automatically sort the notes by level of importance so you can easily visualize the most impactful factors.
5s dashboard
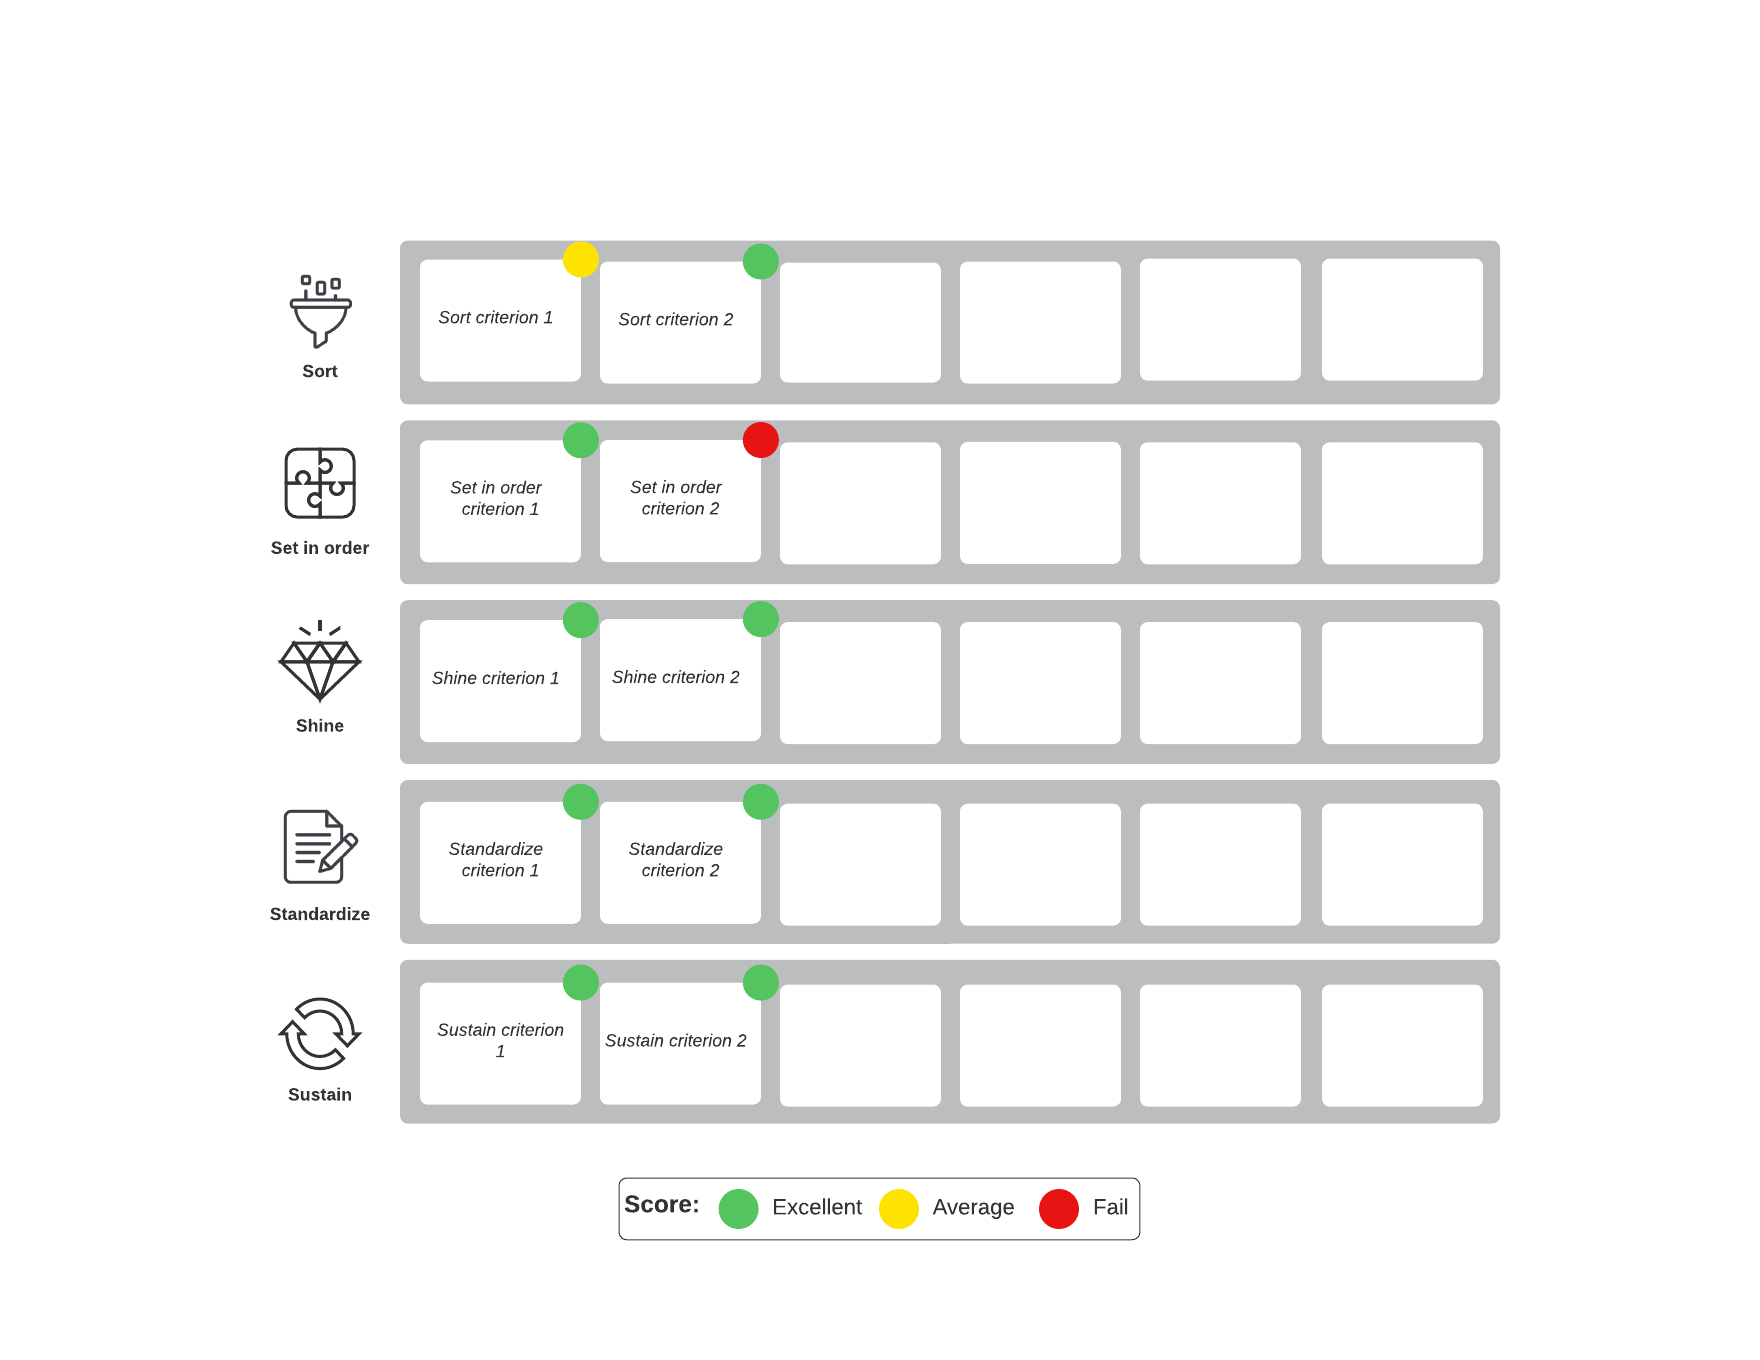
Many organizations benefit from the 5S technique for process management. Customize Lucid’s 5S dashboard template to help you document your business processes to identify waste, standardize workflows, and clarify steps for team members to follow. Because Lucid is designed for collaboration, it’s easy to bring in team members to contribute and share ideas to ensure you have the process down pat.
Project dashboard
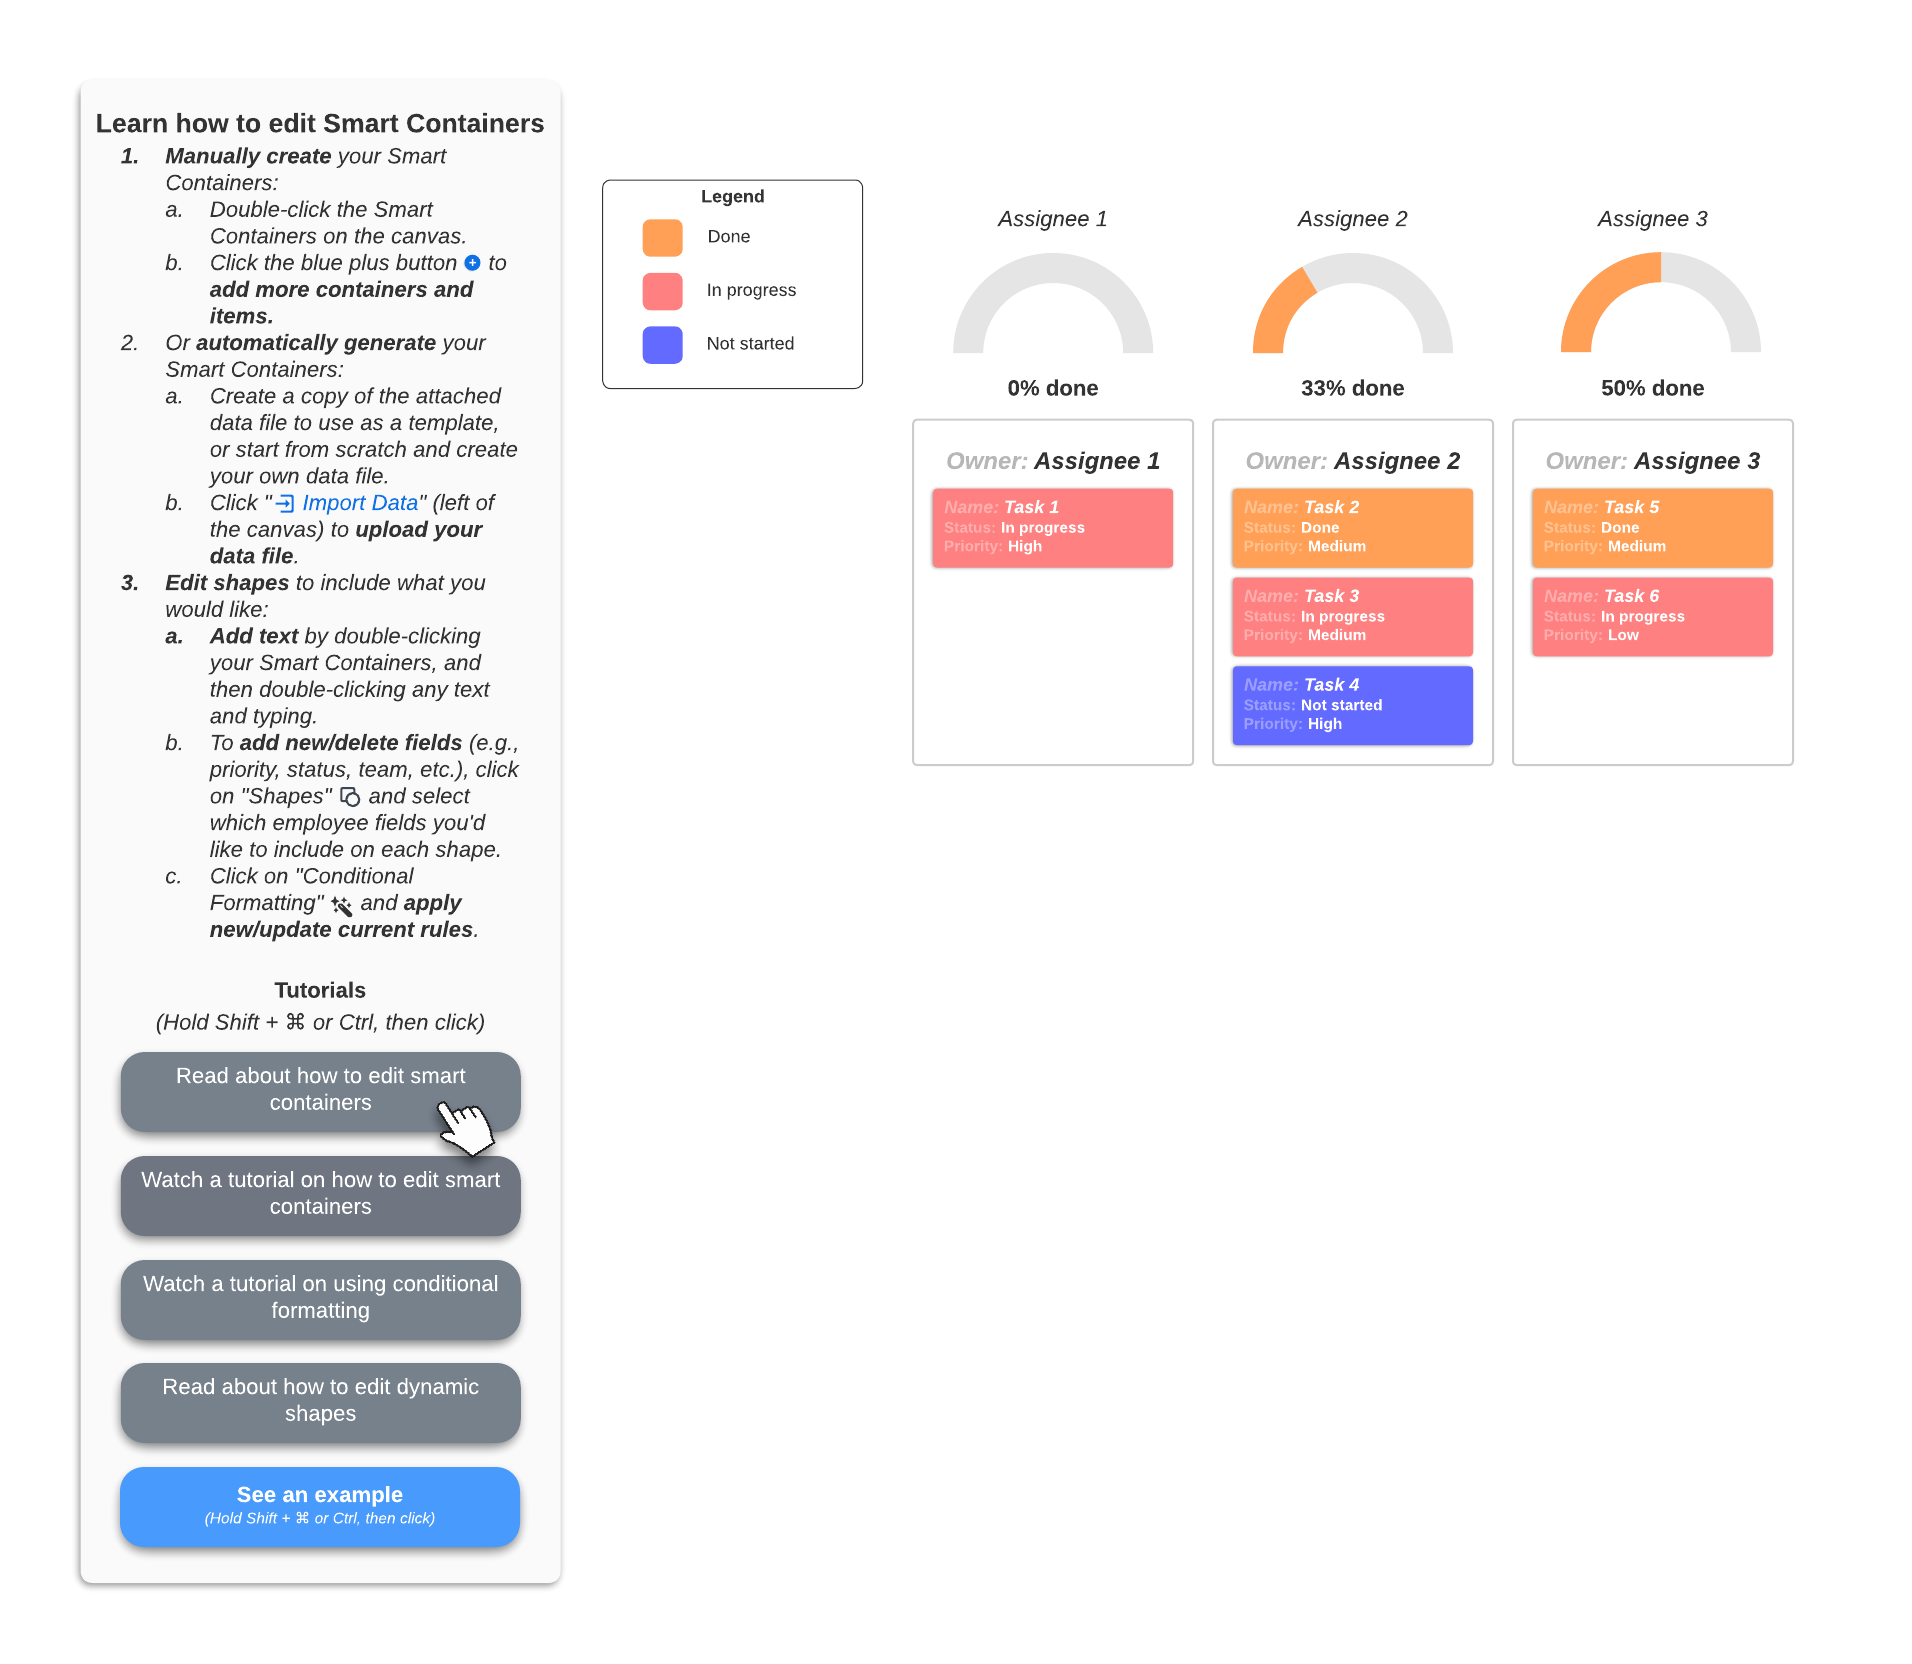
Bring your documentation to life with Lucid’s dynamic and customizable project dashboard. Smart containers allow you to import your data directly to the canvas. Plus, the data is linked to the original source, so your dashboard is always up to date. Lucid’s expansive shape library makes it easy to build a dashboard to your specific needs. Easily visualize project statuses, track team progress, and tag team members to alert them to any key priorities.
Org chart
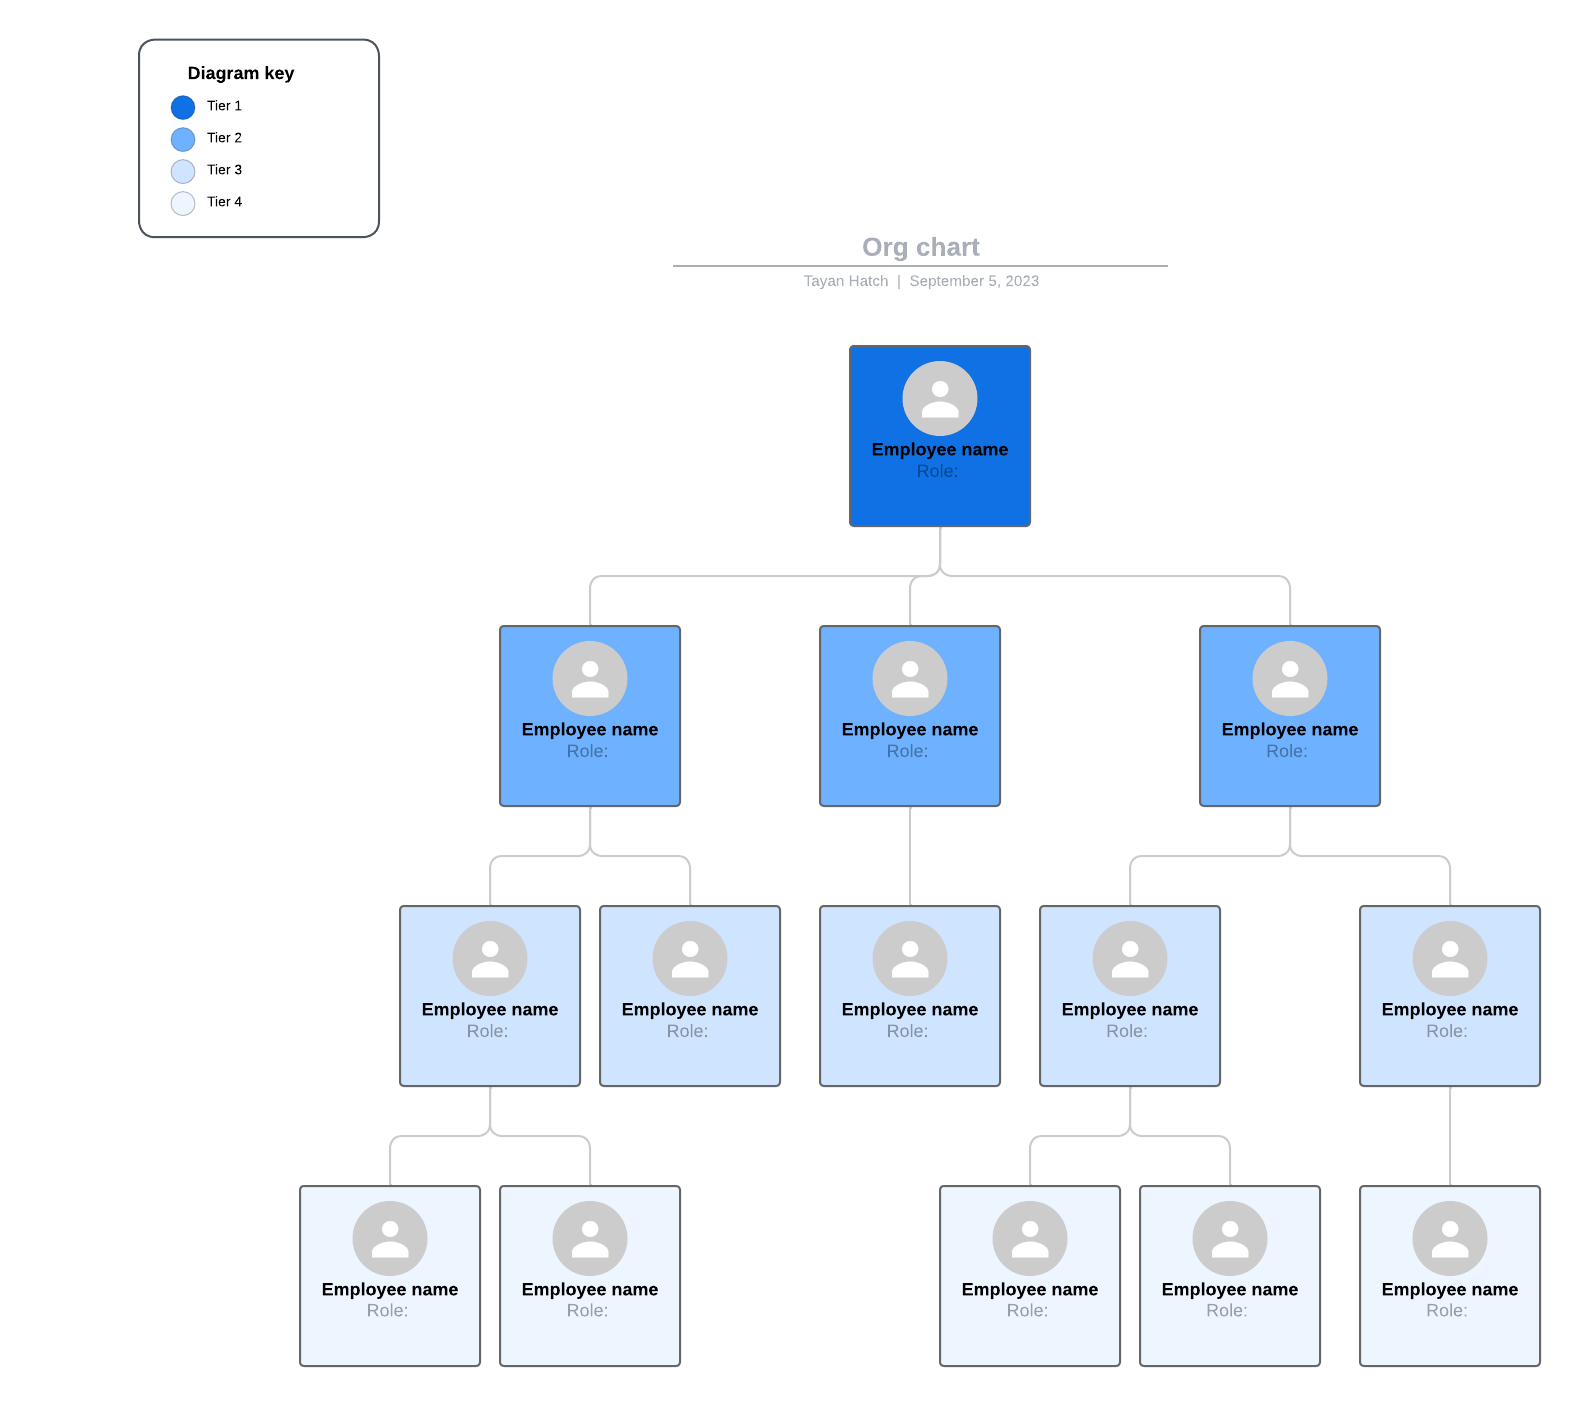
Improve onboarding and training and optimize staffing resources by visualizing your entire organization in an org chart. Manually creating org charts is a hassle—and it can take a lot of time to gather the info you need. But with Lucid’s suite of org chart templates, you can quickly import organizational data and visualize your teams.
Let intelligent documentation do the heavy lifting for you
Operations teams have to manage a variety of processes, often across siloed teams and cross-functional roles. As a result, static and manual documentation doesn’t fulfill the needs of modern, agile teams.
With Lucid, you can bring dynamic and visual documentation to your teams. Operations teams can use Lucid to:
- Reach alignment quickly through visuals that bring clarity at-a-glance
- Collaborate with stakeholders easier and faster in one central place
- Leverage data to make informed decisions about the business
- Streamline documentation to increase efficiency across the organization
Lucid’s intelligent data features are second to none. Data linking makes it easy to import data directly to your flowcharts, and it automatically updates so you’re always working with fresh information. Dynamic shapes and conditional formatting allow you to customize your templates and flag process inefficiencies or bottlenecks at the click of a button.
But processes are useless without a team to follow them. And with team hubs, Lucid makes it easier than ever to get everyone on the same page. Team hubs provide a one-stop shop for centralized documentation, so you have a single source of truth and a central repository for your teams.
These features make Lucid the ideal solution for effortlessly documenting critical operations processes.

Transform your documentation workflows by using Lucid to create dynamic and engaging resources. Contact us today to learn how to get started.
Get in touchAbout Lucid
Lucid Software is the leader in visual collaboration and work acceleration, helping teams see and build the future by turning ideas into reality. Its products include the Lucid Visual Collaboration Suite (Lucidchart and Lucidspark) and airfocus. The Lucid Visual Collaboration Suite, combined with powerful accelerators for business agility, cloud, and process transformation, empowers organizations to streamline work, foster alignment, and drive business transformation at scale. airfocus, an AI-powered product management and roadmapping platform, extends these capabilities by helping teams prioritize work, define product strategy, and align execution with business goals. The most used work acceleration platform by the Fortune 500, Lucid's solutions are trusted by more than 100 million users across enterprises worldwide, including Google, GE, and NBC Universal. Lucid partners with leaders such as Google, Atlassian, and Microsoft, and has received numerous awards for its products, growth, and workplace culture.