We know what you’re thinking right now, and no, we aren’t discussing Italian food in this article—sadly. But hey, process analysis is pretty cool, too! And that’s exactly what a spaghetti diagram is for.
In this article, we’re going to dive deep into a dish of spaghetti diagrams and share what they are, how to make them, and why they could be an untapped resource on your team. Plus, we’re sharing a template to help you make your own!
What is a spaghetti diagram?
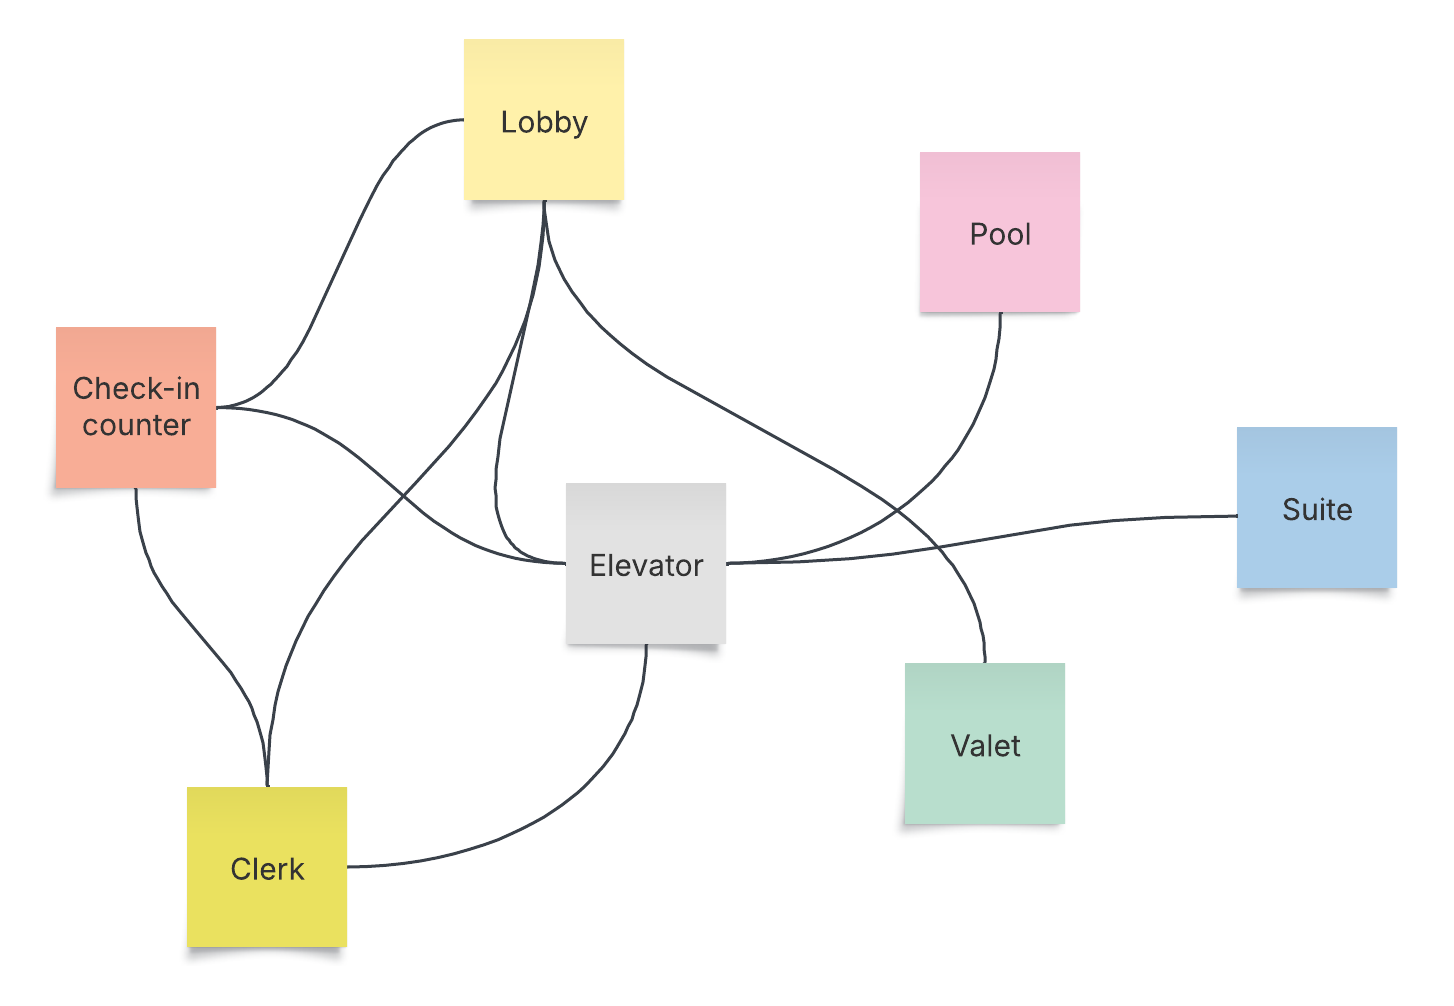
A spaghetti diagram (also known as a spaghetti map, spaghetti plot, or spaghetti chart) is a tool for tracking the process flow of people, information, or products. For example, a diagram may track the journey a product takes from a warehouse to a mailbox or the physical path an employee takes to complete tasks in person at the office. Charting out these paths helps business operations maximize efficiency and identify opportunities for improvement.
Spaghetti maps get their name because the paths that show the item’s movements look like spaghetti noodles. (Hungry yet?)
Who uses spaghetti diagrams?
Spaghetti diagrams are especially popular with supply chain specialists and manufacturers who want to save money and time in production processes. People, operations, or logistics managers can find great value in them as well. Really, they can be a useful tool for anyone trying to improve processes or save time.
Why would you use a spaghetti diagram?
Spaghetti diagrams are a great choice if you want to understand a process better so you can optimize it. For example, maybe you want to track the assembly line process on a shop floor or the journey your product takes from arrival to sorting at the warehouse.
Because spaghetti charts provide a thorough view of a process from beginning to end, they’re a great way to boost efficiency. However, because they’re typically so comprehensive, they sometimes require a larger budget for additional resources or layout changes.
Benefits of spaghetti maps
There are many reasons why your team should consider using a spaghetti diagram.
-
Boost efficiency: Breaking down processes in your workflow and identifying opportunities for improvement will save you time and money and positively impact your bottom line.
-
Better understand issues: 73% of knowledge workers agree that visuals are either very or extremely important when collaborating. Get to the bottom of problems more efficiently when you break them down visually.
-
Support training initiatives: If you’ve already broken down processes thoroughly in a diagram, new hires can use them when onboarding to grasp their work more quickly.
-
Track progress: Create documentation that team members and stakeholders can refer to. This will allow you to see how a process has changed and easily identify where growth has occurred.
-
Boost morale: Giving team members an opportunity to express their thoughts about a process not only provides a more comprehensive view of what’s happening, but it also allows them to feel more involved as a whole and like their opinions are valued. Plus, you’re more likely to secure buy-in for process changes when those making the change have gotten to weigh in on it.
How do you make a spaghetti diagram?
Spaghetti diagrams aren’t complicated to make, but because they need to be comprehensive to be useful, you’ll want to make sure you’re moving through each step intentionally.
1. Pick a process
Before you can begin, you’ll want to identify a specific process to analyze. Identifying pain points is a good way to start. Maybe it’s order fulfillment, the user journey, or something else entirely. The more specific, the better!
2. Collect information
Make sure you have all the important pieces of the process upfront. Talk to individuals involved, observe the flow, and examine data to identify any numbers that stand out or seem off. Is there process documentation you can review? In this step, you’ll really want to do your homework.
3. Pick a spaghetti diagramming tool
It’s almost time to begin plating that spaghetti, but before you do, you’ll want to pick the right diagramming tool to help you. The tool should have high standards of security, a variety of options for sharing and collaborating with your team, and a template to help you get started. The right program will help ensure you’re successful in creating your spaghetti map. Personally, we’re partial to Lucid.
4. Diagram away!
It’s time to get started on the actual diagram. Use the diagramming software you chose to break down your chosen process visually. Drag and drop shapes and connect them with lines to represent flows. Add notes and links to documentation for context. Explore different styles and formatting to make it easier to read. If you’re working with a spaghetti diagram template, it will make the process even easier.