UML is extremely useful for visualizing and documenting software systems, but the terminology can be somewhat overwhelming for someone unfamiliar with UML. An activity diagram is essentially a flowchart that shows activities performed by a system. If you're new to UML diagramming software, this guide will help you get started.
What is an activity diagram?
The Unified Modeling Language includes several subsets of diagrams, including structure diagrams, interaction diagrams, and behavior diagrams. Activity diagrams, along with use case and state machine diagrams, are considered behavior diagrams because they describe what must happen in the system being modeled.
Stakeholders have many issues to manage, so it's important to communicate with clarity and brevity. Activity diagrams help people on the business and development sides of an organization come together to understand the same process and behavior. You'll use a set of specialized symbols—including those used for starting, ending, merging, or receiving steps in the flow—to make an activity diagram, which we’ll cover in more depth within this activity diagram guide.
Benefits of activity diagrams
Activity diagrams present a number of benefits to users. Consider creating an activity diagram to:
-
Demonstrate the logic of an algorithm.
-
Describe the steps performed in a UML use case.
-
Illustrate a business process or workflow between users and the system.
-
Simplify and improve any process by clarifying complicated use cases.
-
Model software architecture elements, such as method, function, and operation.
Basic components of an activity diagram
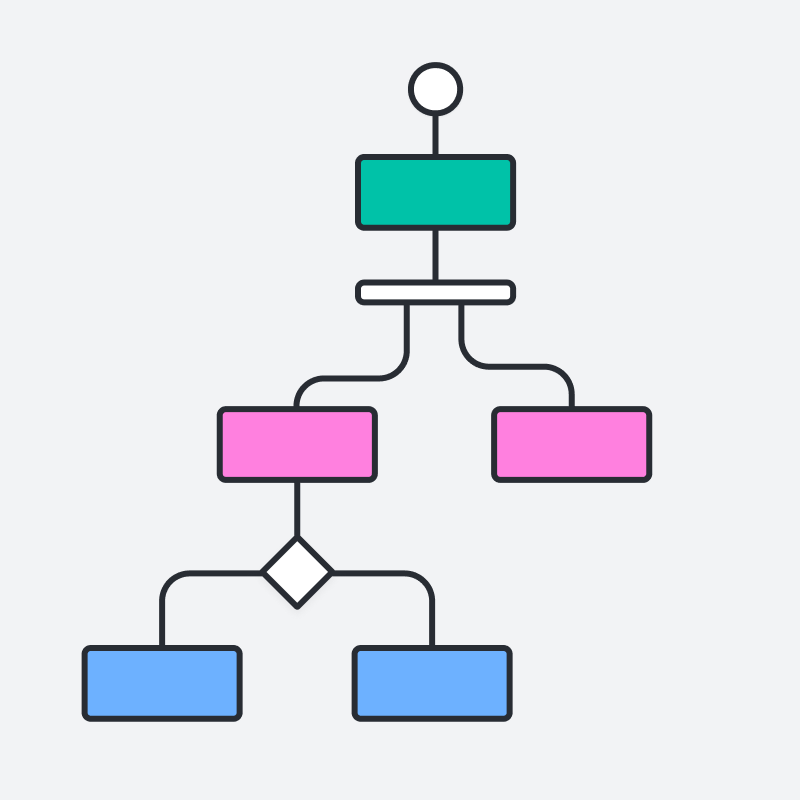
Before you begin making an activity diagram, you should first understand its makeup. Some of the most common components of an activity diagram include:
-
Action: A step in the activity wherein the users or software perform a given task. In Lucidchart, actions are symbolized with round-edged rectangles.
-
Decision node: A conditional branch in the flow that is represented by a diamond. It includes a single input and two or more outputs.
-
Control flows: Another name for the connectors that show the flow between steps in the diagram.
-
Start node: Symbolizes the beginning of the activity. The start node is represented by a black circle.
-
End node: Represents the final step in the activity. The end node is represented by an outlined black circle.
Activity diagram symbols
These activity diagram shapes and symbols are some of the most common types you'll find in UML diagrams.
 | Start symbol | Represents the beginning of a process or workflow in an activity diagram. It can be used by itself or with a note symbol that explains the starting point. |
 | Activity symbol | Indicates the activities that make up a modeled process. These symbols, which include short descriptions within the shape, are the main building blocks of an activity diagram. |
 | Connector symbol | Shows the directional flow, or control flow, of the activity. An incoming arrow starts a step of an activity; once the step is completed, the flow continues with the outgoing arrow. |
 | Joint symbol or Synchronization bar | Combines two concurrent activities and re-introduces them to a flow where only one activity occurs at a time. Represented with a thick vertical or horizontal line. |
 | Fork symbol | Splits a single activity flow into two concurrent activities. Symbolized with multiple arrowed lines from a join. |
 | Decision symbol | Represents a decision and always has at least two paths branching out with condition text to allow users to view options. This symbol represents the branching or merging of various flows with the symbol acting as a frame or container. |
 | Note symbol | Allows the diagram creators or collaborators to communicate additional messages that don't fit within the diagram itself. Leave notes for added clarity and specification. |
 | Send signal symbol | Indicates that a signal is being sent to a receiving activity. |
 | Receive signal symbol | Demonstrates the acceptance of an event. After the event is received, the flow that comes from this action is completed. |
 | Shallow history pseudostate symbol | Represents a transition that invokes the last active state. |
 | Option loop symbol | Allows the creator to model a repetitive sequence within the option loop symbol. |
 | Flow final symbol | Represents the end of a specific process flow. This symbol shouldn't represent the end of all flows in an activity; in that instance, you would use the end symbol. The flow final symbol should be placed at the end of a process in a single activity flow. |
 | Condition text | Placed next to a decision marker to let you know under what condition an activity flow should split off in that direction. |
 | End symbol | Marks the end state of an activity and represents the completion of all flows of a process. |
Activity diagram examples
Activity diagrams map out process flows in a way that's easy to understand. Consider the two examples below when it comes to creating UML activity diagrams.
Activity diagram for a login page
Many of the activities people want to accomplish online—checking email, managing finances, ordering clothes, etc.—require them to log into a website. This activity diagram shows the process of logging into a website, from entering a username and password to successfully logging in to the system. It uses different container shapes for activities, decisions, and notes. Lucidchart is the ideal tool for creating any kind of UML flowchart, whether it’s an activity diagram, a use case diagram, or a component diagram. Lucidchart offers in-editor collaboration tools and instant web publishing so you can demonstrate the functionality of your system to others.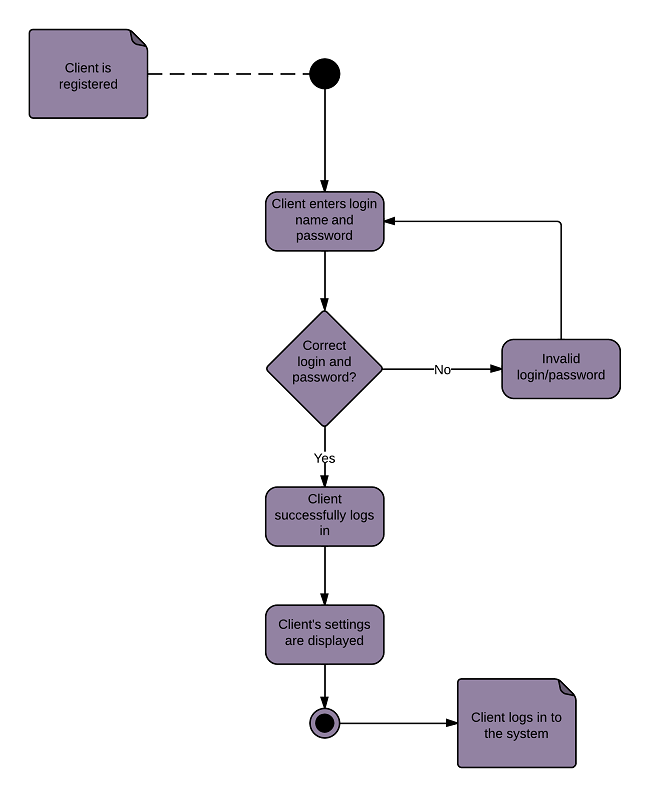
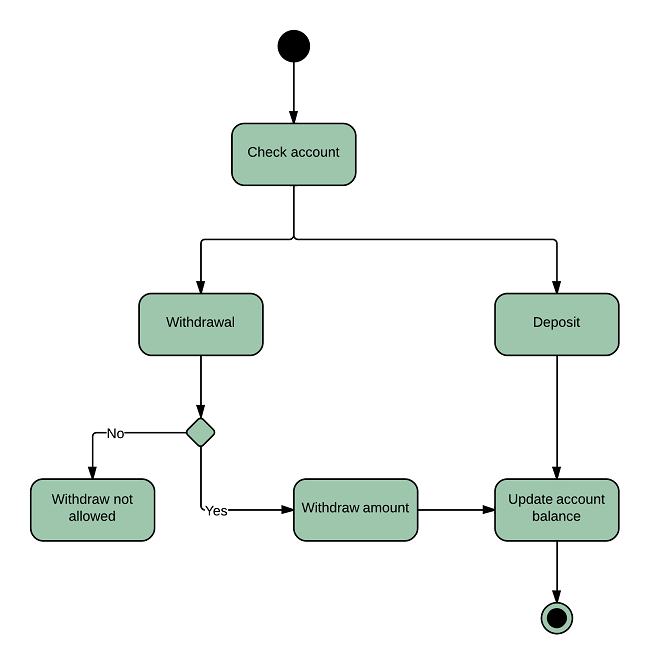
Activity diagram for a banking system
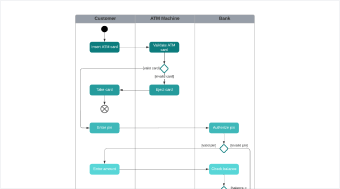
This diagram shows the process of either withdrawing money from or depositing money into a bank account. An advantage of representing the workflow visually in UML is the ability to show withdrawals and deposits on one chart. When you use Lucidchart to build an activity diagram, you can customize your templates with professional-grade typefaces and colors. Never worry about losing your documents with secure, cloud-based storage.
Create UML activity diagrams to visualize complex logic and parallel processing within your system. This tutorial breaks down standardized UML notation, including action states, forks, and swimlanes, to help you model dynamic business processes or software algorithms. Learn how to use Lucidchart to build clean, professional diagrams that ensure your team stays aligned on system architecture.
How to make an activity diagram
In Lucidchart, creating an activity diagram from scratch is surprisingly simple. Follow these steps:
-
Open a blank document or start with a template.
-
Click "Shapes" to the left of the editor to open the Shape Library Manager. Check "UML" to add all of the UML shape libraries (or just "UML State/Activity"), and click "Save."
-
From the shape libraries you just added, drag the symbol you want from the toolbox to the canvas.
-
Then model the process flow by drawing lines between shapes.
In Lucidchart, it's easy to resize and style any element. You can even import SVG shapes and Visio files for a custom solution.
Everything you need to make a diagram
Make a polished, professional diagram for free with Lucidchart. No matter what you have in mind, we have the tools you need to build it. Make an account and start diagramming today.
Sign up free