How data-driven visuals can cure spreadsheet fatigue and inform business decisions
Jamie Lyon
Reading time: about 3 min
Topics:
About the author

About Lucid
Lucid Software is the leader in visual collaboration and work acceleration, helping teams see and build the future by turning ideas into reality. Its products include the Lucid Visual Collaboration Suite (Lucidchart and Lucidspark) and airfocus. The Lucid Visual Collaboration Suite, combined with powerful accelerators for cloud and process transformation, empowers organizations to streamline work, foster alignment, and drive business transformation at scale. airfocus, an AI-powered product management and roadmapping platform, extends these capabilities by helping teams prioritize work, define product strategy, and align execution with business goals. The most used work acceleration platform by the Fortune 500, Lucid's solutions are trusted by more than 100 million users across enterprises worldwide, including Google, GE, and NBC Universal. Lucid partners with leaders such as Google, Atlassian, and Microsoft, and has received numerous awards for its products, growth, and workplace culture.
Related articles
Tech stack consolidation strategies in 2026 (+ real-world examples)
Consolidate your tech stack, reduce costs, and increase efficiency by standardizing collaboration with Lucid.
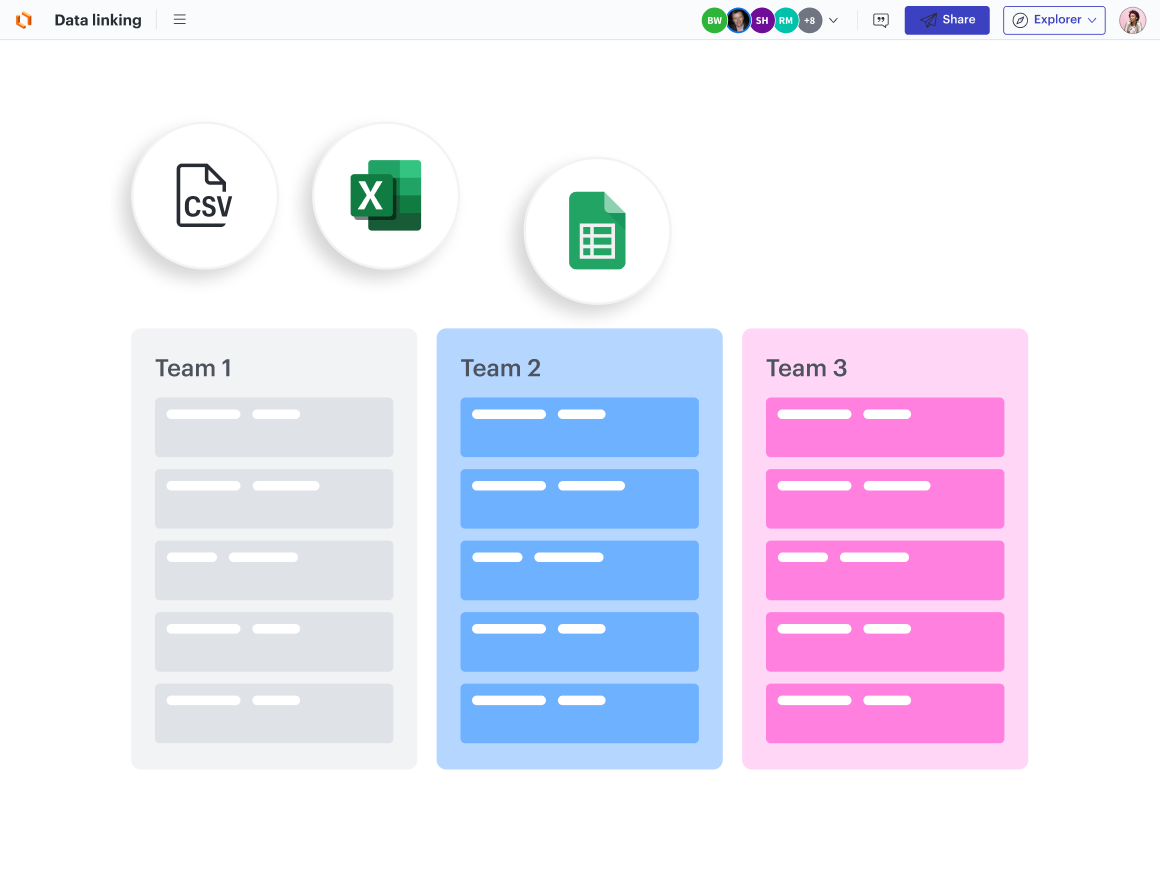
Collaboration reinvention: Spreadsheet struggles
Looking for an alternative to spreadsheets? Lucid’s visual and collaboration features can help make sense of data in ways spreadsheets can’t.
How Lucid’s operations team uses Lucid to maximize efficiency
Lucid’s operations teams use Lucid in their daily workflows to optimize our organization. Here’s how they do it.
How Lucid helps teams build—not just talk about it
Find out how to use Lucid to work efficiently, collaborate continuously, and build the future faster.
Bring your bright ideas to life.


By registering, you agree to our Terms of Service and you acknowledge that you have read and understand our Privacy Policy.