-
It’s innovative
Spreadsheets haven’t changed much since the ’70s. But unless you’re still wearing bell bottoms and polyester (and hey, we’re here for that), it’s probably time to find something more modern to trust with your most important data and work.
Lucid’s intelligent diagramming features help make sense of data in ways that spreadsheets just can’t, accelerating decision-making and driving innovation. Easily create process maps and user flows, scale cloud infrastructure, plan and organize scrum teams, and map data flows using a common visual language that boosts communication and helps you break down complex ideas, fast.
Lucid is continually expanding to include more features and offerings that maximize your productivity. For example, we recently announced the release of Collaborative AI to make quick work ideating, planning, designing, and building. And there’s always more coming. Work confidently, knowing you’ve got the most innovative solutions available at your fingertips.
-
It’s collaborative
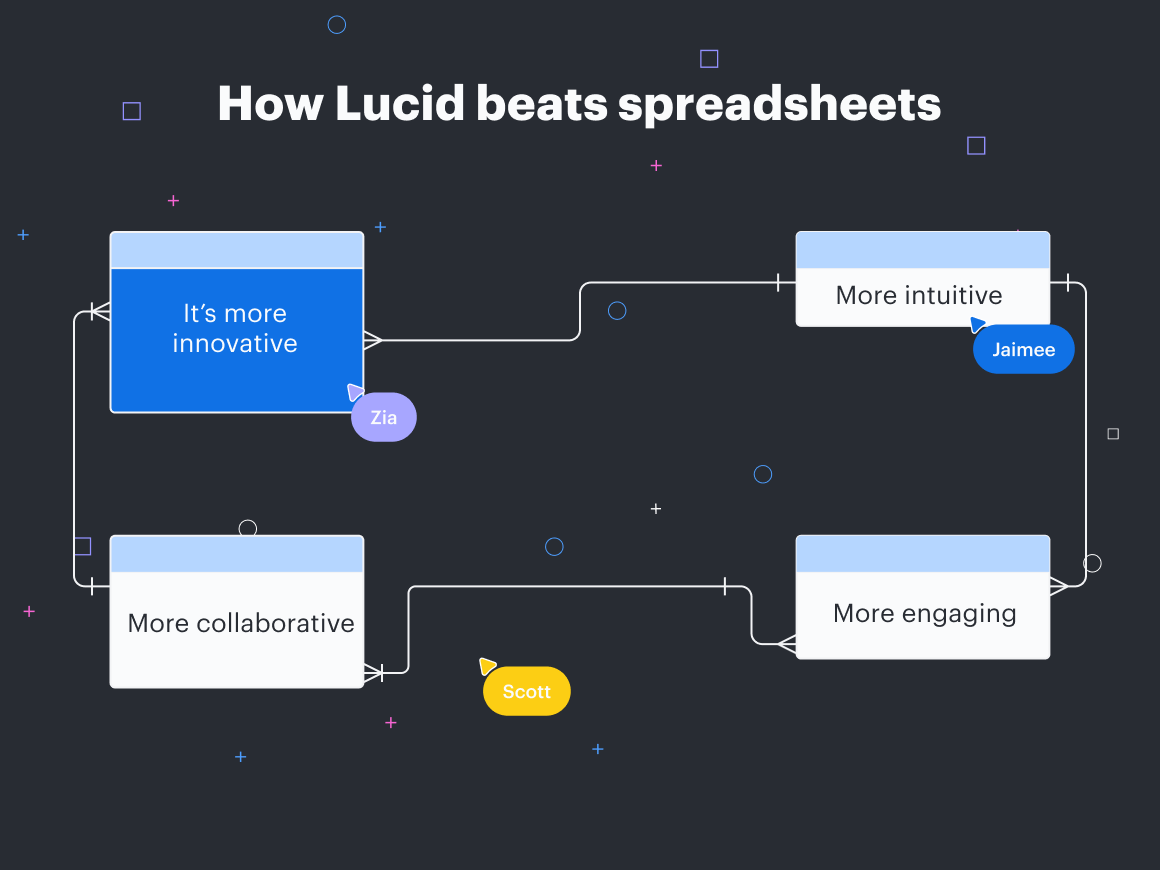
Its collaborative features are where Lucid truly shines. The true antithesis to a static, rigid spreadsheet, Lucid provides a flexible workspace that makes it easy to share ideas, ask questions, and collaborate in real time, just like if you were in the boardroom (except better, because you can wear pajamas if you want).
Use sticky notes, freehand drawings, color-coded cursors, and a variety of shapes and lines on an infinite canvas for unlimited ideation and creation. Use emojis and voting activities to get people’s reactions and opinions in real time, built-in timers to timebox discussions and stay on track, and Breakout Boards to facilitate smaller group work for seamless syncs and meetings. Group insights by themes and trends, vote on ideas, and craft workflows and project documentation. And that’s just the beginning.
Plus, thousands of templates and plenty of integrations with your favorite existing apps make getting started a breeze.
-
It’s intuitive
You don’t have to spend hours learning software and formulas, then manually inputting data—Lucid leverages the work that you’ve already done so you can spend your time on high-impact activities that are directly affecting your bottom line, like problem-solving or interpreting data to make decisions.
Data overlay, or adding data on top of your diagrams, and data replace features make it simple to merge, transfer, and update data between diagrams so you can see the performance of processes, systems, and more. Smart containers (not unlike pivot tables or filtering within a spreadsheet, but way easier to use) allow you to group data sets linked to your diagram by unique attributes instead of sifting through a spreadsheet to find the info you need.Dynamic shapes allow you to add values and formulas to calculate or display information like progress, percentages, and ratings.
You can also link your Lucid documents to existing data for real-time updates, so you are always working with the most up-to-date information, and your document is a reliable source of truth for your team.
-
It’s engaging
If you want your team member to feel engaged in a project, task, or presentation, you have to actively try to not be boring. With hundreds of colors, images, emojis, symbols, GIFs, and more at your disposal, Lucid is anything but boring.
We believe collaboration is best when it’s visual, and we have the numbers to prove it. According to our research, 30% of knowledge workers think that visuals are the key to increased alignment and quicker task completion. And 69% believe visuals are extremely or very important for collaboration.
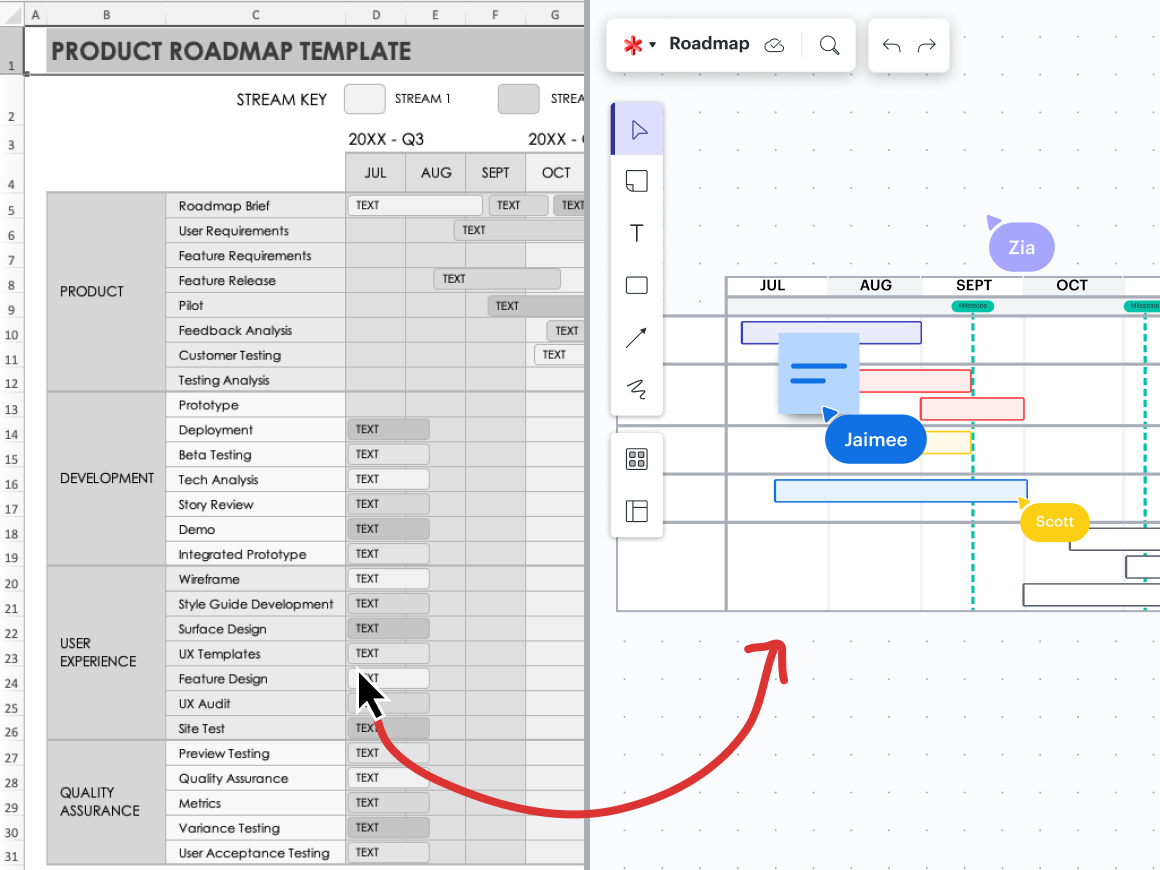
A note to spreadsheet enthusiasts
If you’ve been using spreadsheets all your life, and especially if you’re one of those that have dedicated hours to its mastery, you may hesitate to consider something different. But you can leave spreadsheets to the job they were meant to do and still use a better purpose-built solution for tasks that require deeper collaboration.
You’ll still benefit from incorporating Lucid into your workflow. Easily add diagrams, flowcharts, whiteboards, and more directly alongside your data directly within a spreadsheet. Visually bring your data to life to provide more clarity and context.
Or, link spreadsheets in your Lucid documents as a thumbnail that you can easily reference, expand, and edit. You can even import rows in Google Sheets as Lucid Cards in Lucidspark, which you can then tag, gather, sort, organize, assign, and more