Entity relationship diagrams show the relationship between different entities in a system. These diagrams are especially useful in providing an at-a-glance view of what information exists in a system and how it connects. They can also help teams think through how users, software, and databases interact in real-world scenarios.
Learn more about entity relationship diagrams, including their origins, uses, examples, components, and how to draw them using our ER diagram tool.
What is an ER diagram?
An entity relationship (ER) diagram is a type of flowchart that illustrates how entities such as people, objects, or concepts relate to each other within a system. ER diagrams are most often used to design or debug relational databases in the fields of software engineering, business information systems, education, and research. Also known as ERDs or ER models, they use a defined set of symbols such as rectangles, diamonds, ovals, and connecting lines to depict the interconnectedness of entities, relationships, and their attributes. They mirror grammatical structure, with entities as nouns and relationships as verbs.

ER diagrams are related to data structure diagrams (DSDs), which focus on the relationships of elements within entities instead of relationships between entities themselves. ER diagrams are also used in conjunction with data flow diagrams (DFDs), which map out the flow of information for processes or systems.

History of ER models
Peter Chen, a computer scientist and applied mathematician, is credited with developing ER modeling for database design in the 1970s. Before the field of computer science existed, the depiction of the interconnectedness of things dates back to ancient Greece with the works of Aristotle, Socrates, and Plato. It's seen more recently in the 19th and 20th century works of philosopher-logicians such as Charles Sanders Peirce and Gottlob Frege.
By the 1960s and 1970s, Charles Bachman and A.P.G. Brown were developing the predecessors of Chen's approach. Bachman developed a type of data structure diagram called the Bachman Diagram. Brown published works on real-world systems modeling. James Martin added ERD refinements. The work of Chen, Bachman, Brown, Martin, and others also contributed to the development of Unified Modeling Language (UML), widely used in software design.
Uses of entity relationship diagrams
Database design
ER diagrams are used to model and design relational databases. The logical data model is used for logic and business rules, and the physical data model is used for technology implementation. In software engineering, an ER diagram is often an initial step in determining requirements for an information systems project. It's also later used to model a particular database or databases. A relational database has an equivalent relational table and can potentially be expressed that way as needed.
ERDs are often used at the start of a new database project to outline the requirements and help the team build a model that expresses the information flows between the user, software, database, and other entities. Because they make assumptions and dependencies visible early, ERDs can improve planning and decision-making before implementation begins.
Common early-stage benefits include catching issues sooner, eliminating confusion about complex systems, and mitigating risk.
Database troubleshooting
ER diagrams are used to analyze existing databases to find and resolve problems in logic or deployment. Drawing the diagram helps reveal what’s going wrong.
Business information systems
The diagrams are used to design or analyze relational databases for business processes. Any business process that uses fielded data involving entities, actions, and interplay can potentially benefit from a relational database. It can streamline processes, uncover information more easily, and improve results.
Business process re-engineering (BPR)
ER diagrams help in analyzing databases used in business process re-engineering and in modeling a new database setup.
Education
Databases are today's method of storing relational information for educational purposes and later retrieval, so ER diagrams can be valuable in planning those data structures.
Research
Since so much research focuses on structured data, ER diagrams can play a key role in setting up useful databases to analyze the data.
The components and features of an ER diagram
ER diagrams are composed of entities, relationships, and attributes. They also depict cardinality, which defines relationships in terms of numbers. Here's a glossary:
Entity
An entity is any kind of data object. These objects can be computers, printers, employees, customers, places, events, concepts, and so on.

Entity type: An entity type is a group of definable things, such as customers or products, whereas the entity would be the specific customer or product.
Entity set: An entity set is the same as an entity type, but is defined at a particular point in time, such as customers who purchased last month. A related term is instance, in which a specific customer would be an instance of the entity set.
Entity categories: Entity categories include strong, weak, and associative. A strong entity can be defined solely by its own attributes, while a weak entity can’t. An associative entity connects entities (or elements) within an entity set.


Entity keys: An entity key is an attribute that uniquely defines an entity in an entity set. Entity keys can be super, candidate, or primary. A super key is a set of attributes (one or more) that together define an entity in an entity set. A candidate key is a minimal super key, meaning it has the least possible number of attributes to still be a super key. An entity set may have more than one candidate key. A primary key is a candidate key chosen by the database designer to uniquely identify the entity set.
Relationship
Relationships define how entities act upon each other or are associated with each other. Think of relationships as verbs. For example, a specific customer might purchase a product. The two entities would be the customer and the product, and the relationship depicted is the act of purchasing, connecting the two entities in that way. Relationships are typically shown as diamonds or labels directly on the connecting lines.


Recursive relationship: In a recursive relationship, the same entity participates more than once in the relationship.
Attribute
Attributes are what define the properties of the entities in your database. You might have a customer entity set that has different values for name, address, payment information, and so on.


Descriptive attribute: A descriptive attribute is a property or characteristic of a relationship (versus of an entity).
Attribute categories: Attribute categories include simple, composite, derived, as well as single-value or multi-value. A simple attribute is atomic and can't be further divided, such as a phone number. A composite attribute is a sub-attribute springing from an attribute. A derived attribute is calculated or otherwise derived from another attribute, such as age from a birthdate. A multi-value attribute is a value for more than one attribute, such as multiple phone numbers for a person. A single-value attribute has just one attribute value. The types can be combined, such as simple single-value attributes or composite multi-value attributes.

Cardinality
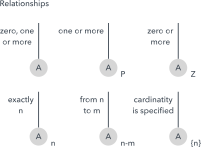
Cardinality defines the numerical attributes of the relationship between two entities or entity sets. The three main cardinal relationships are one-to-one, one-to-many, and many-many. A one-to-one example would be one customer associated with one mailing address. A one-to-many example (or many-to-one, depending on the relationship direction) would be one customer purchasing multiple products, but all those products have a single line back to that one customer. In a many-to-many example, customers as a group are associated with multiple products, and products in turn are associated with multiple customers.

Cardinality views: Cardinality views can be shown as look-across or same-side, depending on where the symbols are shown.
Cardinality constraints: Cardinality constraints are the minimum or maximum numbers that apply to a relationship.
Mapping natural language
ER components can be equated to parts of speech. This shows how an ER diagram compares to a grammar diagram:
-
Common noun - Entity type example: customer
-
Proper noun - Entity example: Sally Smith
-
Verb - Relationship type example: purchases
-
Adjective - Attribute for entity example: new
-
Adverb - Attribute for relationship example: digitally
The database query language ERROL actually mimics natural language constructs. ERROL is based on reshaped relational algebra (RRA) and works with ER models, capturing their linguistic aspects.
ERD symbols and notations
The following images show several ERD notation systems. Check out the ERD symbols and notation page for more information.
Chen notation style
 |  |  |
 |  |  |
 |  |  |
 |  |  |
 |
 |
 |
 |
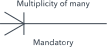
Crow’s Foot/Martin/Information Engineering style
 |  |
 |  |
 |  |
Bachman style
 |
 |
IDEF1X style
 |  |  |
Barker style
Some teams also apply UML notation when they want ER-style relationships expressed with object-oriented conventions. This doesn’t mean that the ERD becomes a type of UML diagram. Instead, it simply means that UML notation is used to describe entity relationships and cardinality. With the UML notation, relationships are shown as a solid line connecting two entities. Cardinalities are indicated on the line (for example, 1..1 indicates one-to-one, or 1..* for one-to-many) and you can add verb phrases (like “made by” or “ordered by”) to define the relationship between the entities.
 |  |
 |  |
 |  |
 |
Examples
Following are examples of ERD diagrams made in each system.


Conceptual, logical, and physical data models
ER models and data models are typically drawn at up to three levels of detail:
Conceptual data model
This model shows the highest-level view containing the least detail. Its value is capturing the overall scope of the model and portraying the system architecture. For a system of smaller scope, you can start with the logical model.
Logical data model
This model shows more detail than a conceptual model and defines operational and transactional entities. The logical model is independent of the technology in which it will be implemented.
Physical data model
One or more physical models may be developed from each logical model. The physical models must show enough technological detail to produce and implement the actual database.
As systems grow, it can be difficult to capture every operational detail in a single, readable visual. If necessary, you can use more than one chart and create different levels of ERDs as needed. Smaller systems, on the other hand, can often be easily represented.
Limitations of ER diagrams and models
ER diagrams and models aren’t the best fit for every type of database. Here are several reasons they may not be the right visual for your use case:
-
Only for relational data: The sole purpose of ER diagrams is to show relationships between entities, so they aren’t the right choice for designing non-relational databases.
-
Not for unstructured data: Unless the data is cleanly delineated into different fields, rows, or columns, ER diagrams are probably of limited use. The same is true of semi-structured data because only some of the data will be useful.
-
Difficulty integrating with an existing database: Using ER models to integrate with an existing database can be a challenge because of the different architectures.
Relatedly, if your primary persistence layer is non-relational, you may need a different modeling approach than a classic ERD.
How to create a basic ER diagram
-
Purpose and scope: Define the purpose and scope of what you're analyzing or modeling.
-
Entities: Identify the entities that are involved. When you're ready, start drawing them in rectangles (or your system's choice of shape) and labeling them as nouns.
-
Relationships: Determine how the entities are all related. Draw lines between them to signify the relationships and label them. Some entities may not be related, and that's fine. In different notation systems, the relationship could be labeled in a diamond, a rectangle, or directly on top of the connecting line.
-
Attributes: Layer in more detail by adding key attributes of entities. Attributes are often shown as ovals.
-
Cardinality: Show whether the relationship is one-to-one, one-to-many, or many-to-many.
If you’re diagramming a large system, consider splitting the work into multiple diagrams (for example, one conceptual overview plus one or more physical models) to keep each visual readable.
How to create an ER diagram in Lucidchart
-
Open a new Lucidchart document
Create your diagram from scratch or save time by starting with one of Lucidchart’s premade ER diagram templates. The important thing is to show the level of detail necessary for your purpose. You might want to draw a conceptual, logical or physical model, depending on the detail needed.
-
Enable ERD shape libraries
Click More shapes on the left side of the editor, and ensure that the Entity Relationship box is checked in the shape libraries list.
-
Drag and drop shapes
Start adding shapes to the canvas to represent all your entities and relationships by clicking on the desired shape, and dropping it where you want it. Make sure all your entities and relationships are labeled and that your diagram supports all the data you need to store.
-
Connect shapes
Click on any shape and then drag a line out from one of the circles that appears to connect it to any other shape, so you can show the relationship between entities. Watch for redundant entities or relationships. And if you're troubleshooting a database problem, watch for holes in relationships or missing entities or attributes.
-
Share your ER diagram
Because ERDs are visual and standardized, they can also serve as a collaboration artifact that teams review and refine together. You can easily share your network diagram with others either via email, Slack, or shareable link. Click Share in the top-right corner of the screen, and a pop-up will appear. Choose how you'd like to share your diagram and set the appropriate level of permissions.
Entity Relationship Diagram (ERD) Tutorial in Lucidchart - Part 1
Entity Relationship Diagram (ERD) Tutorial in Lucidchart - Part 2
Everything you need to make a diagram
Make a polished, professional diagram for free with Lucidchart. No matter what you have in mind, we have the tools you need to build it. Make an account and start diagramming today.
Sign up free