Key takeaways
-
A kinship diagram maps family relationships and lineage for genealogy and anthropology.
-
Standard symbols show gender, marital status, and descent using circles, triangles, squares, and specific lines.
-
Place ego at the center and map ancestors above, siblings beside, and descendants below.
-
Use color or style to reflect descent rules such as patrilineal or matrilineal systems.
-
Lucidchart offers templates and collaborative tools to help you build and customize kinship charts quickly.
There are many ways to define “family.” The dictionary offers a few suggestions, including “a group of individuals living under one roof and usually under one head” and “a group of persons of common ancestry.” Princess Diana famously said, “Family is the most important thing in the world,” and if you have seen Lilo & Stitch recently, you know that “family” means that no one gets left behind or forgotten.
For those wishing to further explore the dynamics between family members, from individuals who’d like to better understand their heritage to anthropologists who study the norms and values of various societies, a kinship diagram could come in handy. Read on to learn how to make a kinship diagram.
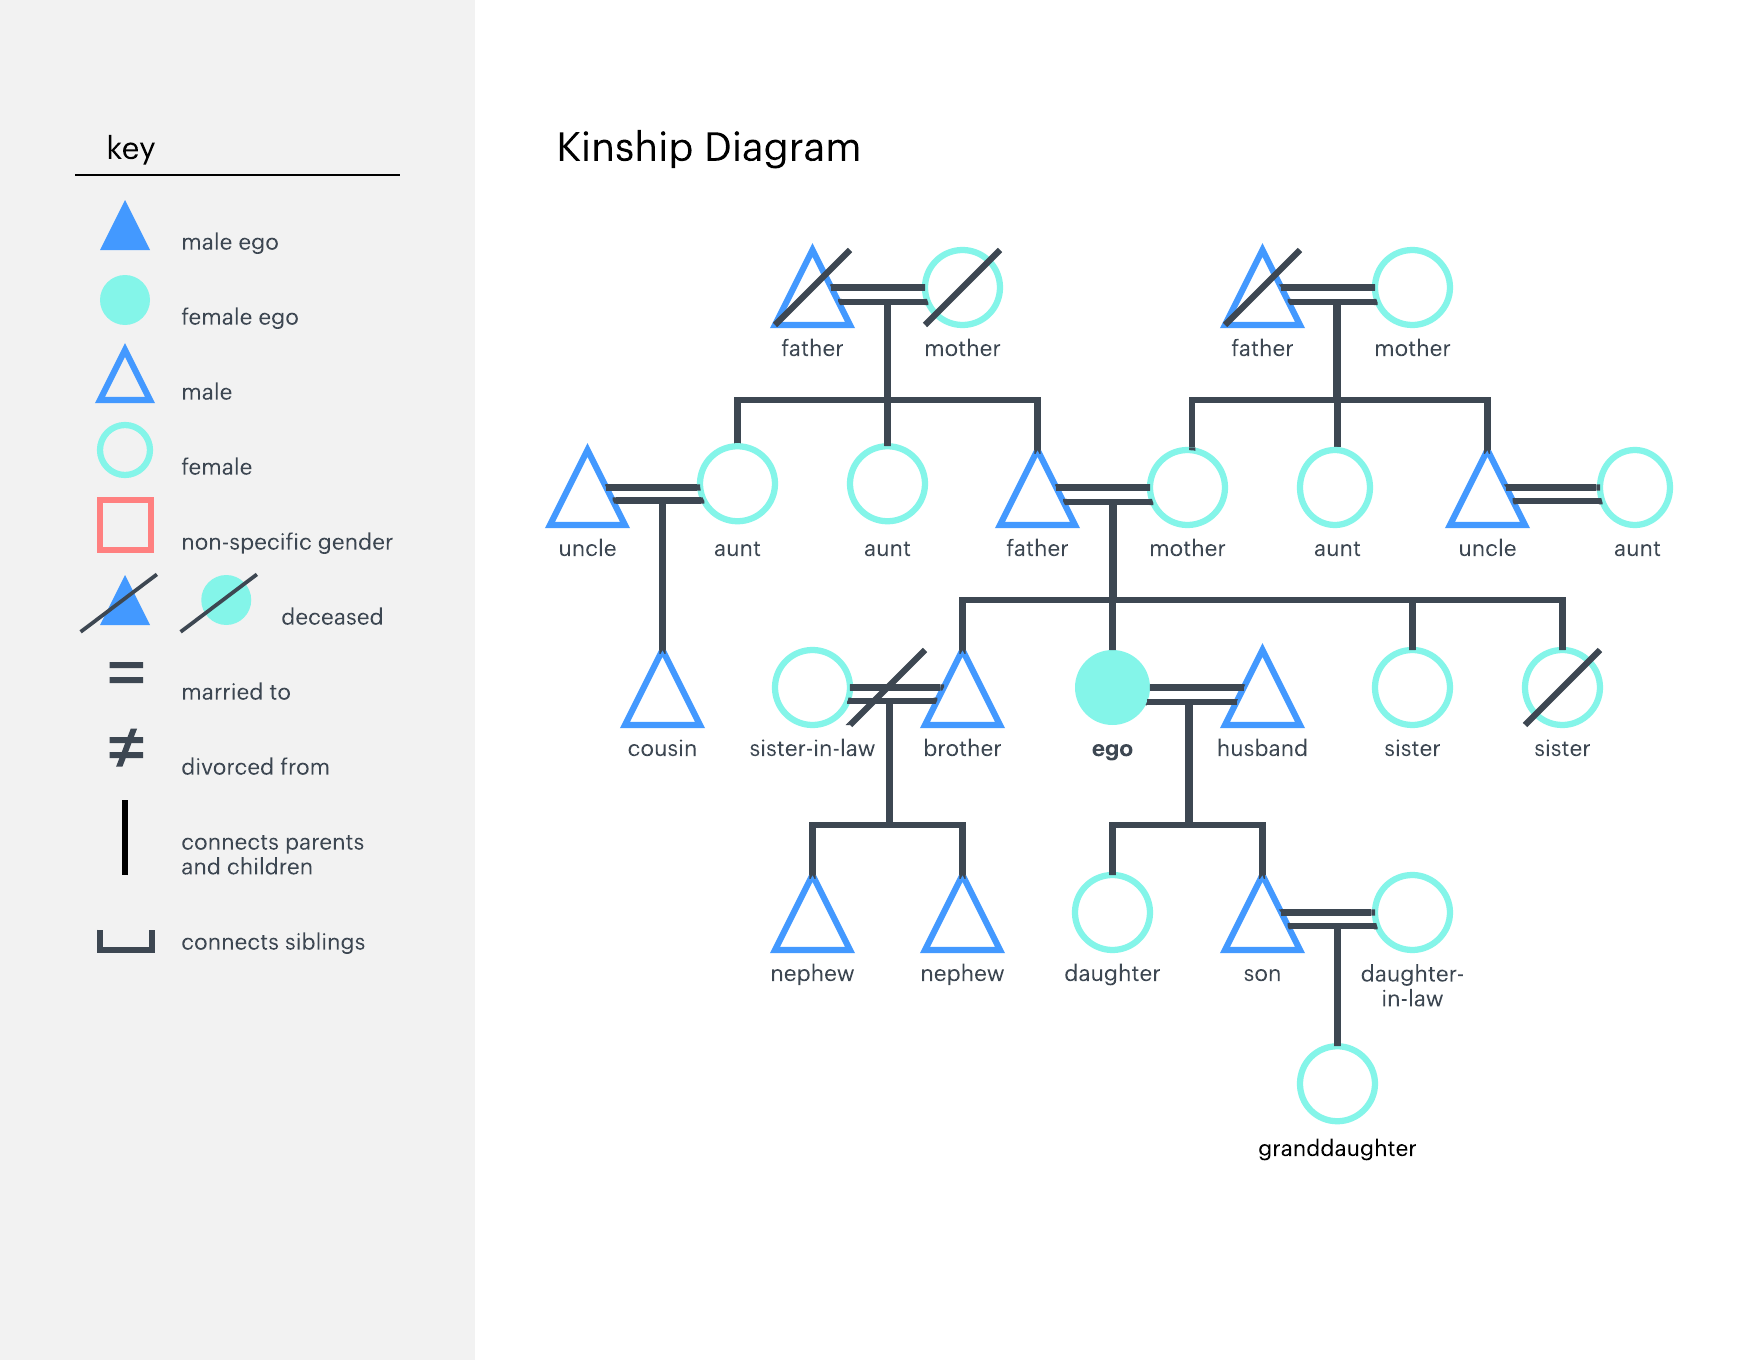
What is a kinship diagram?
Kinship diagrams, also called kinship charts, illustrate relationships. You can use a kinship diagram to visualize your lineage, similar to a family tree chart or a pedigree chart; however, kinship charts are more commonly used by anthropologists to quickly map relationships as they interview people and to present a culture’s kinship pattern without showing specific names.
Kinship diagram symbols
Before you get started, you’ll need to know the language of kinship diagrams. All kinship charts use the same basic symbols, shown below, to represent individuals and social organizations. Don’t get this confused with family tree symbols, which look similar but hold different meanings than kinship diagram symbols.
People
 | Use a circle for a female. |
 | Use a triangle for a male. |
 | Use a square for someone who identifies as neither sex or both sexes. |
 | Place a line through the appropriate symbol if the individual is deceased. |
Marriage and cohabitation
 | Use an equal sign between two individuals to indicate a marriage. |
 | Use an approximately equal sign (≈) to indicate a cohabiting couple who are not married. |
 | Use a similar sign ( ̴) to symbolize parents who are neither cohabiting or married. |
 | Use a not equal sign (≠) if a marriage ended in divorce. |
 | If the individual has been married twice, use equal signs on both sides of the symbol, with the first spouse on the left. |
 | If the individual has been married more than twice, draw lines connecting the spouses below the symbols. |
Descent
 | Use a solid line, straight down from the marriage or cohabitation symbol, to indicate biological descent. |
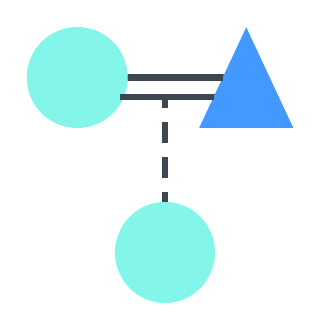 | Use a dotted line to indicate adoptive descent. |
 | If you don’t know the parents of an individual, indicate common descent between brothers and sisters by drawing a bar above the symbols. |
How to make kinship diagrams
Once you’ve got the symbols down, it’s simple to create your kinship diagram online, especially in an intuitive, collaborative platform like Lucidchart. To avoid starting from scratch, check out our kinship diagram template.
1. Add Ego to the center of your page
Designate one individual, identified as Ego, as the starting point of your kinship diagram. Most kinship diagrams use a different color or style to highlight Ego. For example, in our template above, Ego is the only symbol filled in with color.
2. Add Ego’s kin
Using the kinship chart symbols described above, add in the relationships that you’d like to visualize. Record Ego’s parents and ancestors above Ego, Ego’s siblings at the same level as Ego, and Ego’s children and descendants below Ego.
If you’re using Lucidchart, the majority of shapes you need are available in our flowchart and shape libraries to the left of the editor. You can also copy and paste special characters (such as the non-equal sign) from the Internet or your word processor.
3. (Optional) Change colors or style based on descent rules
Though you can stop there, you might want to customize your kinship diagram a bit further to explain the culture you’re diagramming. For example, you could track descent rules, or the cultural recognition of children as kin. Cultures generally follow one or two decent systems:
- Cognatic descent system (non-unilineal descent): Traces relations through both the father and mother.
- Bilateral descent system: Considers both sides of the family as relatives.
- Ambilineal descent system: Requires children to choose either the mother’s or father’s side of the family to consider relatives.
- Corporate descent system (unilineal descent): Recognizes only one family line as kin.
- Patrilineal descent system: Recognizes the father’s line as relatives.
- Matrilineal descent system: Recognizes the father’s line as relatives.
On your kinship diagram, you can use different colors to show the paternal or maternal family lines to clarify these social relationships.
4. (Optional) Write out relationships
If your kinship diagram has become too extensive, or if you want to make familial relationships 100% clear, you can add a tag below each shape to show its relationship to Ego. Some kinship charts use shorthand for common terms, such as “M” for mother and “B” for brother.
Get started with a kinship chart template
Whether you’re charting out your own lineage or attempting to trace historical families, it's easy to create your own kinship diagram. Save time when you use a kinship diagram template or family tree template in Lucidchart. Our intuitive platform offers plenty of options to customize your diagram just the way you want it.

Everything you need to make a diagram
Make a polished, professional diagram for free with Lucidchart. No matter what you have in mind, we have the tools you need to build it. Make an account and start diagramming today.
Sign up free