Helping financial teams visualize their data
Demystify financial data, maintain secure documentation, and proactively communicate with stakeholders—all in a collaborative space.


Unify data for informed decision-making
Aggregate data, reports, and insights in a central hub, fostering collaboration, transparency, and data-driven decisions.
How finance teams use Lucid

Map complex processes

Collaborate on strategic plans

Present insights to stakeholders

Create dynamic org charts

Optimize financial processes with dynamic documentation
See more solutions
Explore use casesPopular integrations for finance teams
Connect Lucid with the apps you use most, and keep your teams and systems working together.


Slack
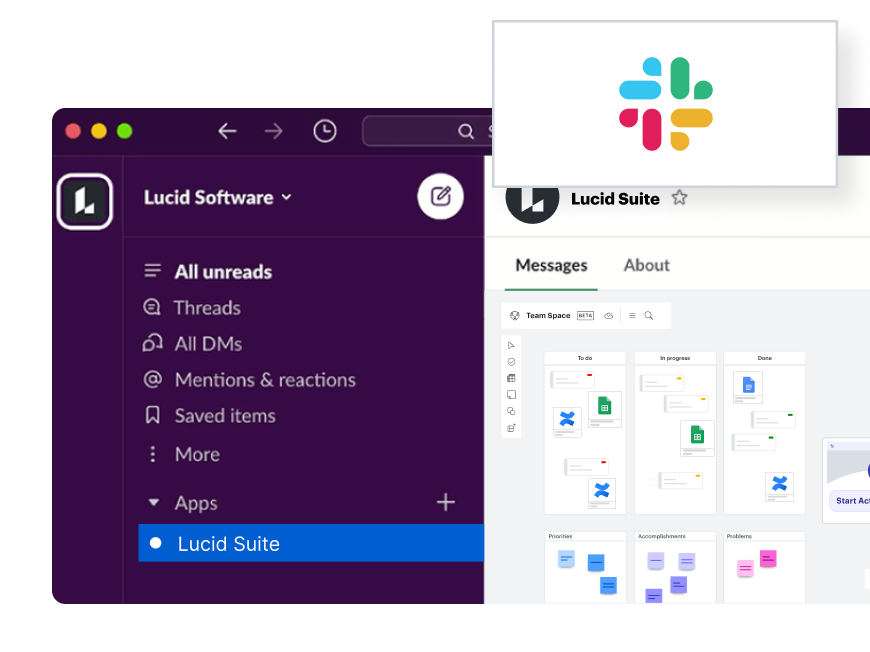
Bring visual collaboration into Slack conversations while easily responding to comments left for you in Lucid
Jira
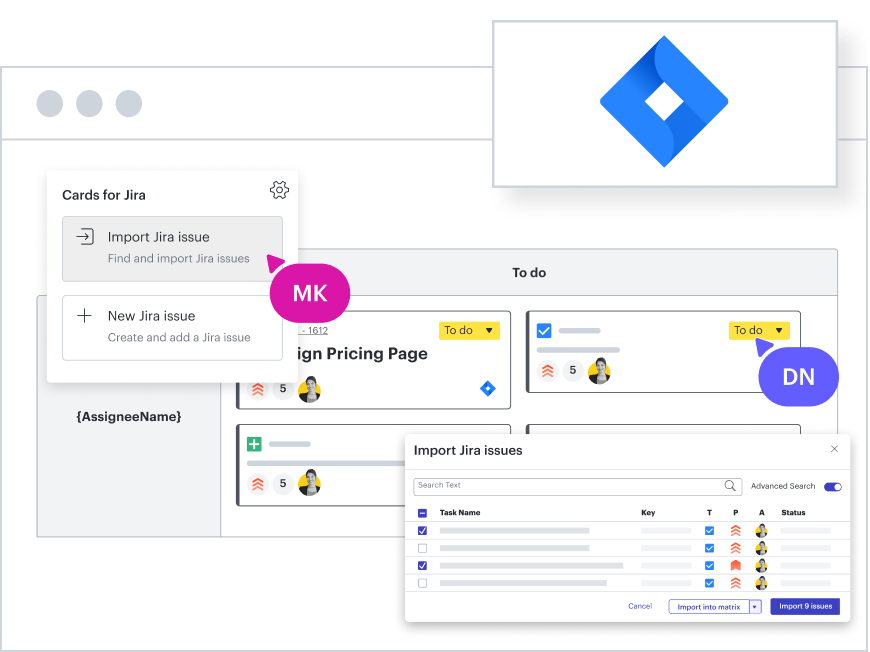
Improve communication and increase clarity by attaching Lucid documents to Jira issues
Confluence
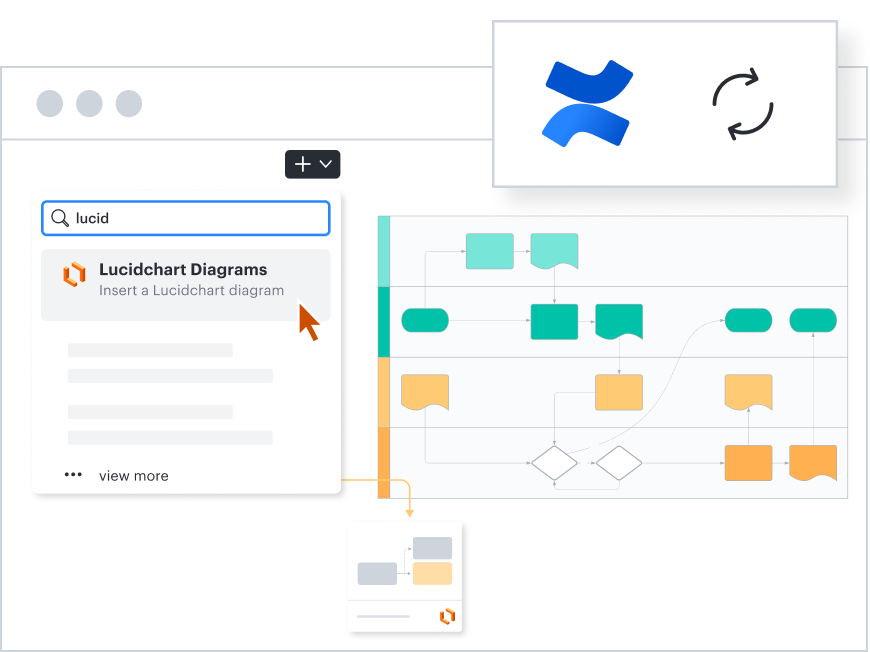
Collaborate and communicate more effectively by adding visuals to Confluence pages

Slack
Bring visual collaboration into Slack conversations while easily responding to comments left for you in Lucid
Jira
Improve communication and increase clarity by attaching Lucid documents to Jira issues
Confluence
Collaborate and communicate more effectively by adding visuals to Confluence pages
Additional resources
I am a Lucidchart user that was interested in the new Lucidspark offering. I used Lucidspark with my operations team in brainstorming sessions to identify pain points and inefficiencies in the financial servicing of one of our products.
Lucid for everyone
Give every team in your organization a better way to work—visually.