Getting projects over the finish line on time and within budget requires clear organization and communication. But when you're juggling all those tasks and responsibilities—especially across projects that take weeks or months—sometimes things get lost in the shuffle.
That's why project managers rely on tools like PERT charts and Gantt charts. These diagrams help managers keep track of tasks, roles, responsibilities, and project timelines. With so many moving parts and deadlines to plan and track, having a clear way to scope and monitor work can make the difference between a smooth delivery and a schedule slip.
But which one should you use, a PERT chart or a Gantt chart? In this article, we'll compare the Gantt chart vs. PERT chart and highlight the differences between them so you can choose the right tool for the job.
What is a PERT chart?
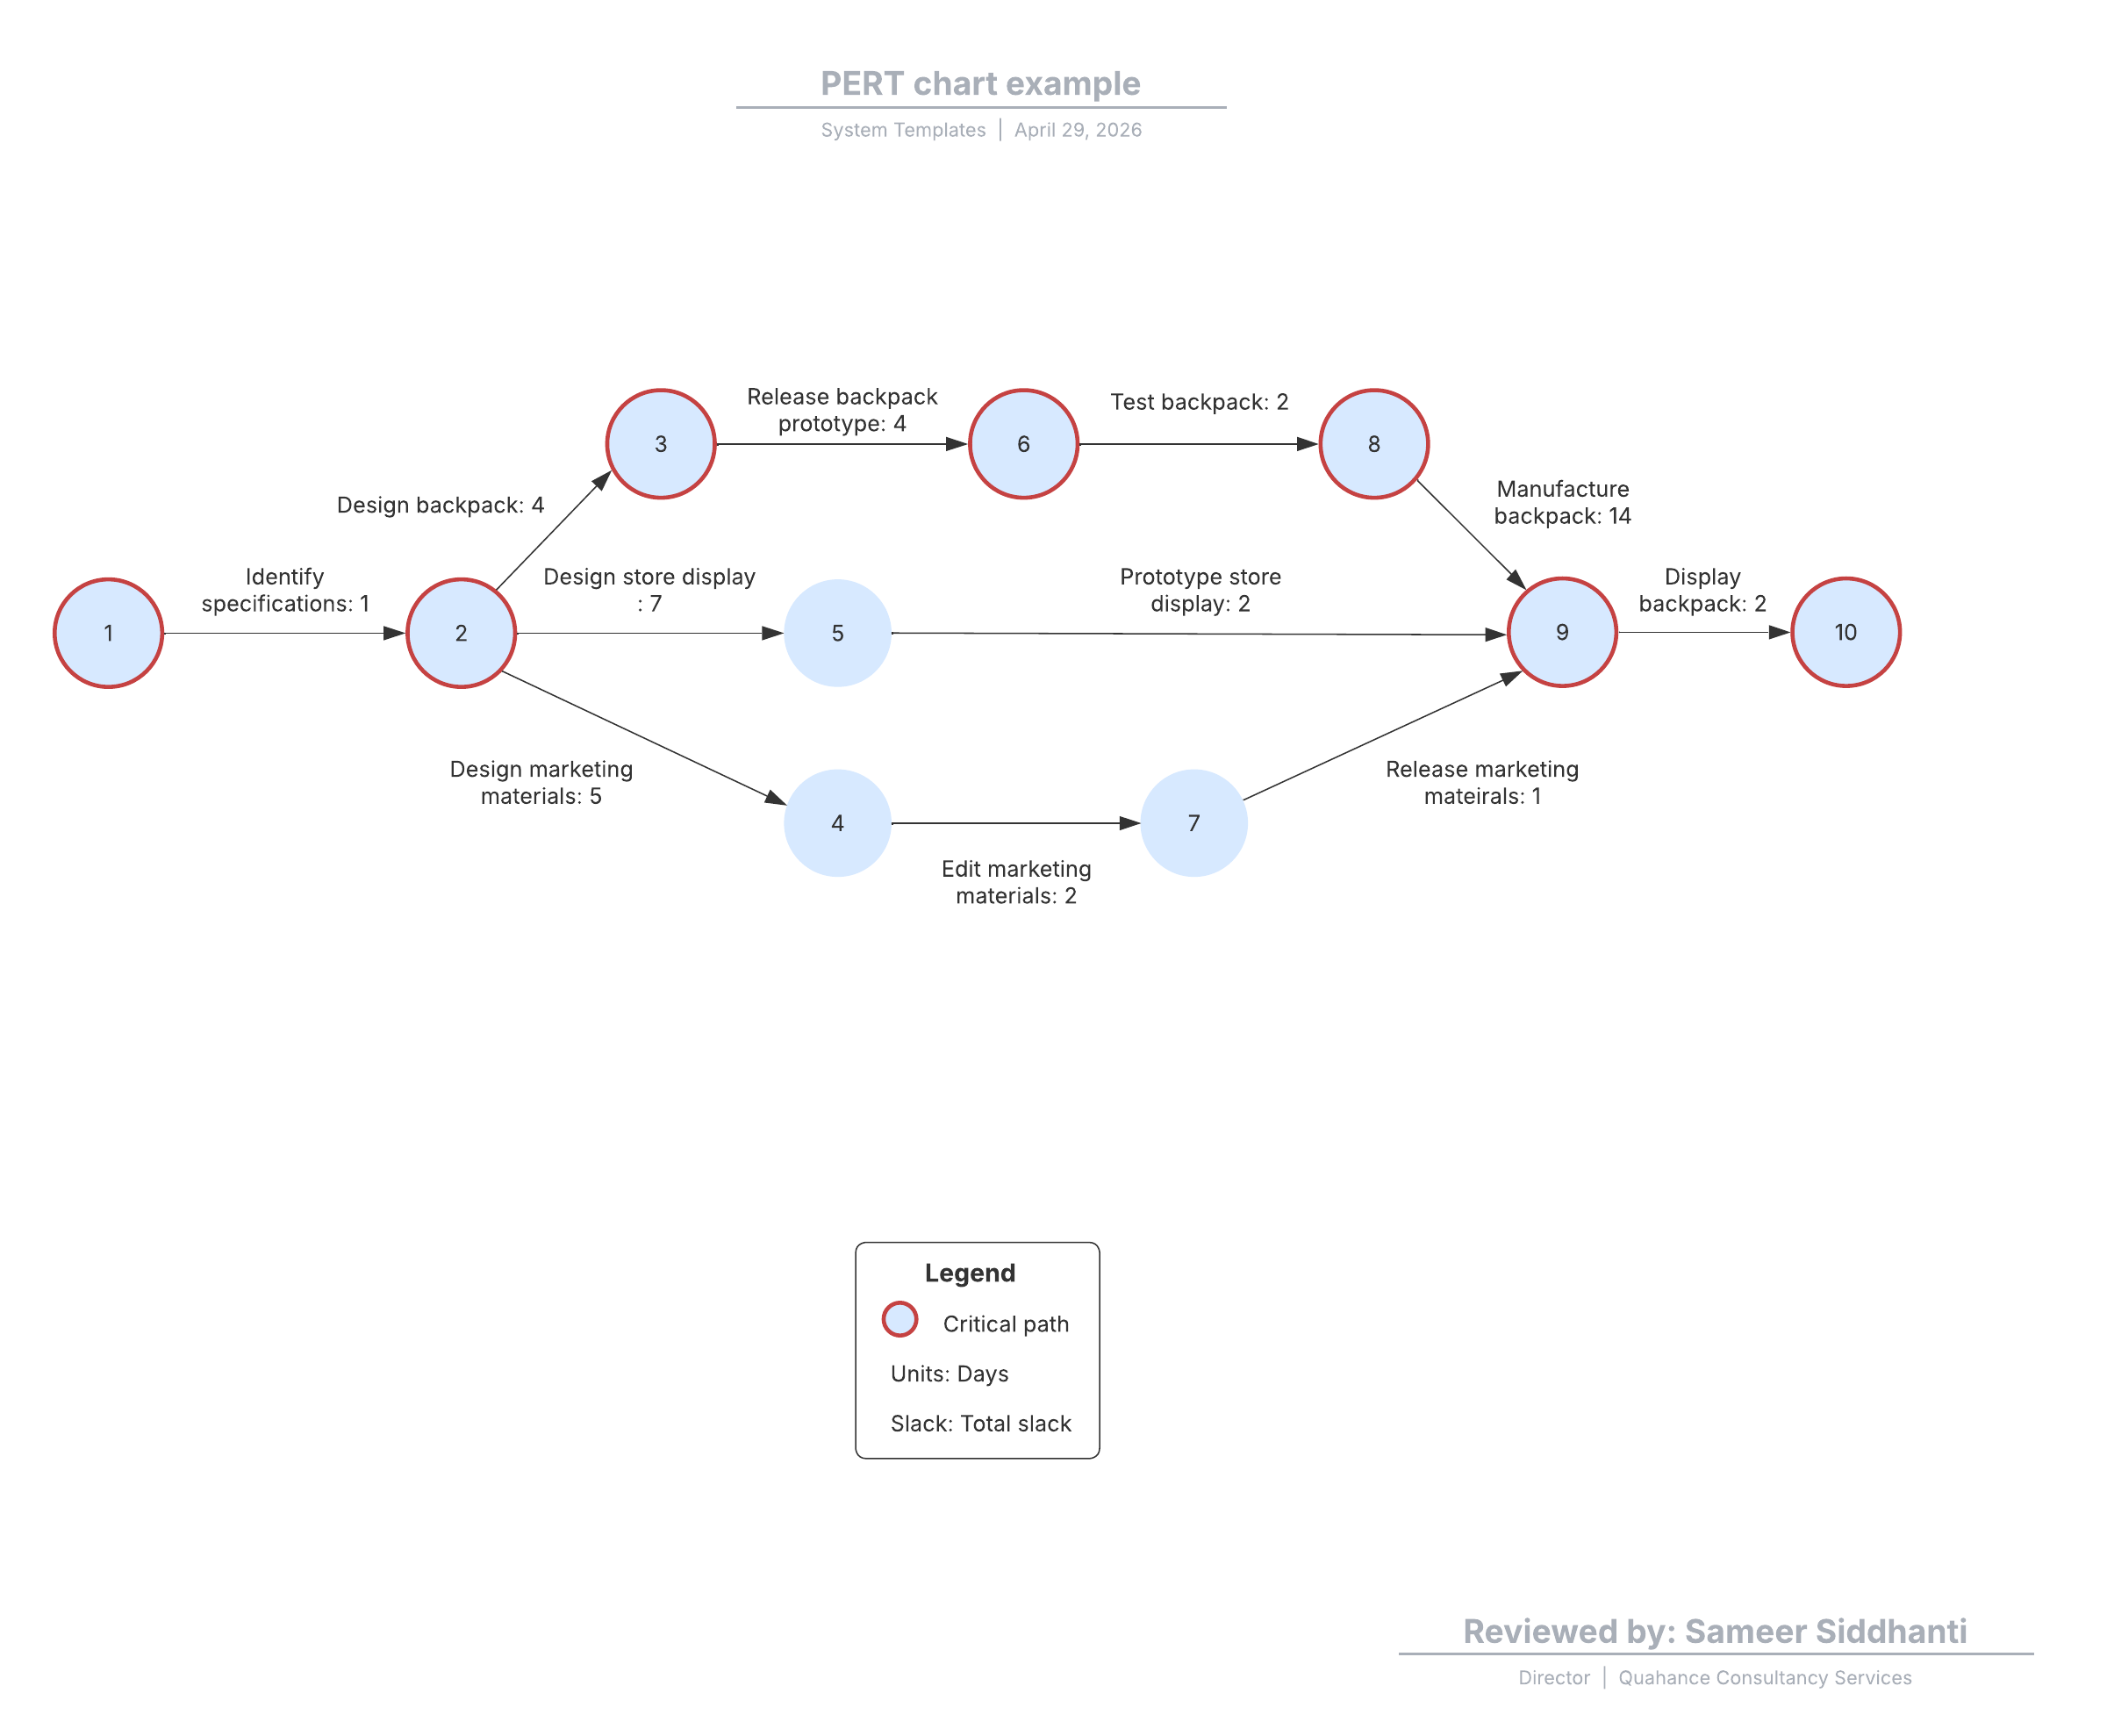
A PERT (Program Evaluation and Review Technique) chart represents a project as a network diagram, mapping its tasks, activities, and dependencies.
The U.S. Navy created PERT charts in the 1950s to simplify the planning and scheduling of complex projects as it developed the Polaris missile. A PERT chart works as a roadmap for a project, helping managers identify key dependencies, prioritize tasks effectively, assess risk, and plan their time accordingly.
PERT is most useful in large-scale projects where time is the primary factor rather than cost, as it provides estimates based on optimistic, pessimistic, and expected timelines.
Within the diagram, each box or node represents an individual task. These nodes are then connected by arrows that illustrate the dependencies between those tasks. The traditional PERT chart (also known as an activity-on-arrow diagram) contains two main elements:
-
Nodes: Represent events or milestones in your project. You can use either numbered circles or numbered boxes.
-
Arrows: Represent tasks, or the work necessary to reach project milestones. The direction of the arrows shows the sequence of tasks. Diverging arrows indicate that you can complete those tasks concurrently.
The chart also includes three options for mapping activity duration: most likely, optimistic, and pessimistic. These describe three estimates for each task's duration to help project managers plan the timeline based on their best guess (most likely) and more optimistic and pessimistic forecasts. By averaging the three timeline estimates, the PERT approach accounts for uncertainty to predict realistic deadlines.
When to use a PERT chart
PERT charts are most useful for effectively scoping the project before you start.
You can use a PERT chart to gauge the minimum time necessary to complete the project. Knowing how long a project will take is fundamental to successful project planning and execution. If you underestimate the time required to complete tasks, bottlenecks will quickly develop and throw a wrench in your progress.
Project delays can significantly impact budgets and client (or user) relationships. By plotting tasks onto the PERT chart, you can easily see how related tasks connect and impact each other and how long each task will take to complete. This creates a clear workflow for everyone to follow.
You can also use PERT charts to coordinate and prioritize multiple simultaneous tasks. By mapping out task dependencies in an easy-to-digest visual, project managers can quickly see how different elements relate and understand what needs to get done and when. This is especially useful for larger, complex projects with many moving parts. PERT charts help managers plan tasks by identifying what needs to be done first and which tasks can be done in parallel to maximize efficiency and workflow.
PERT charts make it easier to prioritize tasks and coordinate when they need to get done—while appropriately planning the resources needed to support them. We recommend using a PERT chart template to make the diagramming process easier, rather than starting from scratch.
Keep in mind: PERT charts are about big-picture planning. While they can be used during the project's implementation to track progress, PERT charts are not flexible enough for teams to adapt to small changes when team members encounter roadblocks.
How to set up a PERT chart
Follow these steps to create a PERT chart:
-
List your project's main phases, milestones, and tasks in nodes.
-
Identify the sequence of activities, tasks, and milestones.
-
Connect task dependencies with directional arrows to visualize the project flow.
-
Determine the completion time for each activity, including the earliest start date, earliest finish date, and planned time to complete.
-
Map the PERT chart.
If you're building a traditional activity-on-arrow PERT, you'll follow the same basic flow—capturing activities, mapping dependencies, and adding time estimates—while representing milestones as nodes and work as arrows.
Once you have your criteria drawn up, you can use the PERT chart to determine the project’s critical path. The critical path is the longest sequence of tasks required to complete the project. If any of these critical tasks are delayed, the entire project will be set back. Remember that you're not looking for the path with the most activities: You're looking for the path with the activities that will take the longest. Add together the time it takes for each activity, and you'll know how long the entire project should take. Now refer to your PERT chart to ensure that you finish your project by the deadline or to adjust the times as circumstances change.
What is a Gantt chart?
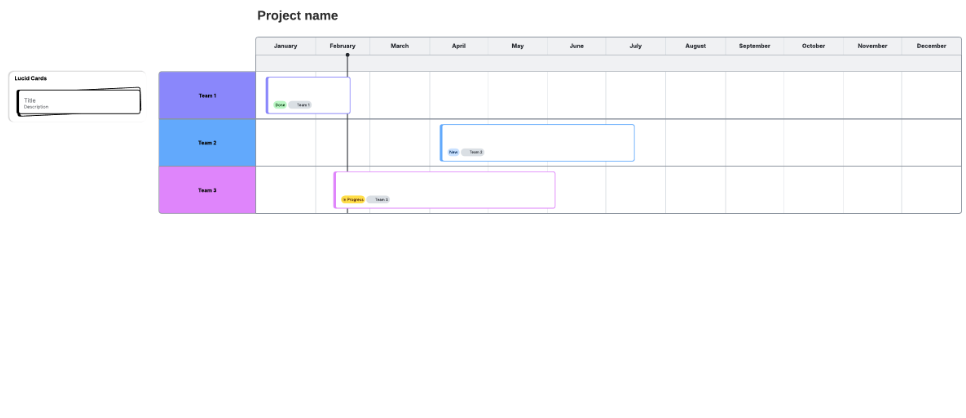
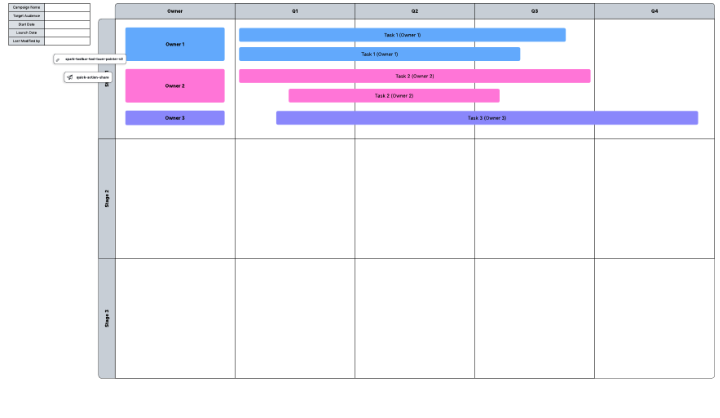
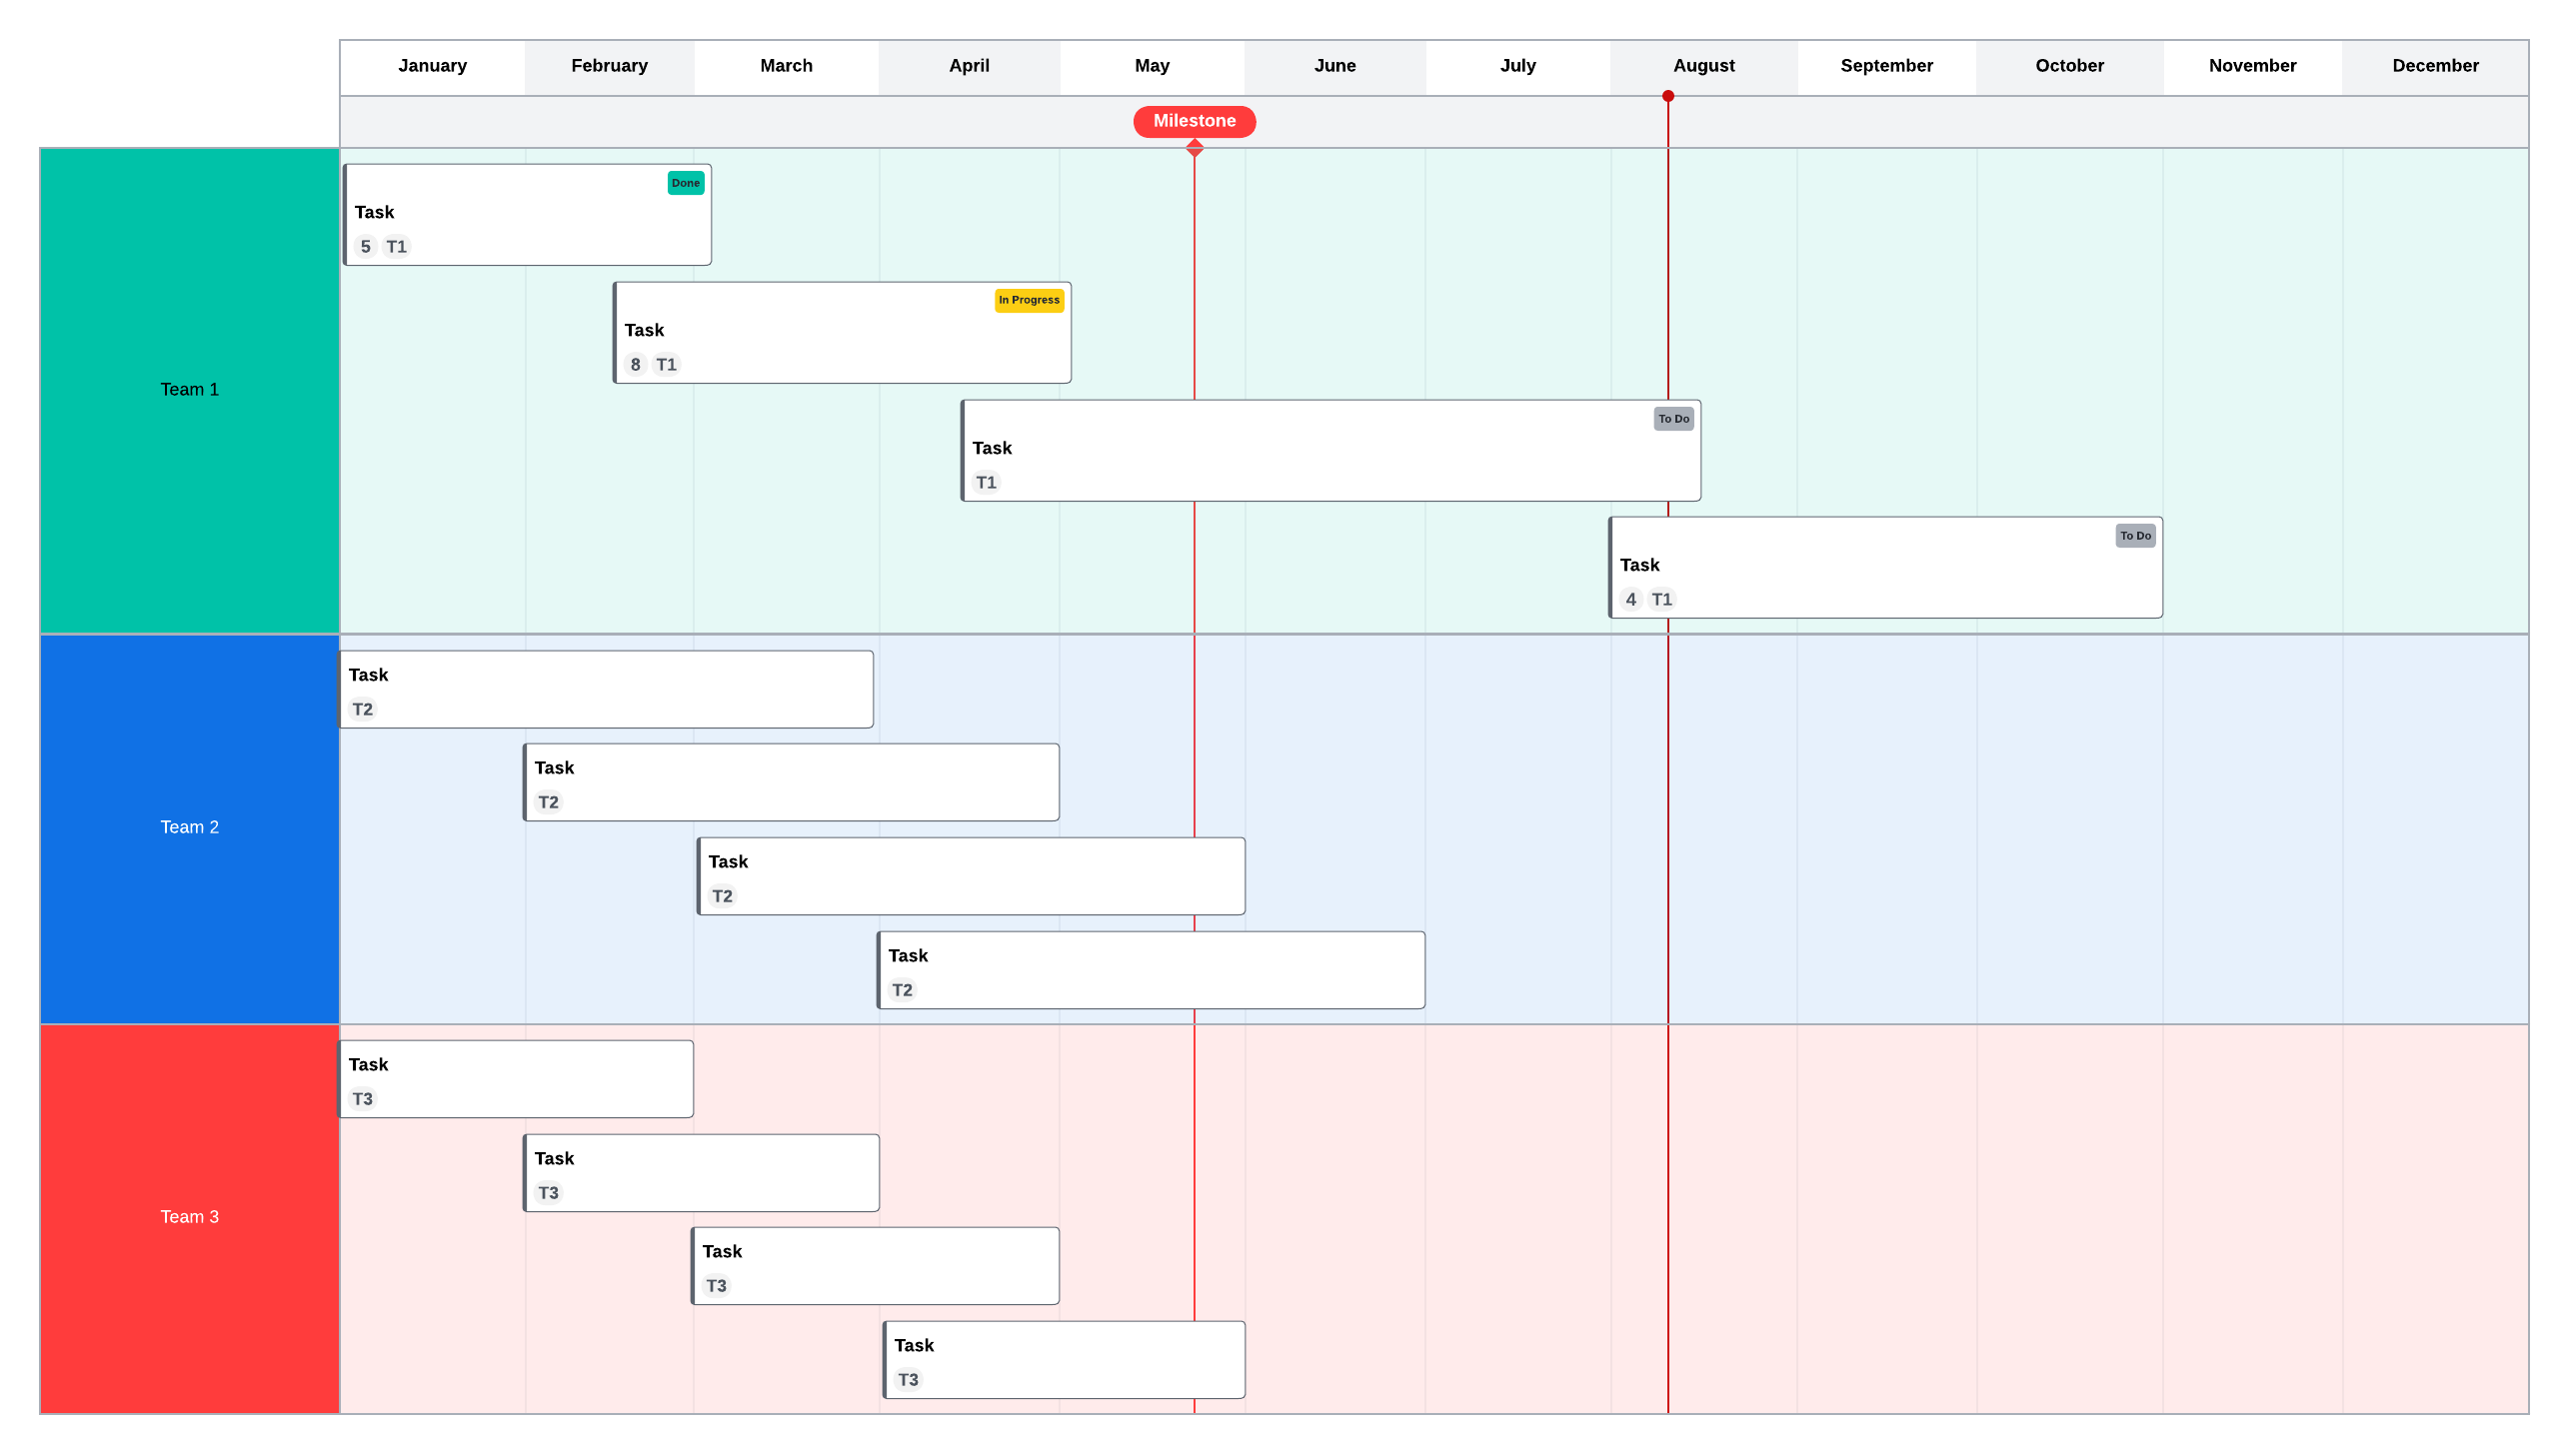
A Gantt chart is a horizontal bar chart representing your project tasks scheduled over time. The vertical axis outlines the project tasks, and the horizontal axis represents time.
Created by Henry Gantt during WWI, Gantt charts are useful tools for planning your project schedule and visualizing the project tasks and schedule constraints. Gantt charts break down the project into its constituent parts, helping managers and team members quickly see who is responsible for what task and when it is expected to be completed. Because they're designed to be updated as work unfolds, Gantt charts are often used to show both the plan and how much work has actually been completed.
When to use a Gantt chart
Gantt charts are best used throughout a project to track progress and make sure every task is completed on time. Teams can use a Gantt chart to:
1. Manage tasks and milestones. Gantt charts break down the project into individual tasks set along clear timelines. Each bar represents one task, and the bar extends from the start date to the end date of that activity. This helps managers and their teams see which tasks are in progress, identify potential delays or roadblocks, and prepare for upcoming tasks so everyone stays on track.
2. Control the workload and properly leverage resources. By mapping tasks and their assigned owners, managers can more easily see how work is distributed across their team and ensure team members have the support and resources they need to do their jobs.
For example, if one person has multiple tasks assigned at once, and another team member has a light load, the manager can reallocate assignments if needed or solicit additional help on those tasks to ensure all the work gets done without causing burnout or production delays.
3. Increase transparency in the project workflow. Similarly, Gantt charts plot the entire project workflow by task and assignment, giving the entire team a clear picture of the project timeline, roles, and expectations. Increased transparency improves team communication, minimizes confusion, and helps keep everyone on the same page throughout the duration of the project.
In practice, Gantt charts are also helpful for day-to-day coordination and stakeholder communication.
Keep in mind: While Gantt charts are valuable management tools, they also require a lot of upfront work and an accurate scope to be effective.
How to set up a Gantt chart
Follow these steps to create a Gantt chart:
-
List your tasks and subtasks on a vertical axis.
-
Identify any task connections.
-
Create a timeline along the horizontal axis.
-
Order your tasks and plot them on the timeline. Each task should be represented as a bar that extends from the start date to the end date of that task's duration.
-
Assign tasks to team members.
-
Track progress.
You can set up a basic Gantt chart in Excel or use a free Gantt chart template in Lucid. Lucid makes it easy to plot, track, and share project progress.
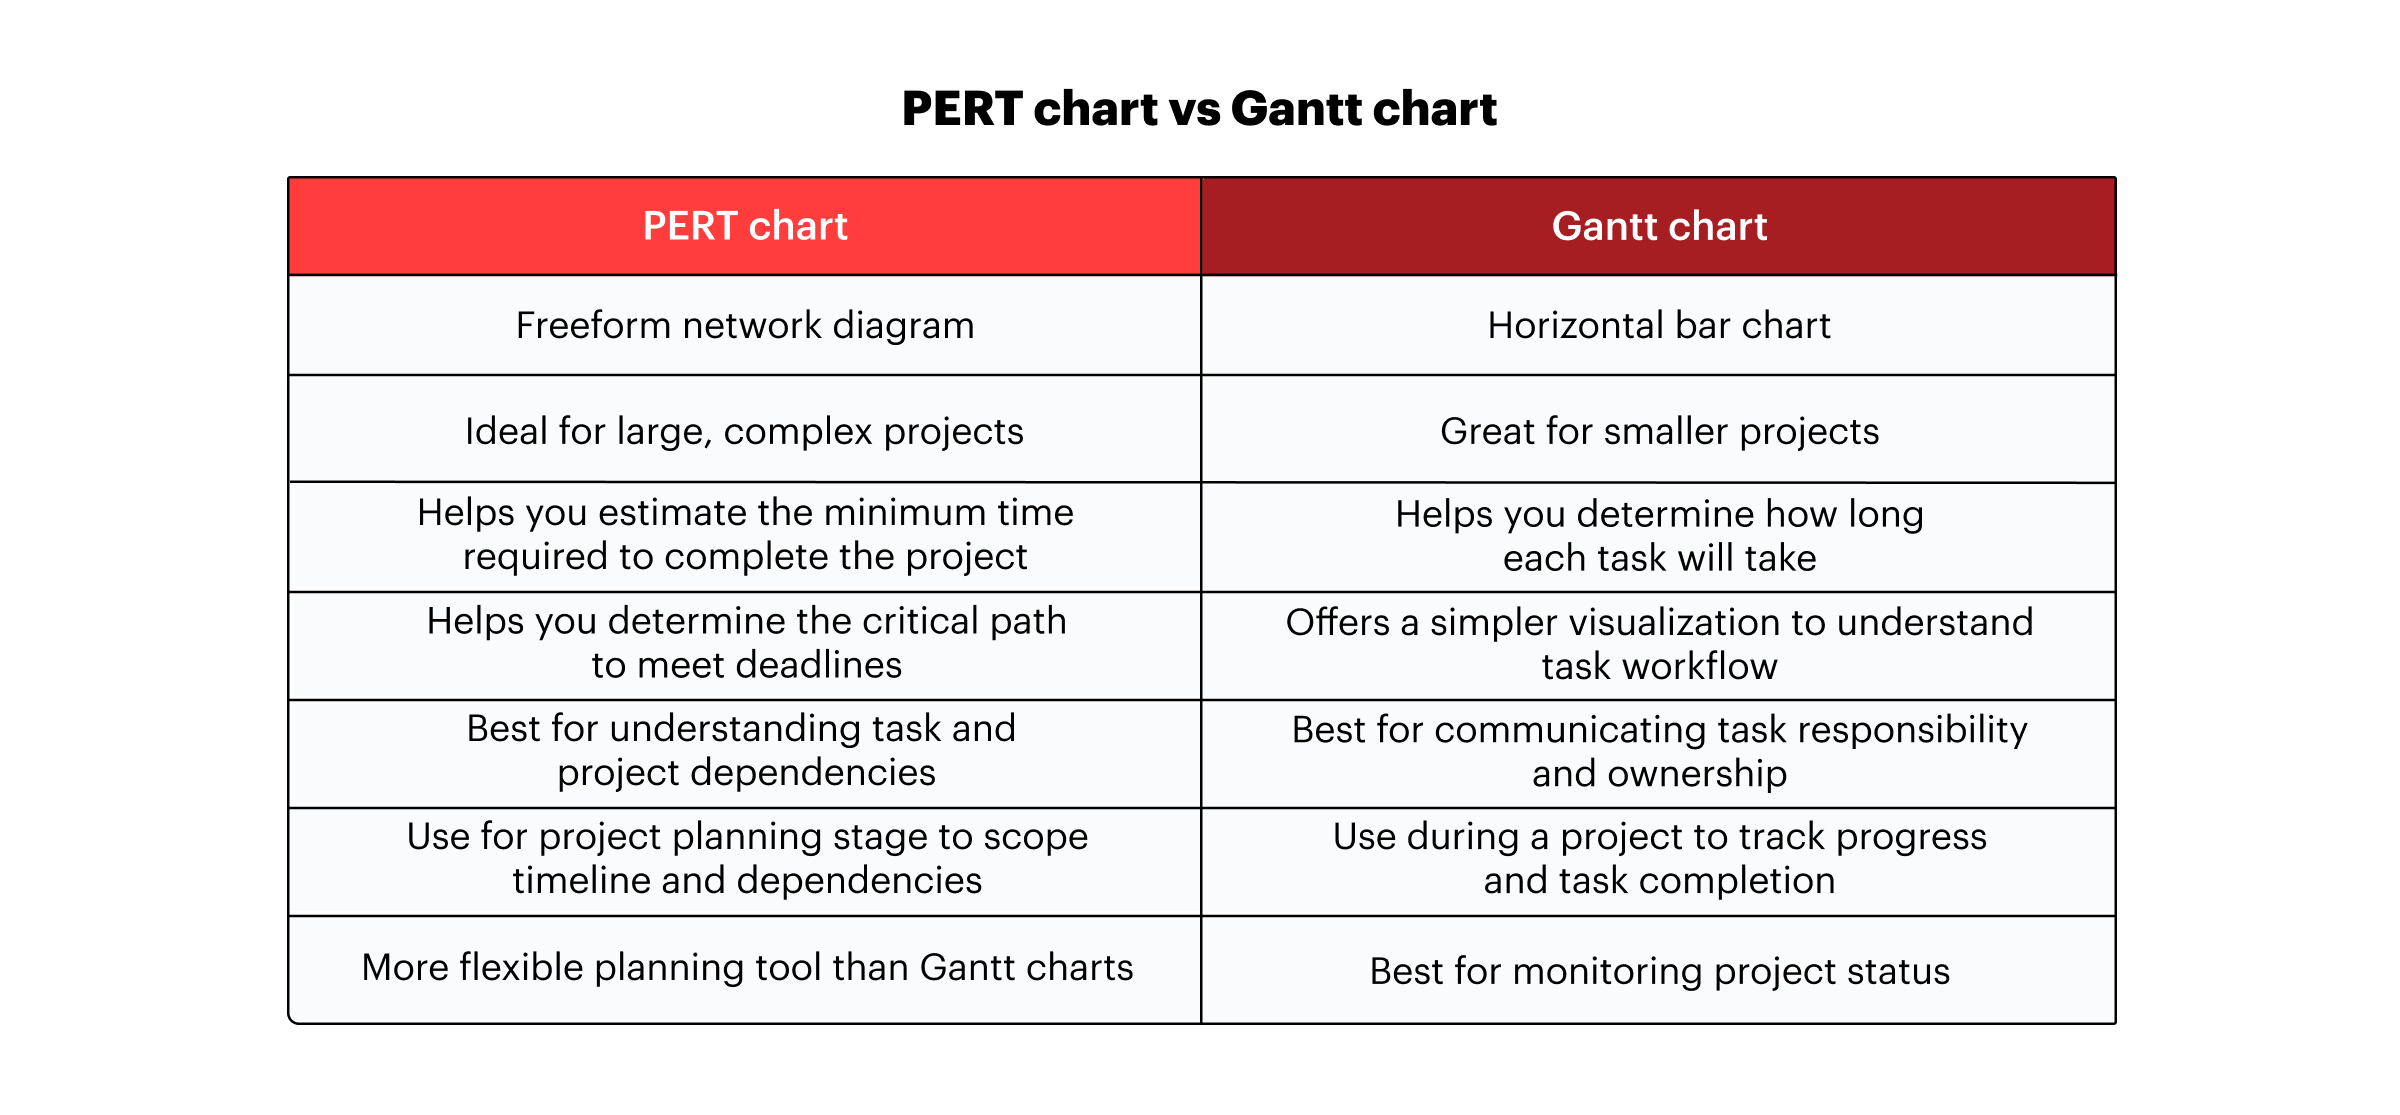
Main differences between a PERT chart and Gantt chart
Both PERT charts and Gantt charts help project managers plan and track project tasks on a clear timeline. However, there are key differences in how the charts are visually displayed and when teams can best apply them.
At a high level, the distinction comes down to planning vs. execution.
More specifically, PERT charts typically focus on the logical sequence of work and how tasks relate (including what can happen in parallel), while Gantt charts emphasize calendar-based scheduling, ownership, and progress tracking. PERT charts are generally used before a project begins to plan and determine the duration of each task, so they don't have to show the actual dates of your project. They also do a better job of showing whether certain tasks need to be completed in order or whether they can be completed simultaneously.
If you're deciding which to use, it can help to match the tool to the question you're trying to answer.
Use a Gantt chart if you need to:
-
Anticipate the amount of time needed to complete each task.
-
Clearly communicate task responsibility.
-
Increase transparency on the project's progress.
Use a PERT chart if you need to:
-
Show the interdependencies of certain tasks.
-
Anticipate how long it'll take to complete a project.
-
Determine the critical path to meet your deadlines.
-
Plan for large or more complex projects.
PERT charts and Gantt charts are both essential tools in the project manager's toolkit. By understanding the differences between each diagram and when to use them, you can improve project planning sessions and increase efficiency, transparency, and productivity throughout the project lifecycle. And in many cases, the best approach is to use both strategically: PERT to plan and de-risk the work and then Gantt to manage and communicate execution.

Everything you need to whiteboard online
Get the ultimate online whiteboard for teams. Brainstorm, plan projects, and collaborate virtually on Lucidspark’s infinite canvas.
Sign up free