Best-selling author Louise Hay said, “I don’t fix problems. I fix my thinking. Then problems fix themselves.” This quote can apply to all sorts of circumstances, including the next time that you’re unsure what your customers need from your product. Maybe you just need a new way of looking at the problem.
Let’s discuss two modes of thinking—visual thinking and Design Thinking—and the ways these two methods complement each other to help you design and produce products that delight your customers.
What is visual thinking?
Think about the last time you passed a traffic sign—you likely processed the color, shape, or icons on the sign before you processed any of the words, if it had any words at all. Traffic signs demonstrate how powerful visuals can be in communicating an idea quickly.
Stakeholders don’t understand your description of a cloud architectural design? Draw a picture to show them what you mean. You don’t need to be an artist. Simple shapes and lines can go a long way to help you convey meaning to complex ideas that words alone can’t express.
Most of us are inclined to think visually. Visuals help you process information faster and recall information for a longer period of time. They can also help you organize and form ideas, making it easier for your audience to follow your train of thought.
Common tools used in visual thinking include drawings on whiteboards or paper (physical or virtual), flowcharts, slide presentations, and so on. These visualization tools help to bring clarity to the information you present so that your audience can ask better questions, make better suggestions, and collaborate more confidently.
What is Design Thinking?
While visual thinking is the process of using pictures to organize thoughts and form new ideas, Design Thinking is an established process used to solve specific problems. It helps you to understand your customers and their pain points better. This understanding helps you to create deliverables that give them a positive user experience.
The Design Thinking process includes these five stages:
- Empathize: Design with your user in mind. Don’t just guess what they want or what they are thinking. Meet with them and ask questions. Understand their problems by getting to know your users.
- Define the problem: Use the information gathered from your customers to define the problem that needs to be fixed.
- Ideate: Brainstorm ideas that can fix the problem you identified. Record every idea no matter how big, small, complex, or simple so you can thoroughly explore all options and hone in on the right solution.
- Prototype: After deciding on a few unique solutions, build some prototypes, look at the functionality and flow, and determine which solution you should continue exploring.
- Test: Release your best solution for extensive testing.
This process is repeated as often as necessary. It’s a non-linear, iterative process—you might need to jump from the testing phase back to the defining phase or anywhere in between. You may have to go through many iterations before you release a solution that works well for most people.
Using visuals in the Design Thinking process
It’s not a huge leap to see that visual thinking can support and enhance the Design Thinking process. Designers who think visually can make connections, reveal new insights, and bring clarity to their user research and proposed solutions in order to more effectively communicate with team members, managers, and other stakeholders.
In each stage of the Design Thinking process, visuals come in handy for fleshing out ideas and helping other people to understand what you are trying to do.
Empathize
Visual thinking leads to a better understanding of your customers and how they use your products. Your visualizations can be as high-tech or low-tech as you want. Whatever gives you a clearer picture of your user experience is the right solution for you.
With that in mind, here are a few things you might want to try.
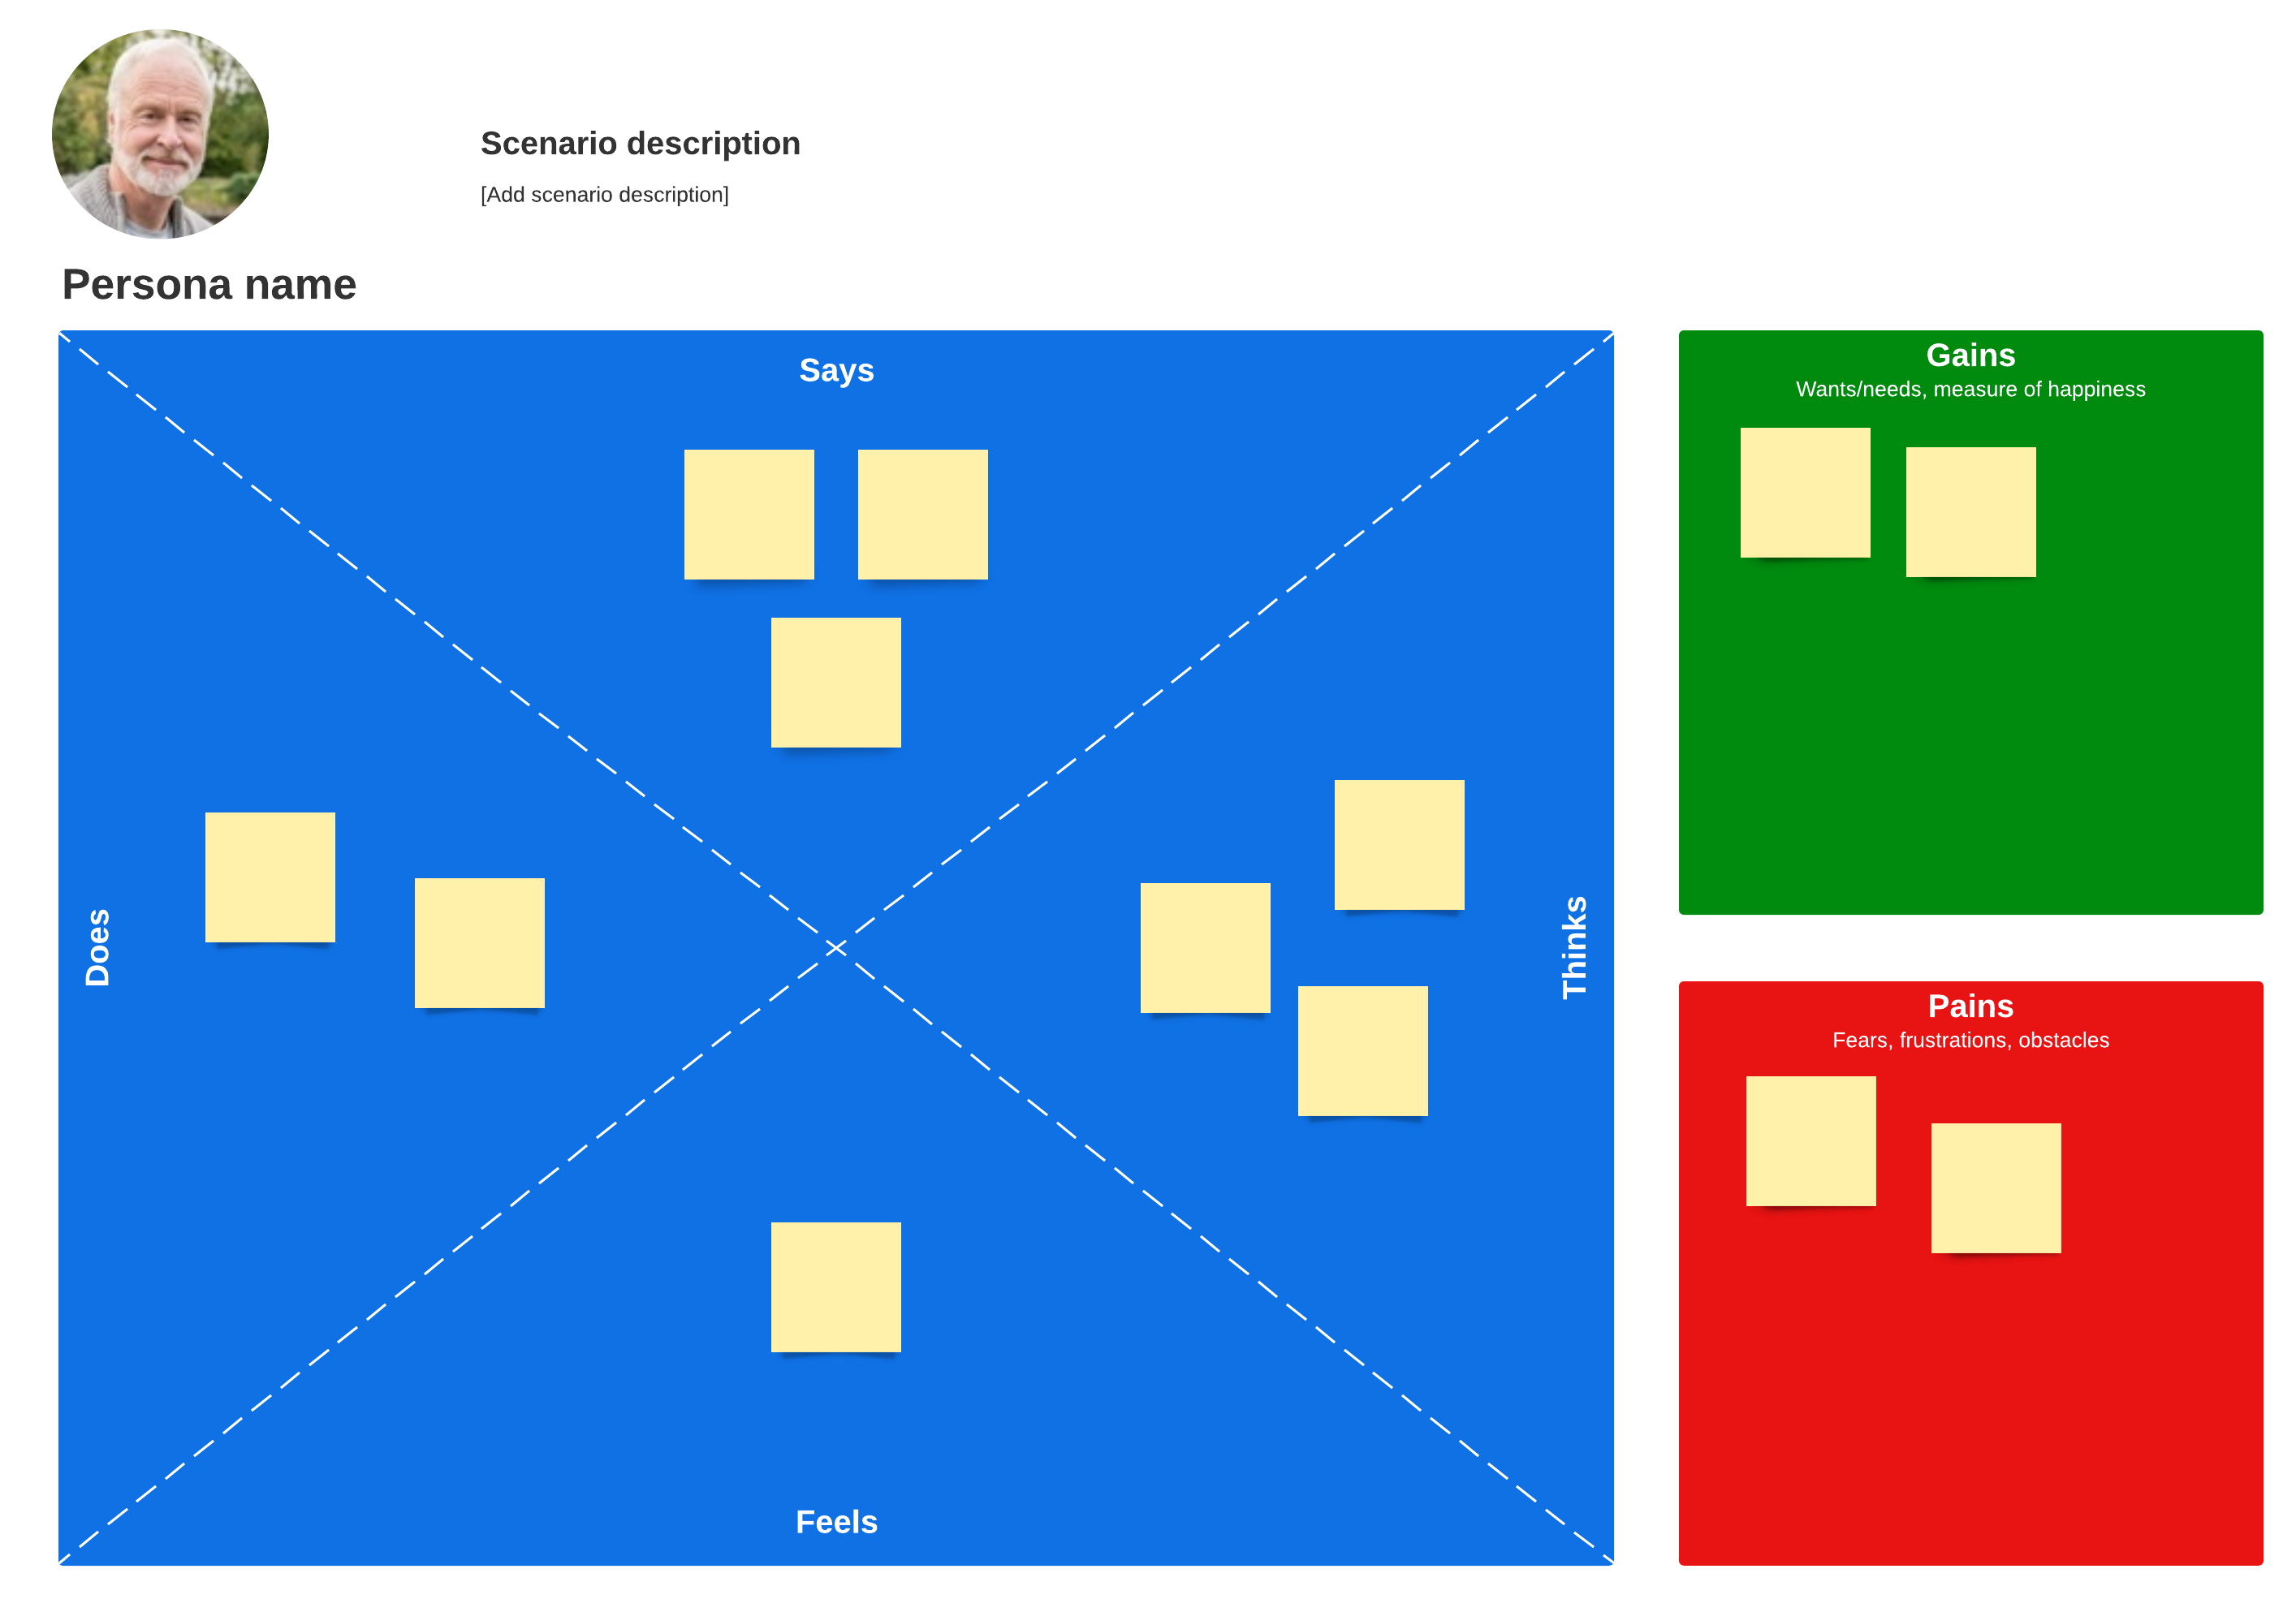
Create an empathy map
An empathy map is drawn as a square with the customer at the center. The square is divided into four quadrants that examine what the customer says, thinks, feels, and does. This map keeps you focused on what the customer needs and helps you to arrange your research data into an easy-to-read visual presentation.