Gantt chart maker
Lucidspark takes Gantt charts to the next level. Drag and drop shapes, import data, access templates, and so much more.


By registering, you agree to our Terms of Service and you acknowledge that you have read and understand our Privacy Policy.

Get started with our AI diagram generator

Simplify project management
Get started in just a few clicks with our simple, intuitive Gantt chart software.
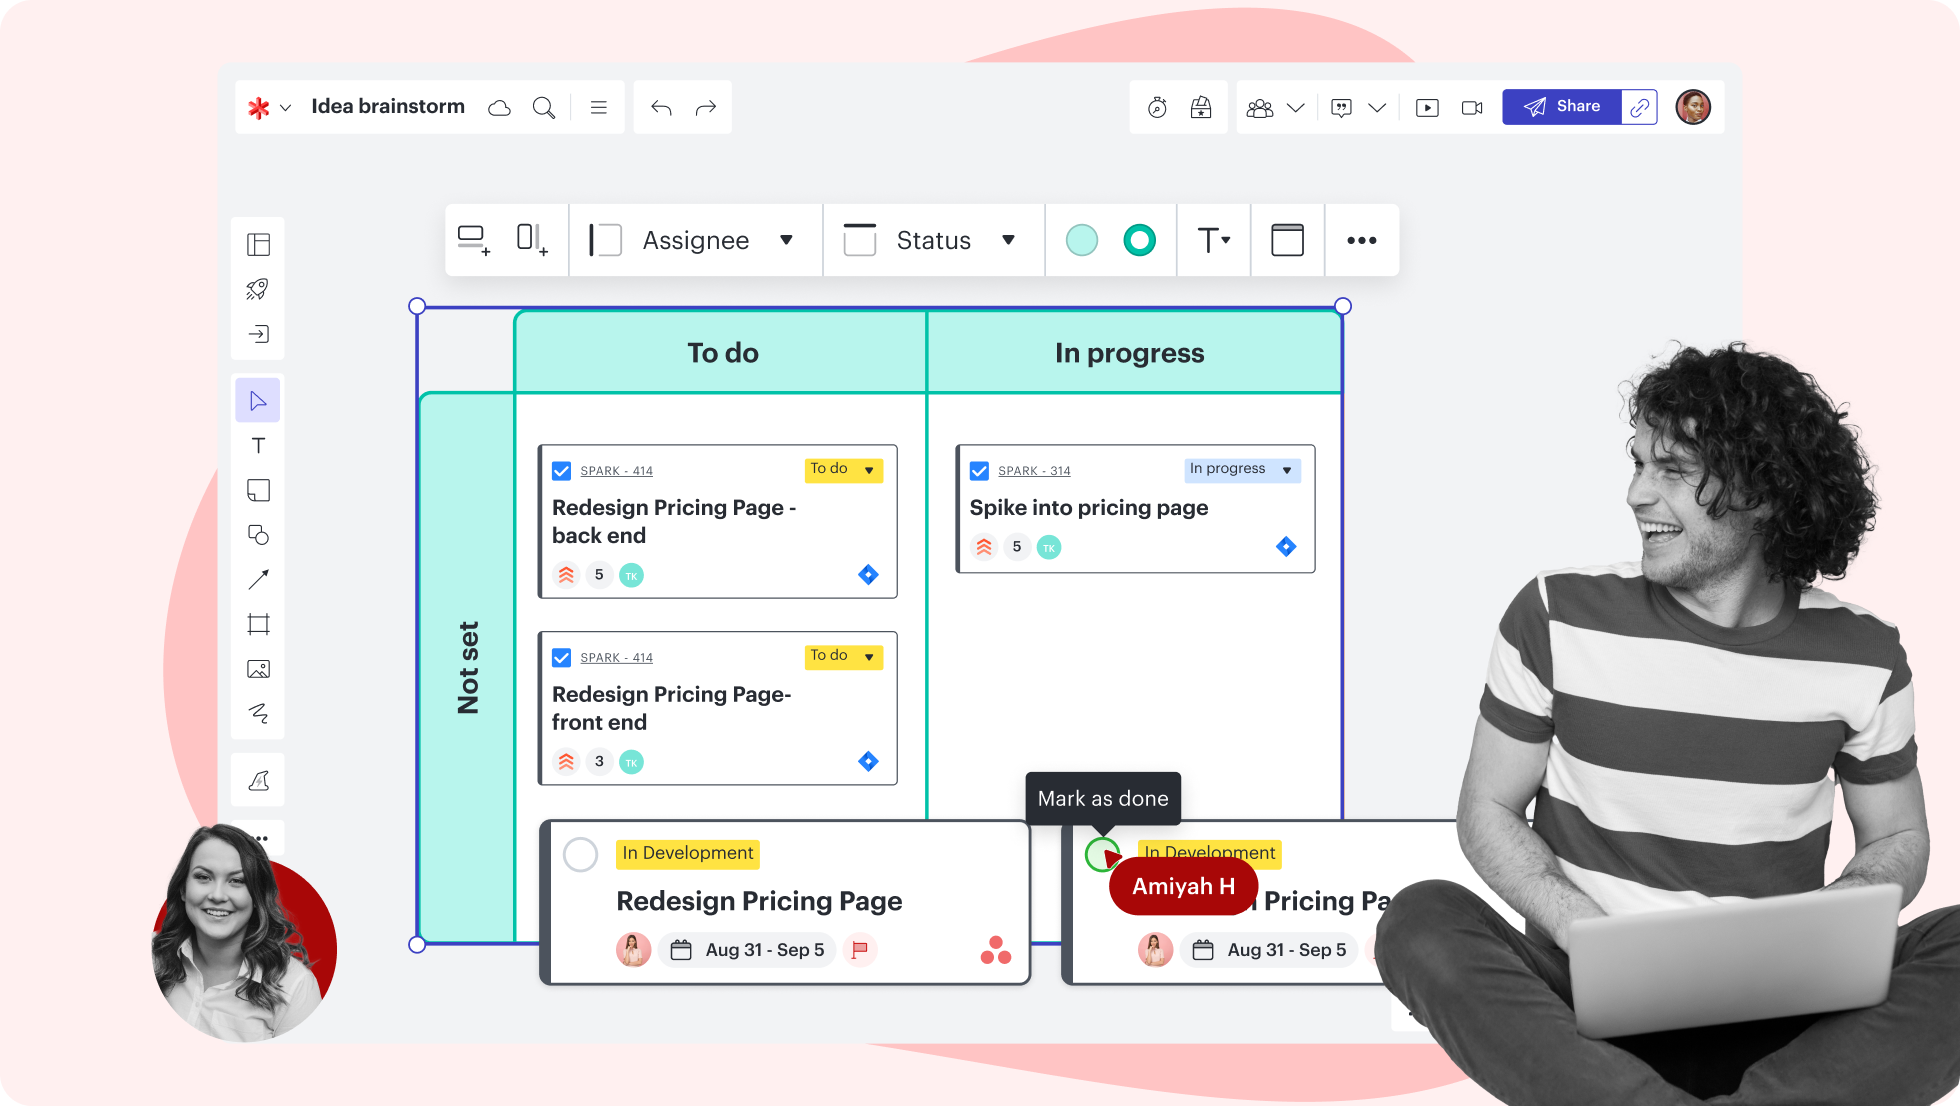
Manage project timelines effectively

Add a screen recording or video

Share with your team

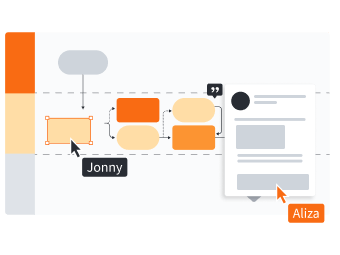
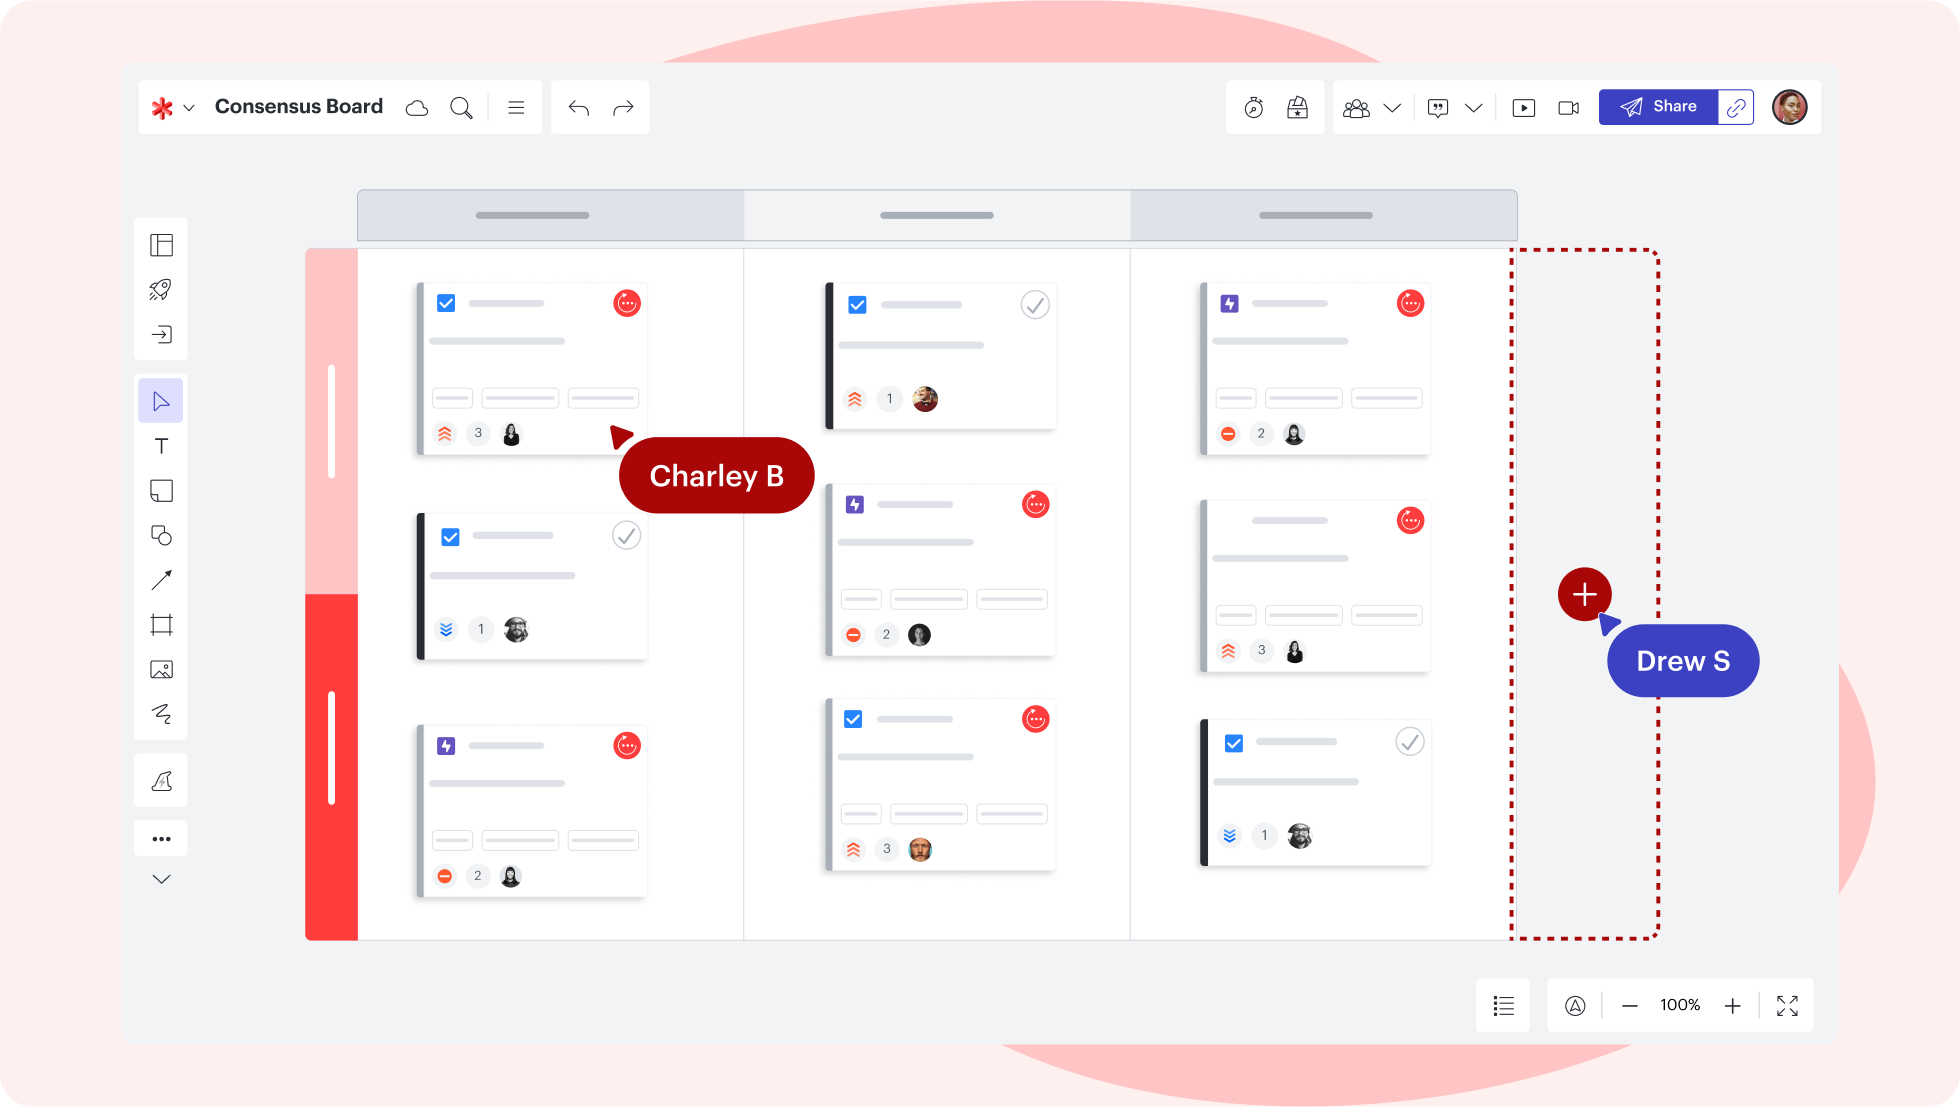
Real-time visual collaboration from anywhere
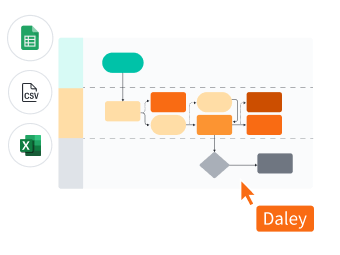
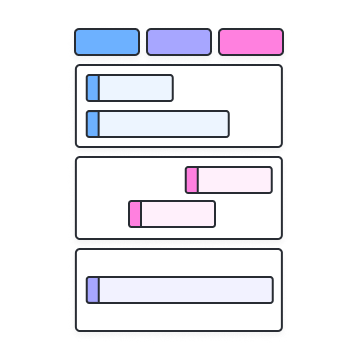
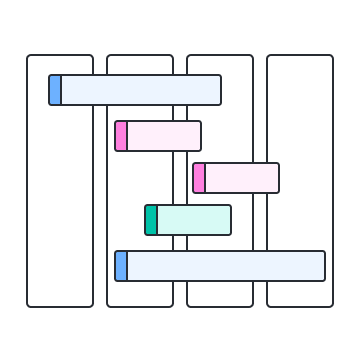
Customizable Gantt chart templates

Highly rated
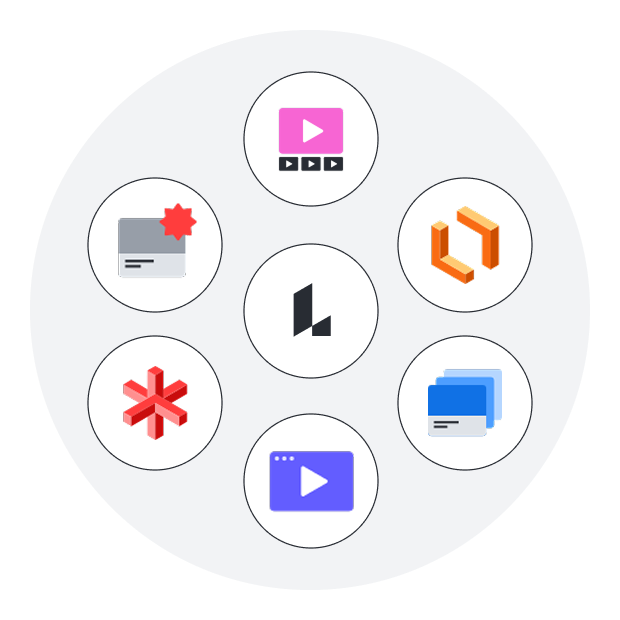
Lucidspark feature highlights
Facilitator Tools
Facilitator Tools
Dynamic Tables
Dynamic Tables
Embedded links
Embedded links
Comment, chat, react
Comment, chat, react
Breakout boards
Breakout boards
Visual Activities
Visual Activities
Timelines
Timelines


Lucidspark feature highlights
Keep your brainstorming session and your team on track with features like take the lead and timer.
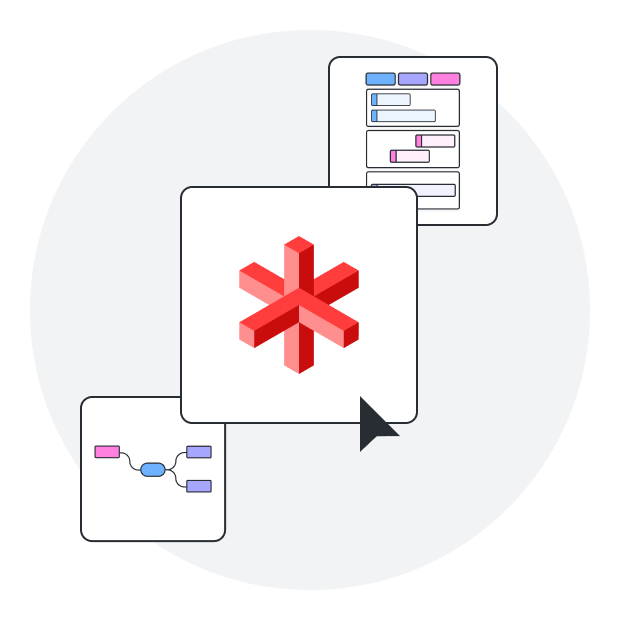
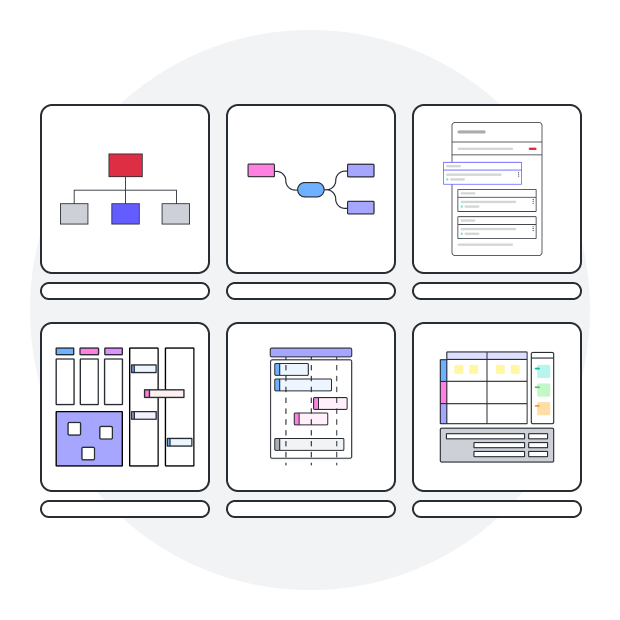
Explore 1500+ templates
Lucidchart has pre-built templates to help you started making Gantt charts, PERT charts, timelines and more
See why teams use Lucidchart as their Gantt chart creator
Diagram, visualize data, and collaborate all in one platform. Learn how in 2 minutes!
Diagram, visualize data, and collaborate all in one platform. Learn how in 2 minutes!
Why teams choose Lucidspark
As a virtual whiteboarding application, Lucidspark’s infinite canvas enables teams to move seamlessly from ideation to planning and building.

Collaboration. Bring teams together side by side on a shared canvas from anywhere in the world.
Alignment. Build transparency and shared understanding of how a team or company works.
Large-scale change. Increase visibility, standardization, and knowledge sharing across your entire org.
End-to-end workflows. Upgrade to the Lucid Suite for a complete, connected visual collaboration solution.


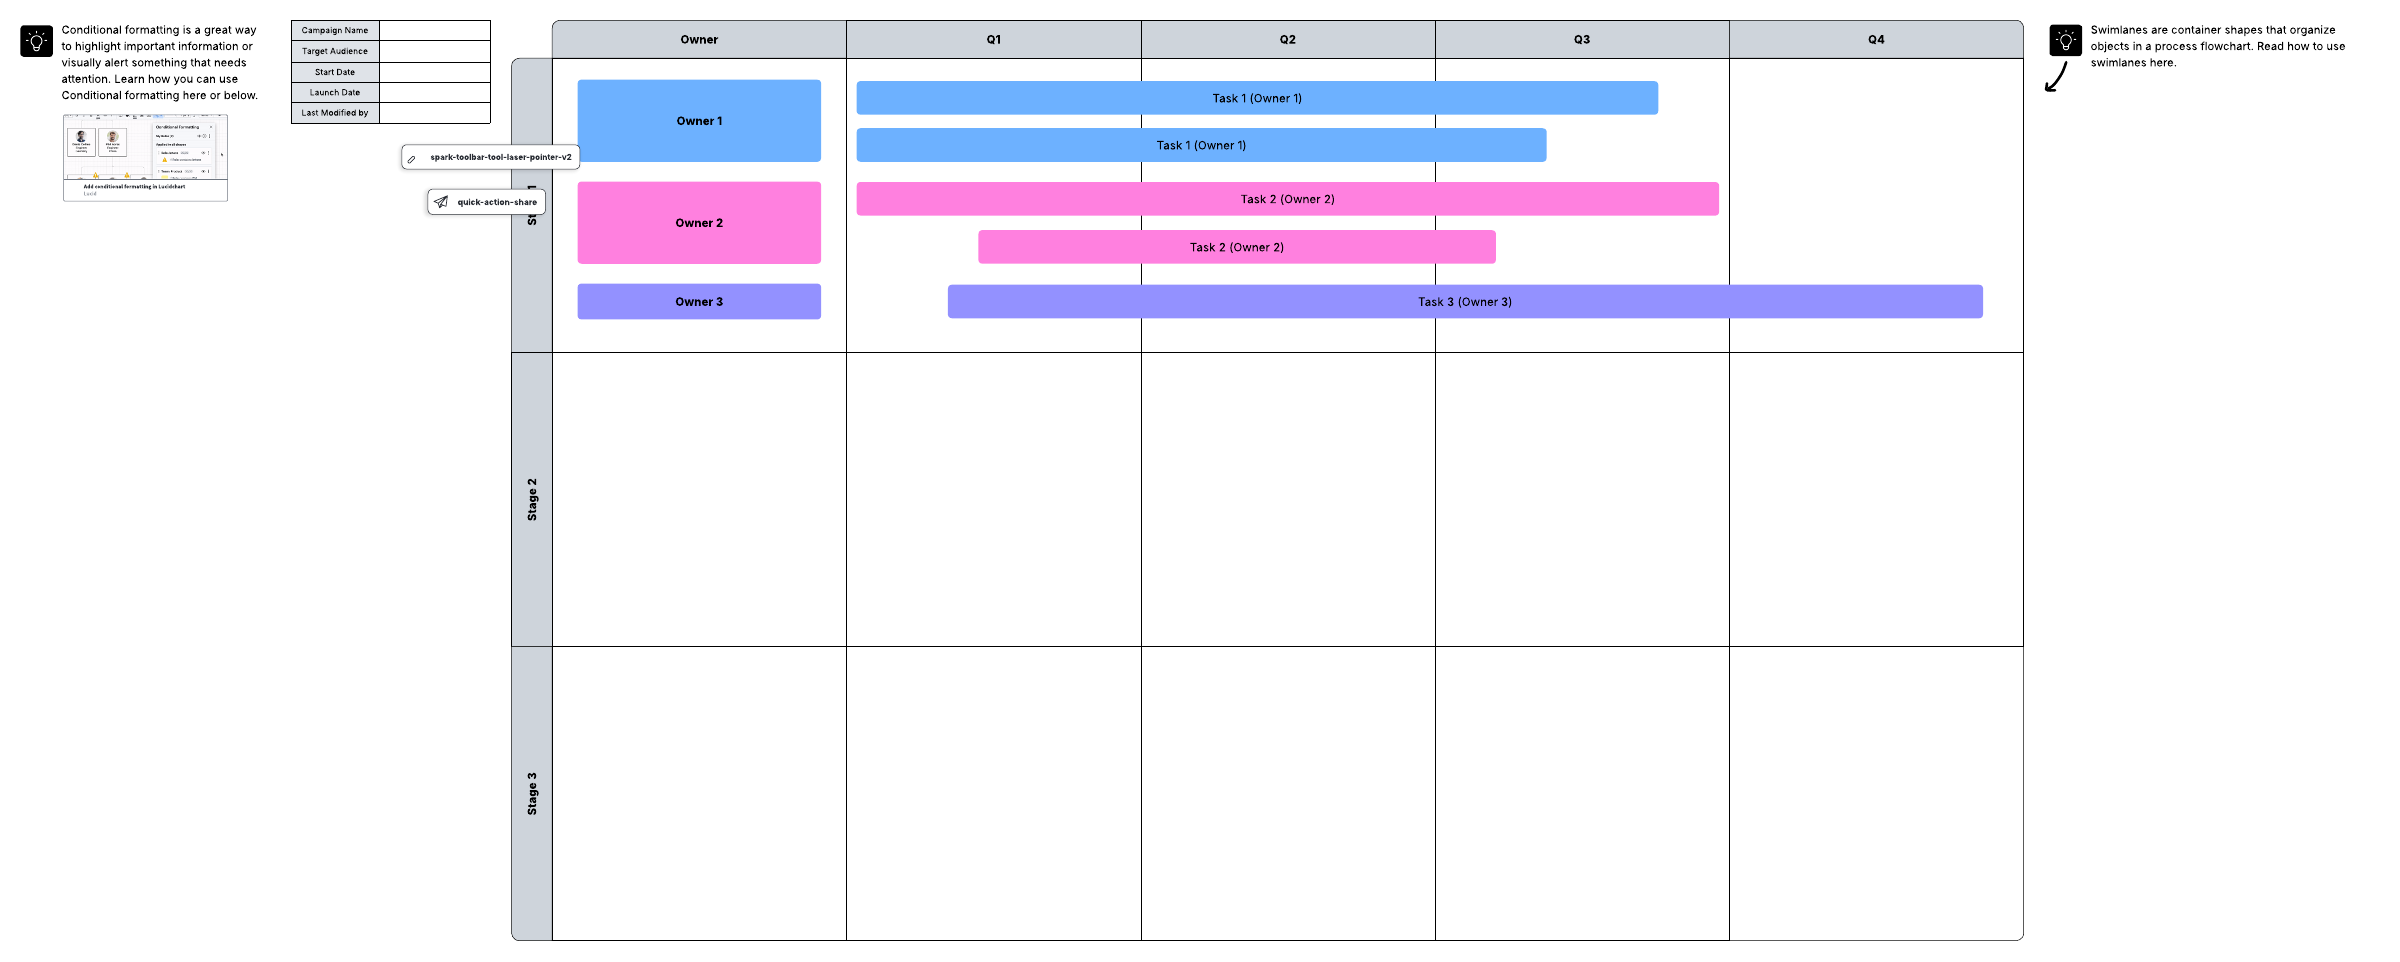
What is a Gantt chart?
A Gantt chart is used for project management to visualize all tasks from the beginning of a project to its completion. A Gantt chart lays out individual tasks and their dependencies, ownership, duration, and the expected duration of the project as a whole. With each task mapped out and assigned, your team can easily meet deadlines and ensure accountability.
How to make a Gantt chart
Gather the information needed for your project
Select a Gantt chart template or start from scratch
Customize a template to fit your project needs
Collaborate and improve your Gantt chart
Print, share, or present
Lucidspark additional resources
Lucid Training Labs
Learn visual collaboration skills in free, self-serve courses and live training workshops.

Lucid Community
Connect with other users to share tips and insights. Provide feedback to Lucid’s product team.
Help center
Find detailed articles with step-by-step instructions for using specific Lucid features.
Lucidspark tutorials
Go to the Lucidspark tutorials playlist on YouTube for video training on various topics.
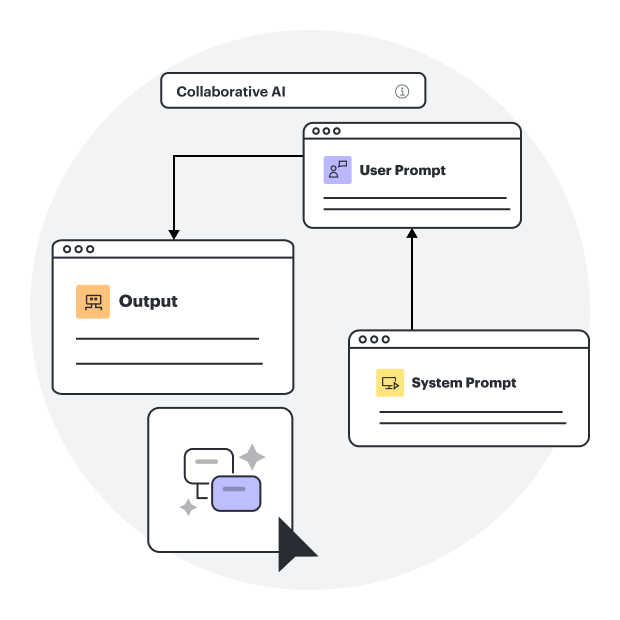
Collaborate with AI
Get an overview of Lucidspark’s AI functionality and find additional resources.
Lucid blog
Explore tips for optimizing collaboration, aligning teams, and driving initiatives in Lucidspark.
Lucidspark pricing
Create a free account and compare options for paid Individual, Team, or Enterprise plans.
Frequently asked questions about Gantt charts
What is a Gantt chart used for?
What is the difference between a timeline and a Gantt chart?
How can I present my Gantt chart?
I want to make my Gantt chart in Excel before making it into a more visual format. How do I make a Gantt chart in Excel?
What is the difference between a Gantt chart and a PERT chart?
What are the benefits of a Gantt chart?
Everything you need to make a diagram
In addition to PERT and Gantt charts, Lucidchart offers support and training resources to help you branch out to any type of diagram.
View training labs