What is a Gantt chart?
Project requirements can be difficult to grasp, especially when you're managing large projects with many overlapping tasks. A Gantt chart can make it easier by visualizing all the tasks from the beginning of a project to its completion.
Structured similarly to a timeline, a Gantt chart is a visual roadmap of a project’s progress. It maps out individual tasks, their dependencies, ownership, and durations, allowing teams to see dependencies and overlapping work at a glance. This clarity ensures everyone stays accountable and on top of deadlines.
Gantt charts were developed in 1896 by Karol Adamiecki, a Polish economist, and later refined by Henry Gantt, an American engineer who was hired to help the U.S. Army prepare for its entry to World War I. These early versions were revolutionary, but they couldn’t show interdependencies and had to be redrawn whenever a schedule changed.
Modern software has solved these problems, allowing teams to update assignments and timelines seamlessly without having to start from scratch.
Advantages and disadvantages of Gantt charts
There are many reasons to use Gantt charts, but they aren’t ideal for every project or every project management style. Consider some of the following advantages and disadvantages of the Gantt chart before you decide to implement one.
Advantages
-
Visual clarity: Provides both a high-level roadmap and a detailed view of project requirements in one place
-
Enhanced transparency: Keeps teams, stakeholders, and clients aligned on progress, deadlines, and individual accountability
-
Improved planning: Breaks daunting projects into more manageable tasks while mapping critical dependencies to avoid bottlenecks
-
Resource management: Prevents burnout by visualizing workloads, allowing managers to allocate tasks more effectively and avoid overloading team members
-
Proactive problem-solving: Identifies potential roadblocks early, allowing for realistic deadlines and proactive strategizing
Disadvantages
-
Complexity: Can become visually overwhelming and confusing to navigate for projects with many tasks
-
Maintenance-heavy: Requires continual updating to remain accurate, which can be tedious
-
Risk of inflexibility: If treated as a static document instead of a living one, it can cause stress, hinder performance, and throw the project off course when scopes shift.
What are the main elements of a Gantt chart?
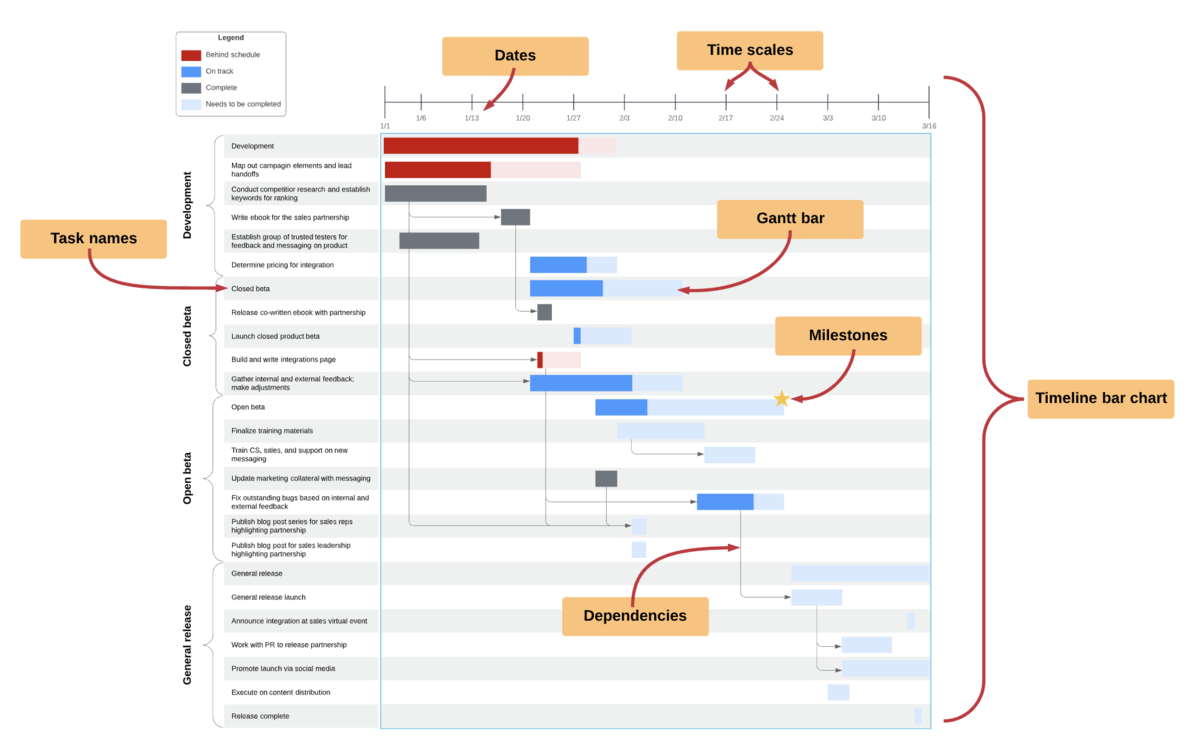
A Gantt chart contains several parts, each one relating to a different aspect of your project. Your Gantt chart may vary slightly, depending on how complex your project is and how detailed you want it to be, but it should include the following elements:
-
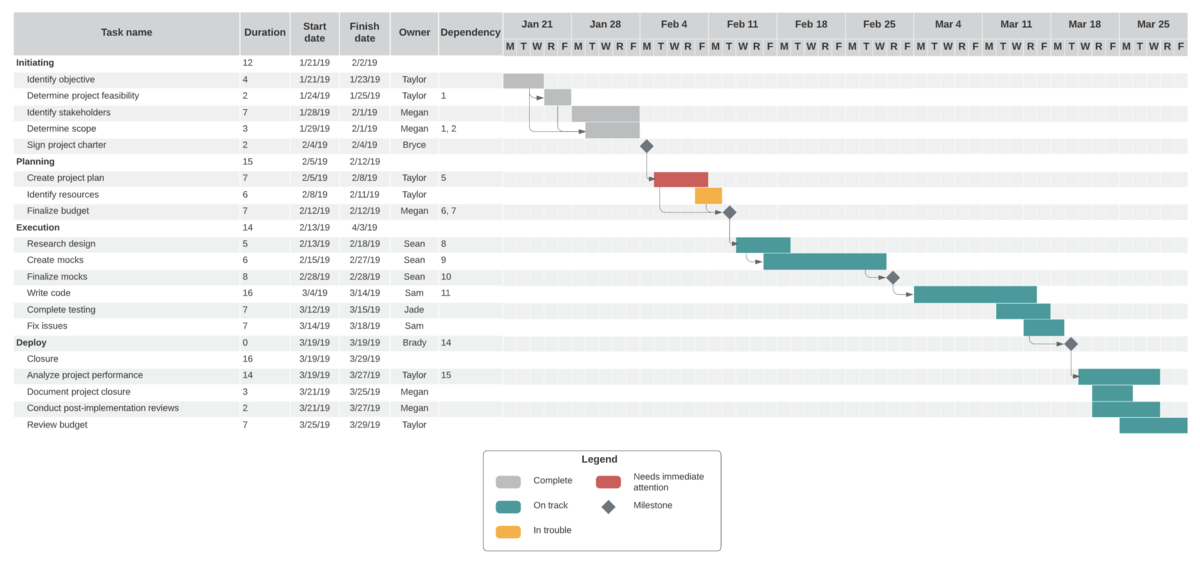
Gantt bars: Visual markers can represent a task's duration, progress percentage, and status (e.g., critical vs standard).
-
Task list: Typically located on the left side, the list includes task names and descriptions for each activity.
-
Time scale and dates: The horizontal axis at the top sets the project’s calendar (hours, days, or months) and marks specific start and finish dates.
-
Milestones: Distinct symbols (often diamonds) mark key goal dates or checkpoints in a project.
-
Dependencies: These are the lines or arrows connecting bars that show the sequence and relationships between tasks.
Many teams also add a legend or key so viewers can interpret colors, shapes, and arrows consistently across the chart.
Who uses a Gantt chart?
While Gantt charts are most often used by project managers, diagramming software has made them more accessible to other roles. Now, anyone with a task list and start and end dates can enter their information into a Gantt chart generator for an instantly organized visual. You can even use a Gantt chart for personal projects.
Here are some examples of roles that could benefit from Gantt charts:
-
Project and department managers: Managers can use Gantt charts to build detailed roadmaps, manage marketing campaigns, streamline operational workflows, and more.
-
Executive leadership: CEOs and stakeholders can use Gantt charts to monitor high-level project progress at a glance.
-
Team leaders and schedulers: Leaders can balance workloads, assign tasks, and ensure resources are used effectively.
-
Consultants: Use a Gantt chart to coordinate timelines and tasks between your team, clients, and subcontractors.
Essential steps to creating a Gantt chart
Building a Gantt chart requires considerable effort, but it can be a major asset throughout your project. Take the following steps to build an organized, accurate Gantt chart to guide your project from beginning to end.
1. Identify individual tasks
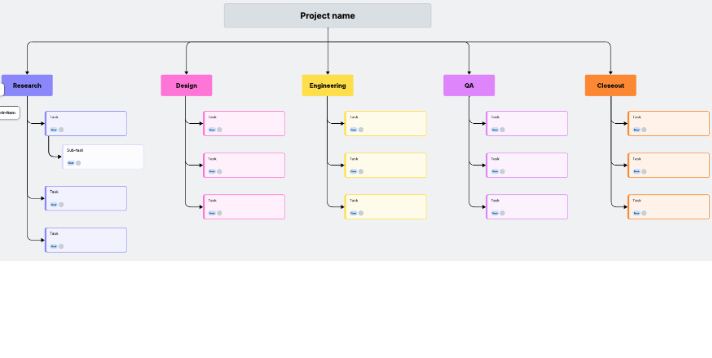
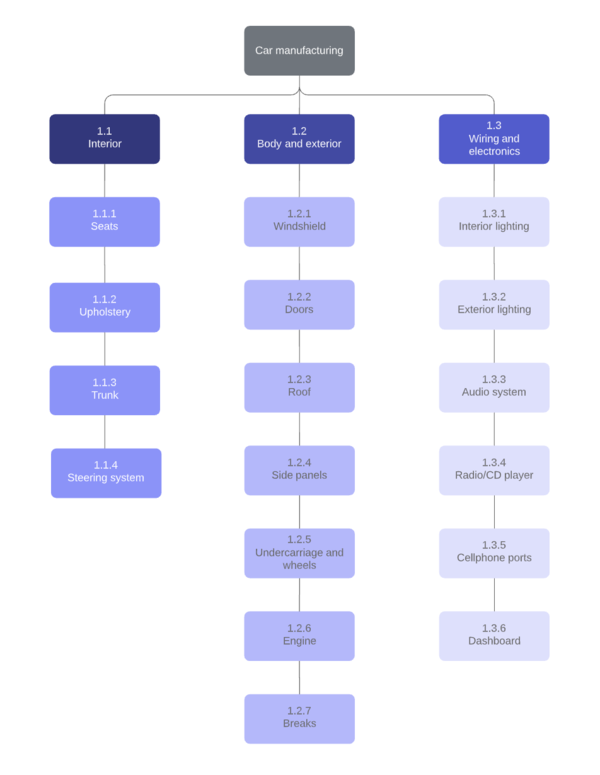
List every task and subtask required for the project. To ensure critical steps aren’t overlooked before you commit to a schedule, consider using a visual collaboration solution like Lucid to collect as many ideas and perspectives as possible.
Using work breakdown structures and involving different members of your team can help with this often time-consuming step.
2. Determine task relationships
Identify which tasks are sequential (one must happen before the next begins) and which are parallel (can happen simultaneously). Mapping these dependencies is crucial for identifying the critical path and understanding how individual tasks affect others throughout the project.
3. Create a timeline
Assign realistic durations to each task, accounting for any potential setbacks and delays. Unrealistic timelines can slow the project down, create inaccurate expectations, cause stress, and even result in failure.
If you’re working toward a hard deadline, try backward scheduling from the due date to validate whether the task durations are feasible. Consider using a PERT chart or sketching dependencies out in separate diagrams before committing to dates in a Gantt chart to ensure all the details fit.
4. Build your chart
Using a Gantt chart software or template, enter the project information to build a chart. If your tasks already live in a spreadsheet, use an import feature to save time. Double-check your work to ensure everything is accounted for and consider adding a key to explain the meaning of different symbols or colors.
5. Assign tasks and resources
Assign each task to a team or individual so that everyone clearly understands their role in the project and can stay on top of important deadlines. At this stage, it can also help to attach supporting context, such as links, notes, and reference materials, so that assignees have the information they need to properly execute.
6. Finalize and update
Before work begins in earnest, many teams share the draft chart for feedback and confirmation to catch timeline or dependency issues early.
As the project moves forward, it will evolve. Update the chart as needed. If you’re using cloud-based software like Lucid, you can make these updates in real time, reducing version confusion and keeping stakeholders aligned.
Gantt chart samples
Take a look at the Gantt chart examples below to see which type of chart might be best suited to your project.
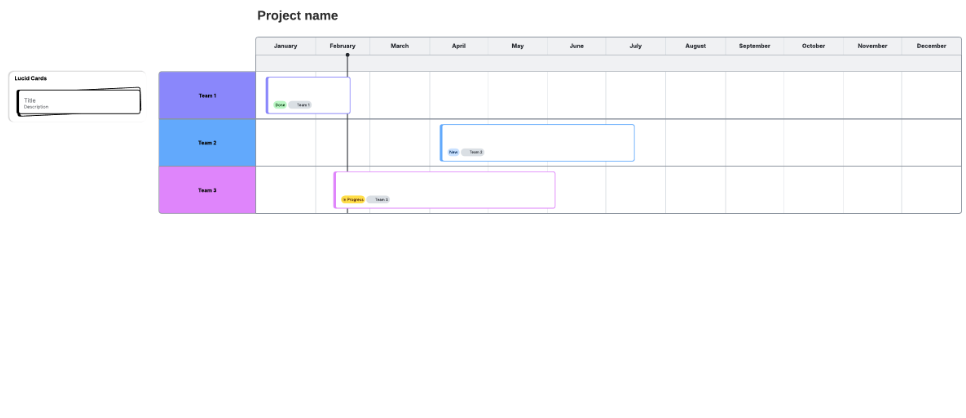
Simple Gantt chart
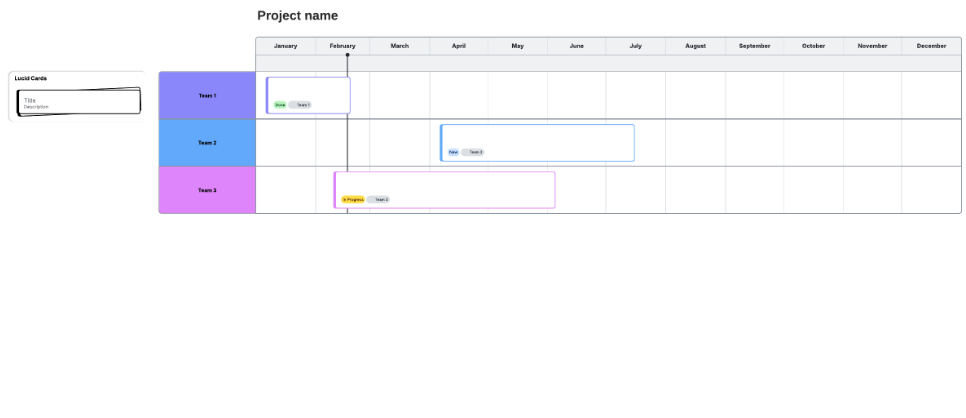
This simplified version of the Gantt chart includes a basic layout with tasks and their durations mapped out according to the project's timeline.
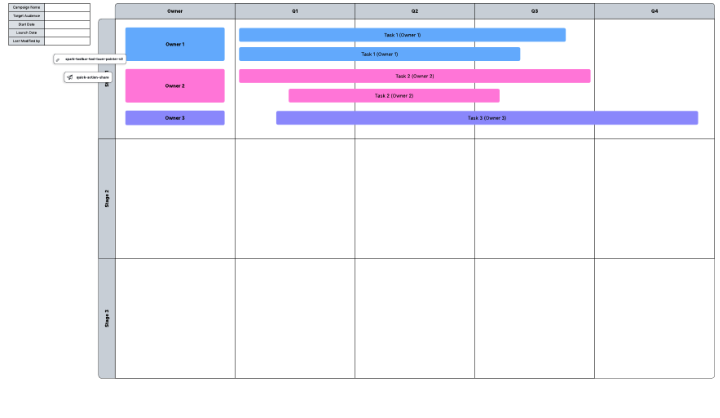
Gantt chart with quarters
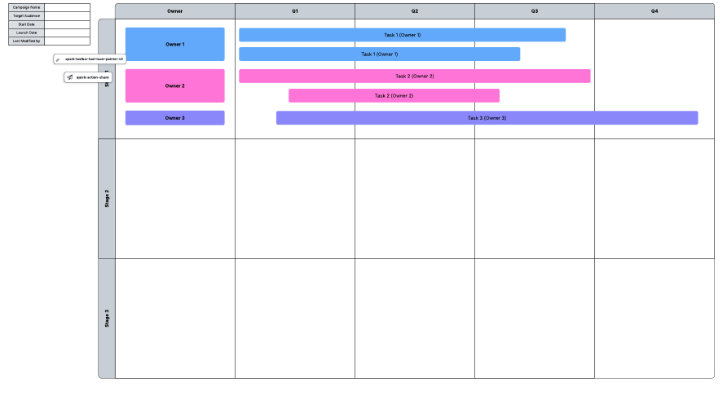
This Gantt chart breaks down timelines by quarter to visualize which tasks need to be completed and when. Status indicators allow you to see progress at a glance.
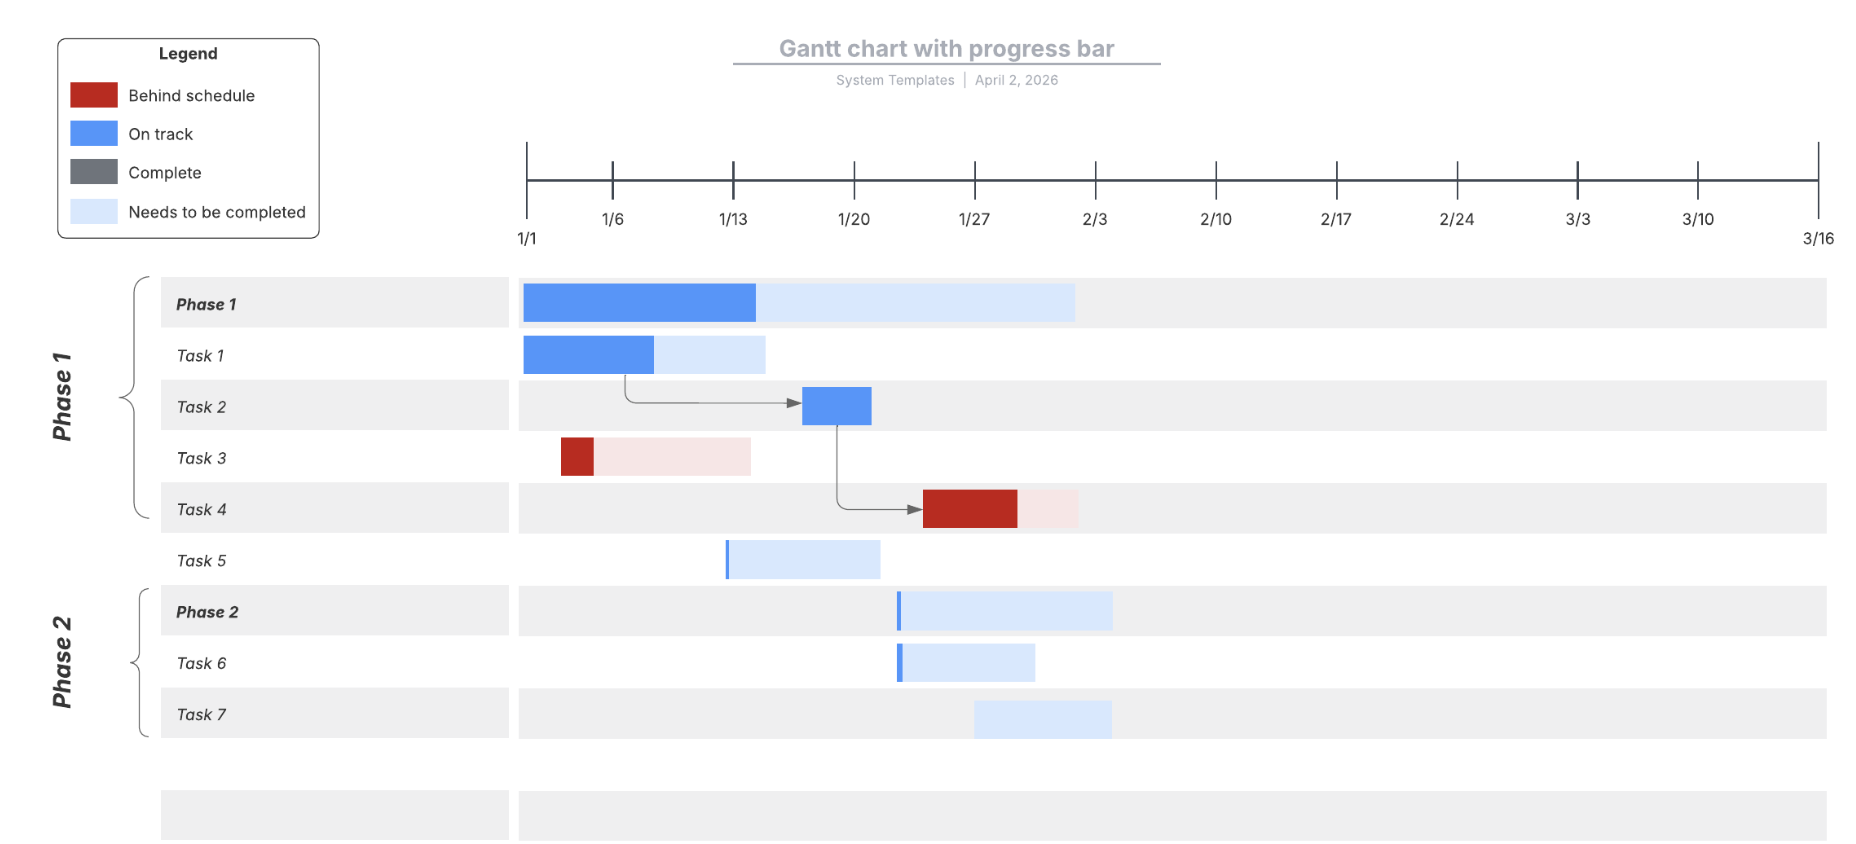
Gantt chart with progress bar template
This template includes basic project information, with a progress bar to more clearly indicate the degree of task completion.
Now that you have the basics covered, you can get to work on creating your own Gantt chart. By breaking big efforts into visible, time-bound pieces, a Gantt chart can make even intimidating work feel more manageable.
Everything you need to whiteboard online
Get the ultimate online whiteboard for teams. Brainstorm, plan projects, and collaborate virtually on Lucidspark’s infinite canvas.
Sign up free