Key takeaways
A piping and instrumentation diagram (P&ID) is a detailed schematic that maps the piping, equipment, instrumentation, and control systems of a process facility.
P&IDs act as the operational basis for plant maintenance, modification, HAZOP studies, and safety and regulatory documentation.
A process flow diagram (PFD) gives a simplified, conceptual overview, while a P&ID adds the full instrumentation and control detail engineers need to build and operate a plant.
P&IDs are schematic and not drawn to scale, so they show how components connect rather than their physical size or geometric position.
There is no single universal P&ID standard. Instrument symbols generally follow ISA S5.1 (ANSI, US), while broader diagramming aligns with ISO 10628, ISO 14617, and EN 62424 in Europe.
In Lucidchart, you can build a free P&ID by listing equipment, enabling the process engineering shape library, dragging out standardized shapes, and connecting them with snapping pipes.
What is a P&ID?
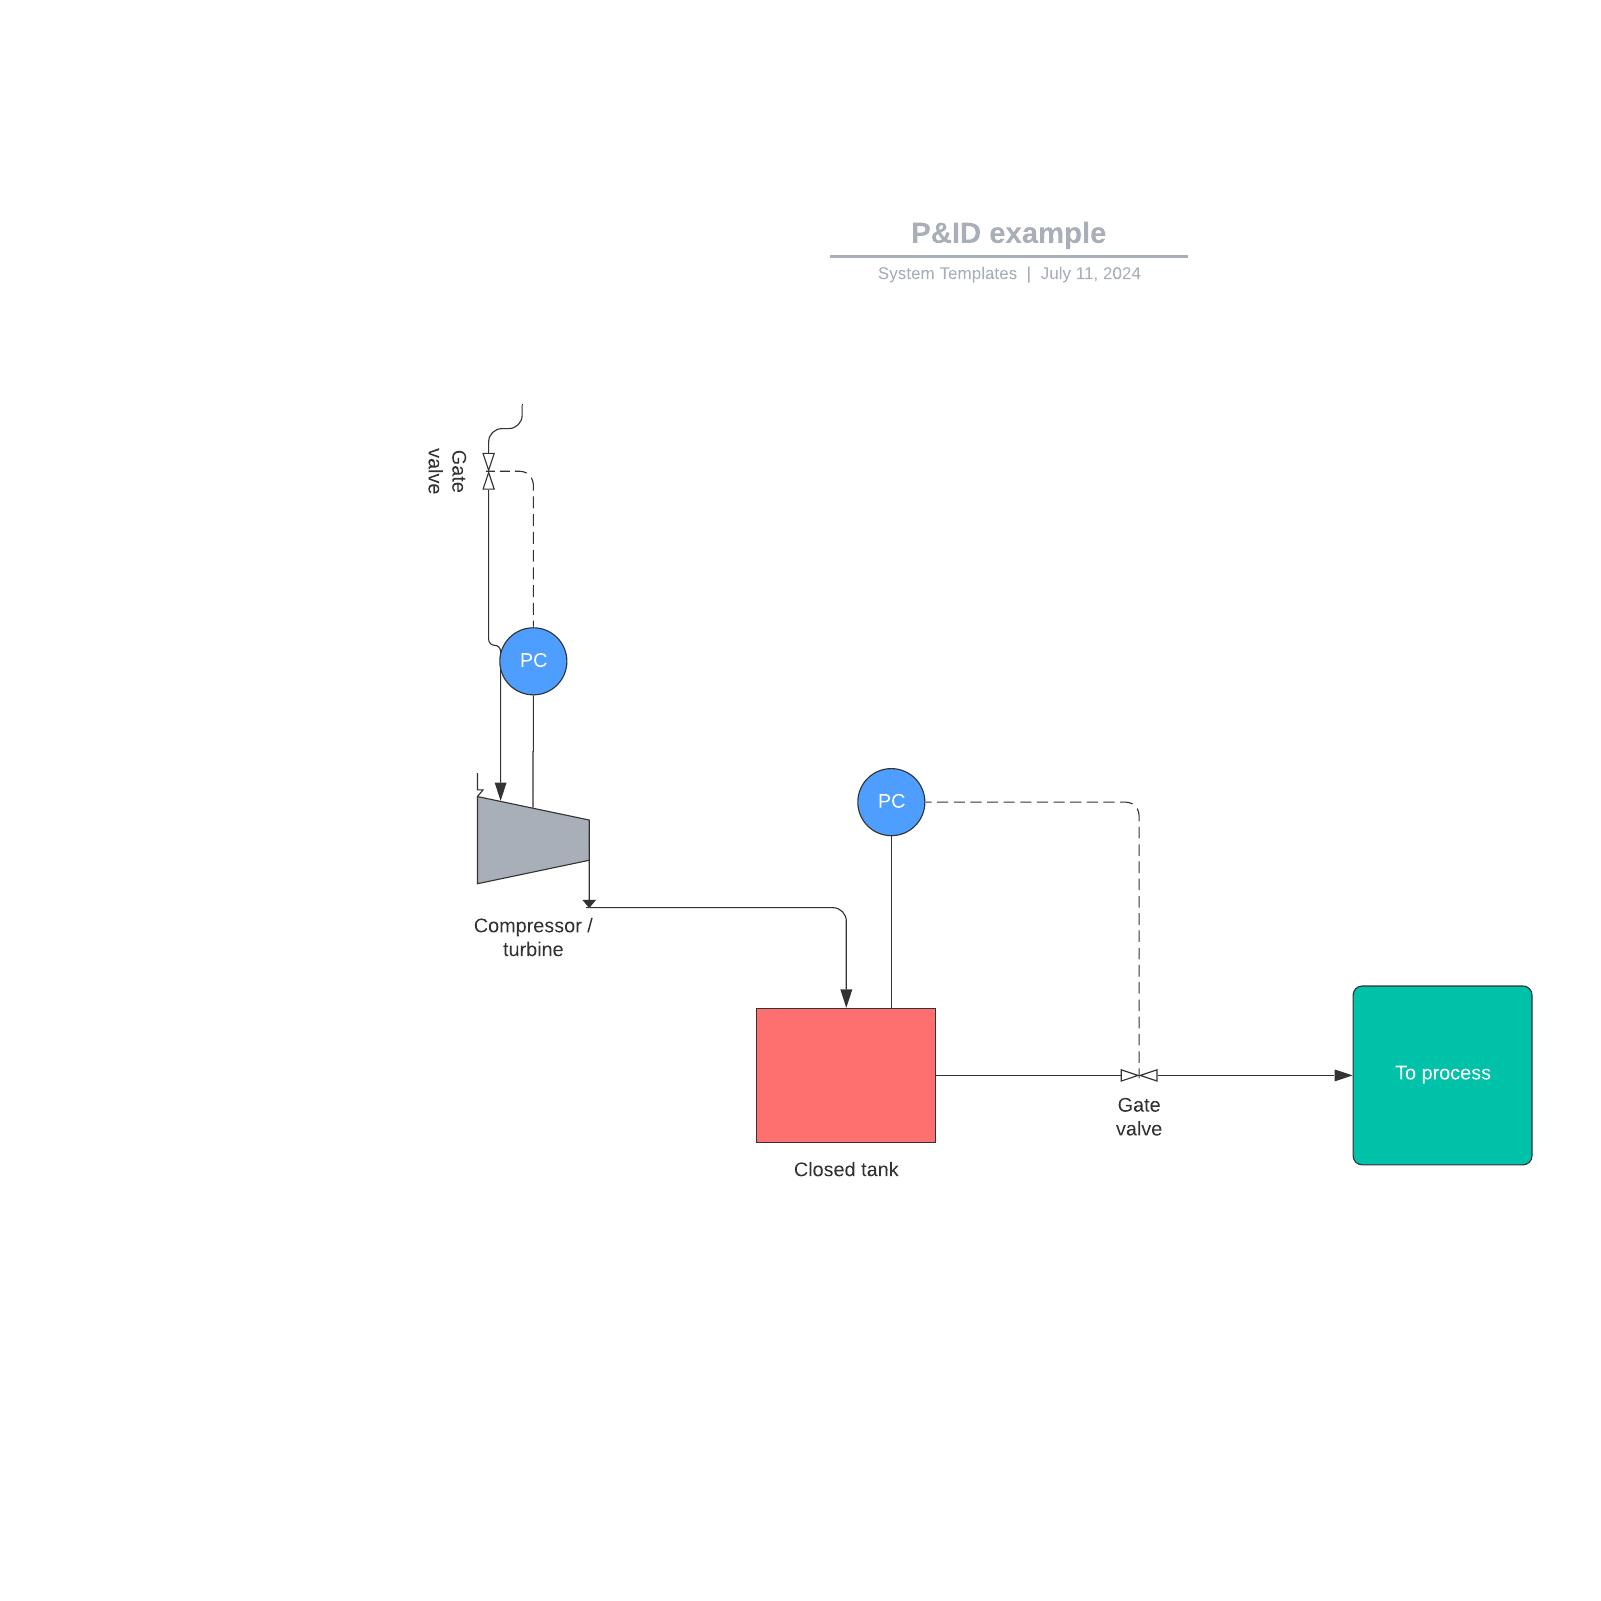
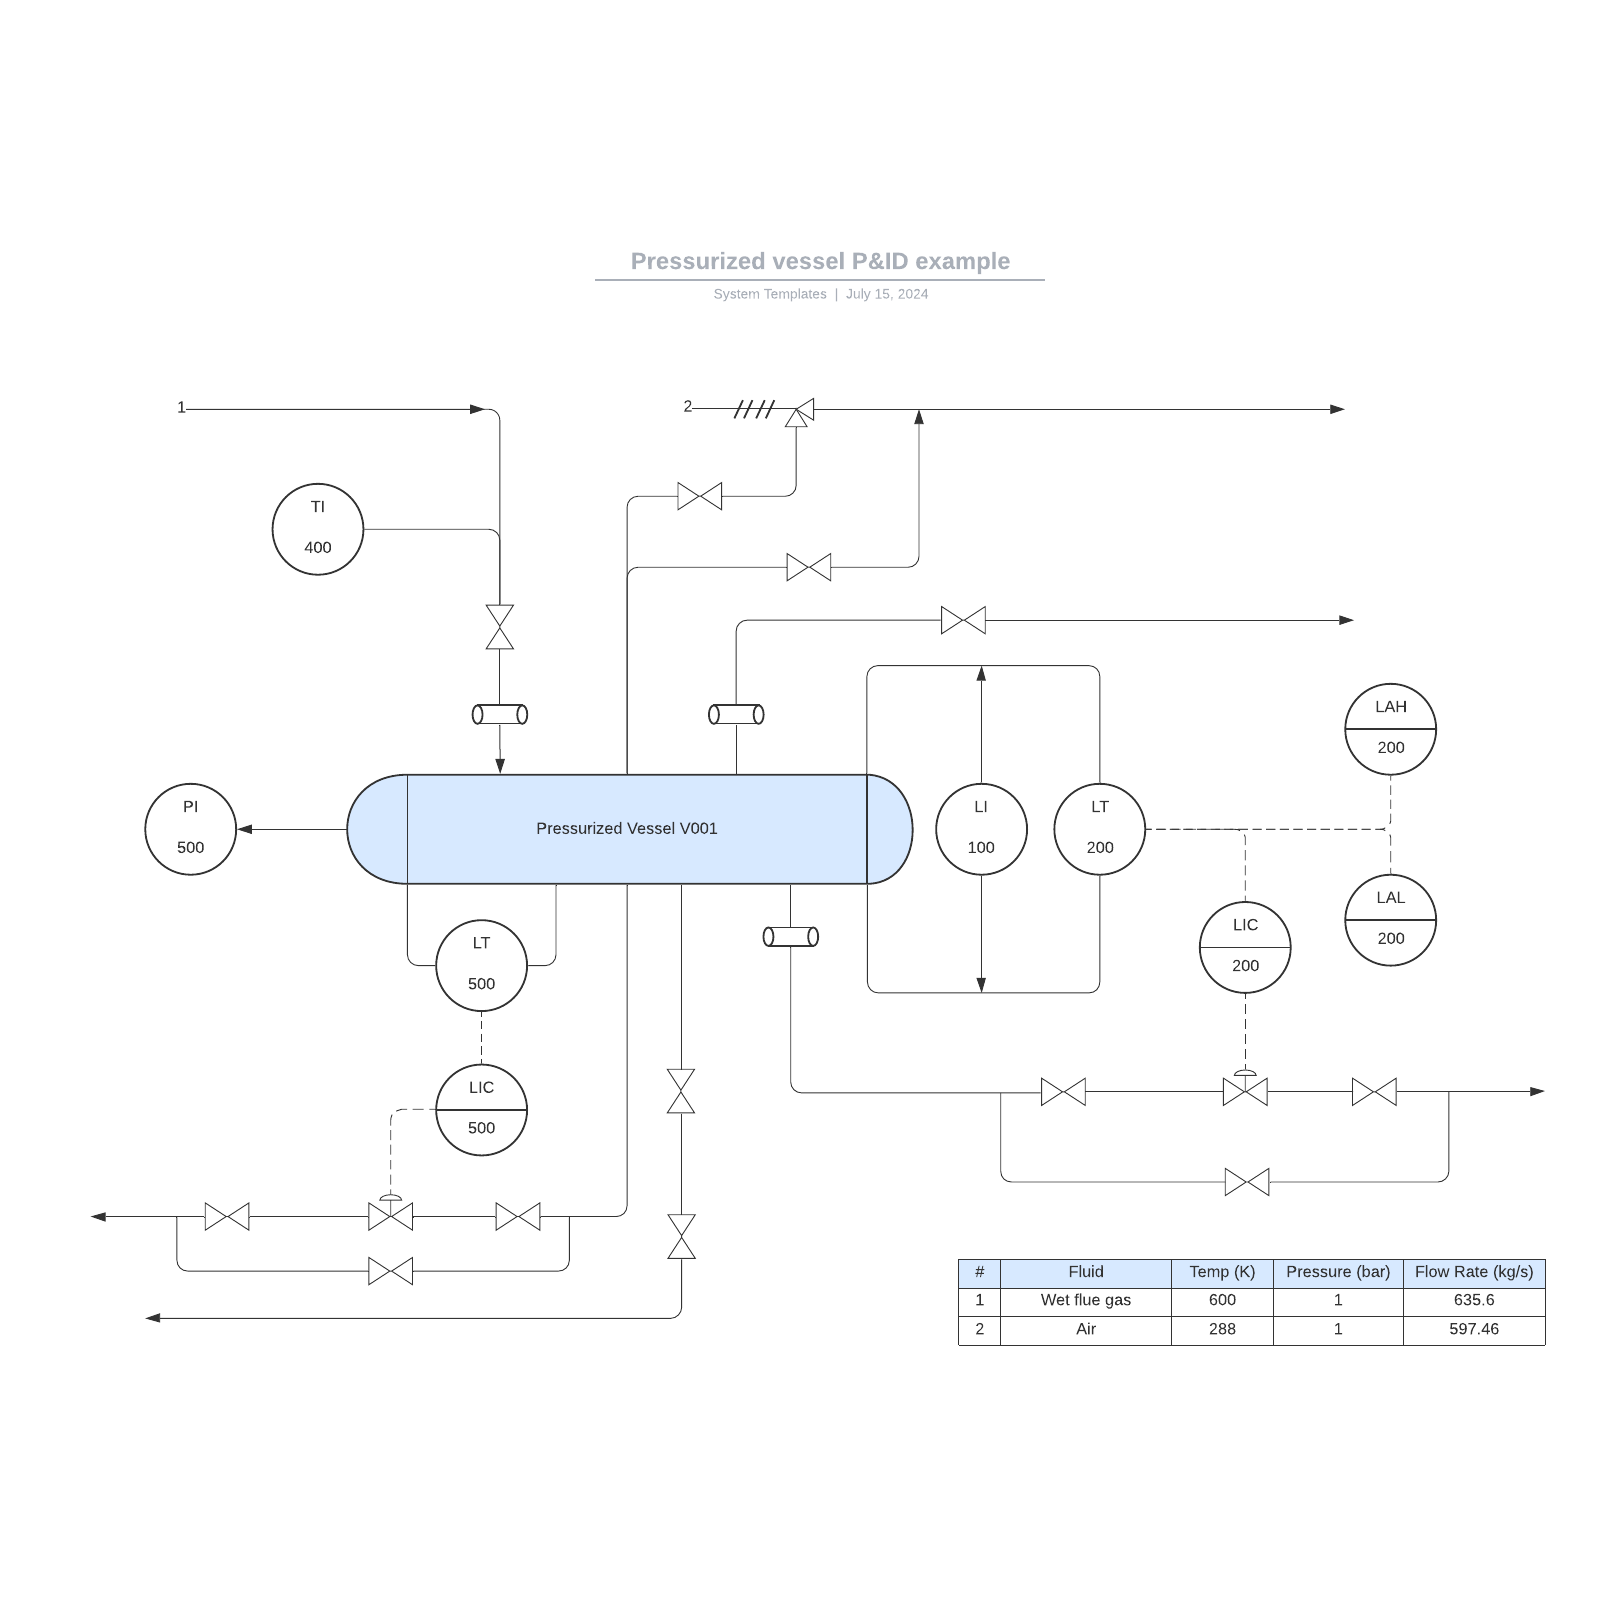
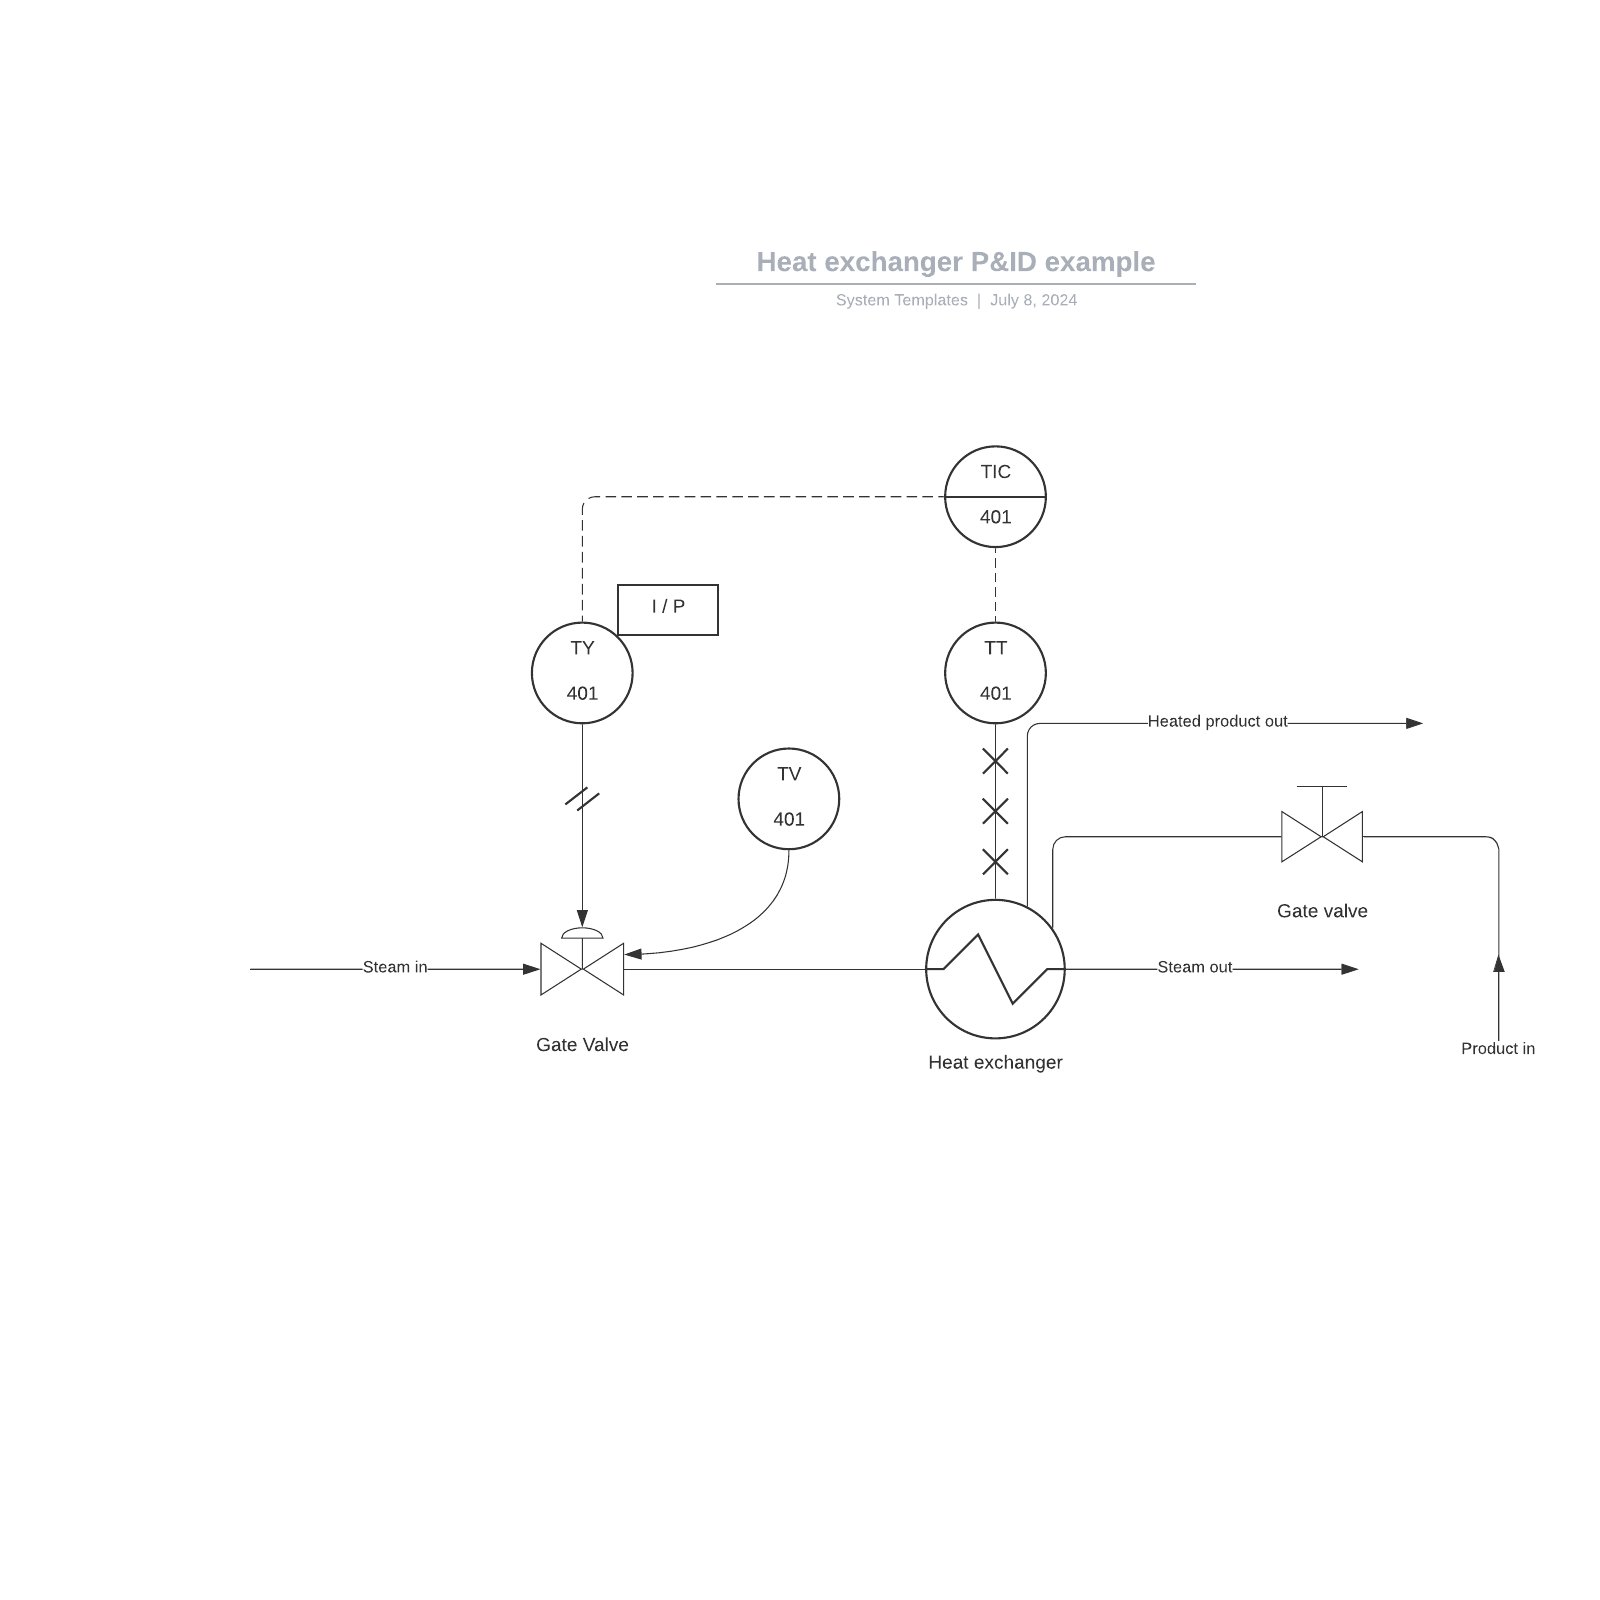
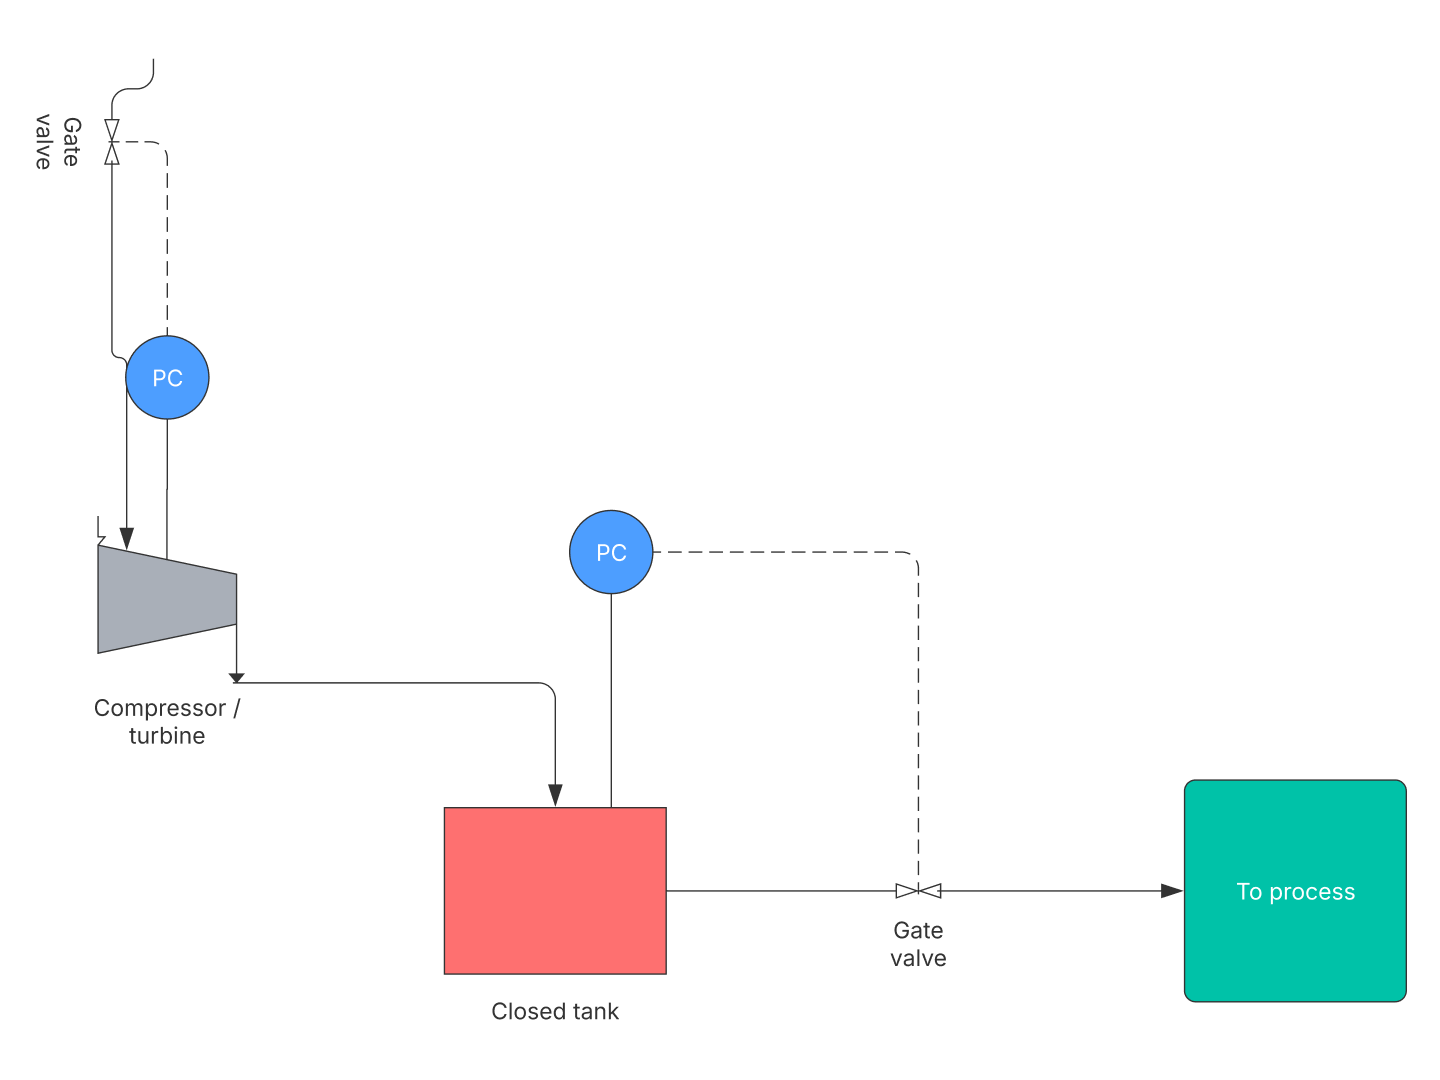
A piping and instrumentation diagram (P&ID) is a detailed schematic drawing that shows the piping, equipment, instrumentation, and control devices in an industrial process, along with their connections. It captures the functional relationships between components rather than their physical layout.
Engineers use a P&ID diagram to document how a process actually runs. It records vessels, pumps, valves, sensors, control loops, and the pipes that connect them, providing every discipline with a shared reference for the same system.
What is the function and purpose of P&IDs?
P&IDs serve as the primary technical blueprint for a process facility. They connect high-level process design to real-world hardware by documenting:
Support hazard and operability (HAZOP) studies that assess process risk
Key piping and instrument details for existing and planned facilities
Control loops, interlocks, and automated shutdown schemes
Safety and regulatory requirements tied to the system
Baseline startup and operational information that operators rely on
Who uses P&IDs and when?
P&IDs are created and read across the full lifecycle of a process facility, from design through daily operation. Different roles depend on them at different stages.
Engineers use P&IDs when designing manufacturing and process systems.
Process safety teams treat them as process safety information (PSI) within a process safety management (PSM) program.
Field technicians, engineers, and operators reference them to run, troubleshoot, and modify equipment.
Trainers use them to onboard new staff on how the system works.
What are P&IDs used for?
By establishing a common language across technical and non-technical teams, P&IDs enable organizations to:
Evaluate construction by reviewing proposed installation work, verifying contractor bids, and managing facility changes (MOC).
Enforce engineering standards by applying consistent guidelines and safety philosophies across an entire project.
Preserve institutional knowledge by tracing a process from high-level visual mapping down to exact hardware schematics, documenting the plant for the long term.
Because P&IDs sit alongside broader process mapping work, teams can trace how a single process moves from a high-level map to a fully detailed engineering schematic.
Process flow diagram (PFD) vs. P&ID
A process flow diagram (PFD) is a simplified, conceptual view of a process, while a P&ID is a more fully developed and detailed drawing. The PFD comes first, and the P&ID builds on it.
PFD: the first step in documenting a process that gives a bird's-eye view of major equipment and flow, with fewer details
P&ID: the detailed follow-on that adds instrumentation, control loops, valves, and line specifications that the PFD leaves out
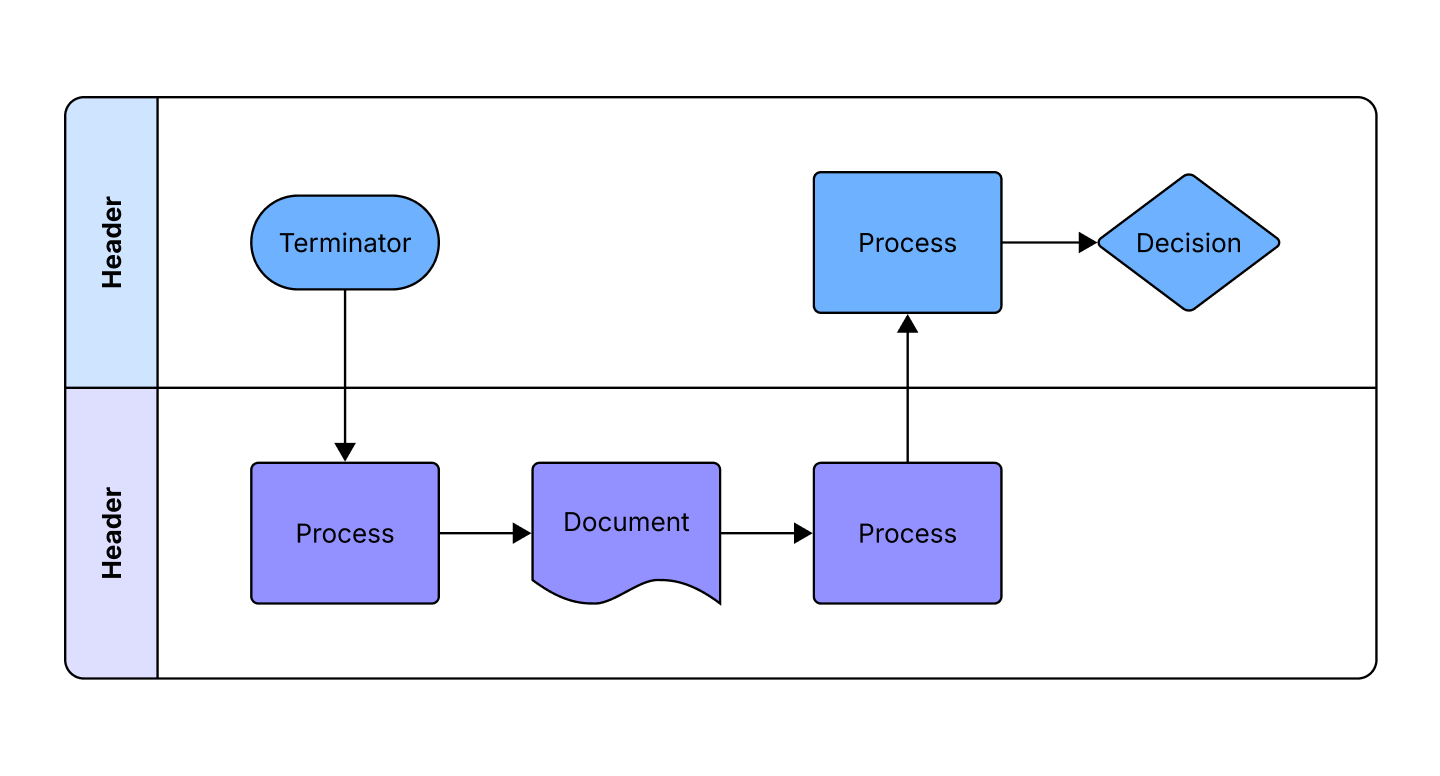
Understanding the difference between a process flow diagram and a P&ID helps teams choose the right level of detail for each stage of the design process.
What are the limitations of P&IDs?
P&IDs are schematic drawings, so they are not drawn to scale and are not geometrically accurate. They show how components connect, not where they physically sit or how large they are.
There is also no single universal P&ID standard. Instrument symbols generally follow ISA S5.1 (an ANSI standard used in the US), while broader P&ID diagramming aligns with ISO 10628 and ISO 14617. In Europe, EN 62424 is commonly used. Teams should confirm which standards apply before drafting.
What support documents accompany a P&ID?
A P&ID rarely stands alone. Several companion documents add the details and specifications that the diagram references.
Process flow diagrams (PFDs): the simpler, higher-level view of the process
Piping material specifications (PMS): the material requirements for piping.
Equipment and instrumentation specifications (EIS): the specifications for equipment and instruments
Functional requirement specification (FRS): the functional requirements the system must meet
What should a P&ID include and not include?
A P&ID should include the mechanical, piping, and control details needed to build and operate the process, while omitting minor components and data that belong in other documents.
A P&ID should include:
Equipment and physical layout: mechanical equipment names, numbers, capacities/ratings, physical sequence, and seismic categories
Piping and flow details: process piping sizes, line numbers, flow directions, startup/flush lines, vents, drains, and special fittings
Valves and interfaces: all process valves (with IDs), interfaces for piping class changes, quality levels, and vendor/contractor battery limits
Instrumentation and controls: controls inputs/outputs, interlocks, annunciator logic, computer control system connections, and inter-drawing references
A P&ID should not include:
Minor hardware: elbows, tees, standard pipe fittings, and secondary instrument tubing/manifold valves
Process data: operating parameters like pressure, temperature, or flow rate values
Electrical and internal logic: control relays, motor schematics, internal wiring, or individual ladder logic components
Clutter: Extensive explanatory text or detailed structural/civil notes
For a full reference to all P&ID symbols, see our P&ID symbols legend.
How to make a P&ID in Lucidchart
Follow these steps to build a P&ID drawing in Lucidchart. Start with an inventory of the system, add standardized shapes, then connect everything with pipes. Creating a P&ID with software such as Lucidchart keeps the drawing accurate, shareable, and easy to revise.
List your equipment. Note every branch, control interlock, piece of equipment, instrument, reducer, and valve you need to represent.
Add shapes. Open the shape library manager from the shape toolbox on the left, then search for or enable the process engineering shape library. Drag P&ID shapes onto the canvas and configure them through the context panel. Use the toolbox search to find a specific symbol quickly.
Connect pipes and equipment. Draw lines between components. Shapes snap to connecting lines and pipes so your diagram stays accurate as it grows.
Share. Send the finished diagram to collaborators for feedback.
Why use Lucidchart for P&IDs?
Lucidchart is an intelligent diagramming and P&ID software application that helps engineers document and share process and instrumentation diagrams. It pairs standardized symbols with real-time collaboration so teams stay aligned.
Here are a few other reasons to use Lucidchart to create your P&ID:
It’s simple to use. Build diagrams with ISA S5.1-based P&ID symbols and drag-and-drop shapes.
It offers helpful integrations. Connect with Google Workspace and Drive, Jira, and other Atlassian tools. Plus, import and export Visio files.
It enables real-time collaboration. Work on the same diagram with your team all at once.
It is compatible with Visio. Lucidchart allows users to import and export Visio files, so you can continue existing diagrams in a new platform or collaborate with those who prefer to use Visio.
Lucidchart is trusted at scale, with 100 million users across more than 180 countries relying on Lucid to document how work gets done.