Timing diagram generator
Map out state shifts on a clear timeline to document hardware sync and catch timing errors before they reach production.


By registering, you agree to our Terms of Service and you acknowledge that you have read and understand our Privacy Policy.

Get started with our AI diagram generator
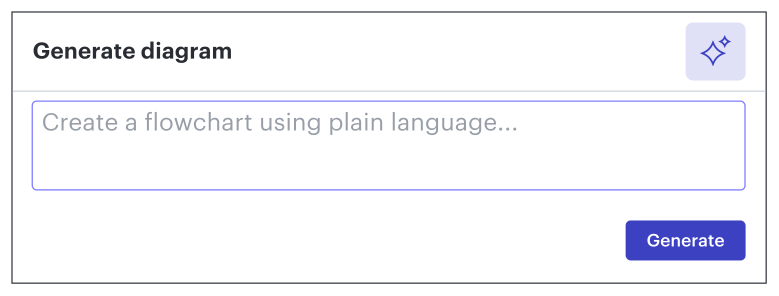
Precise, data-backed diagram creator
Use high-fidelity timelines and state-line notations to see how your embedded hardware and software interact.
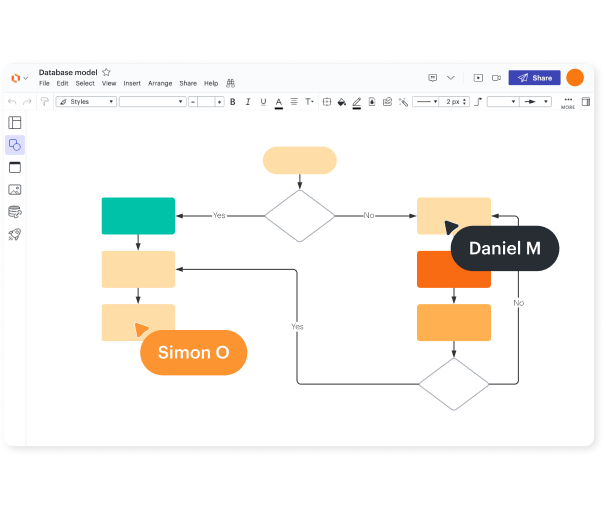
Track state changes with precision
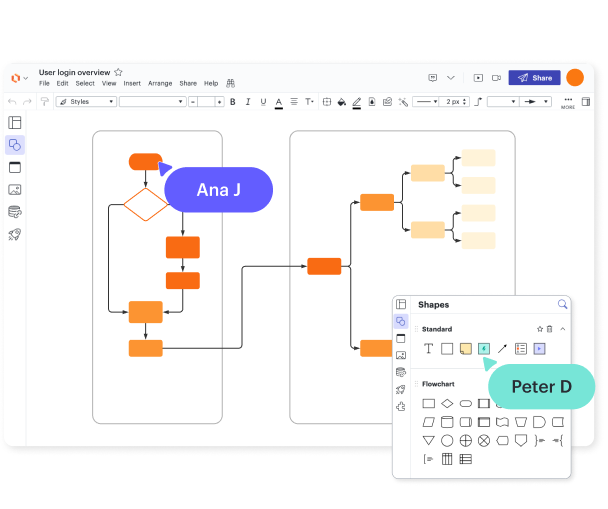
Leverage specialized scales
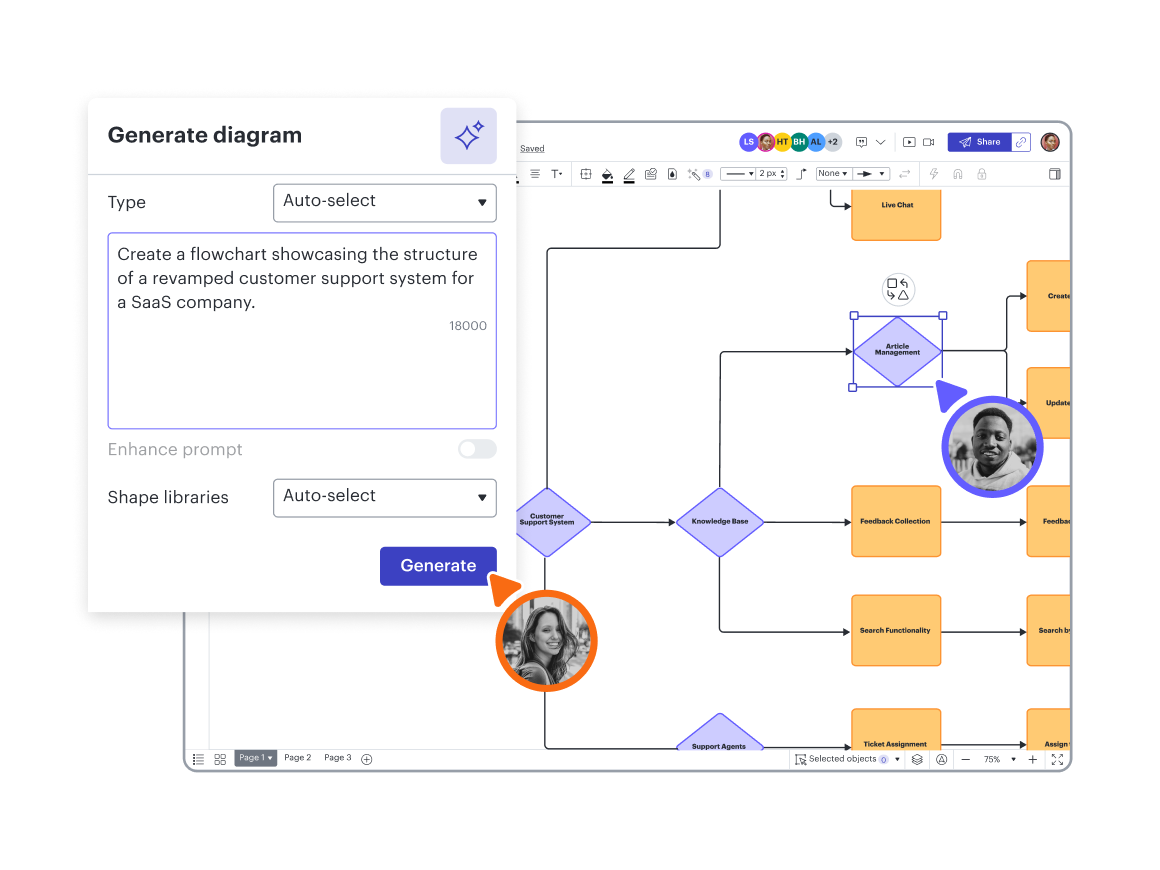
Leverage Lucid AI
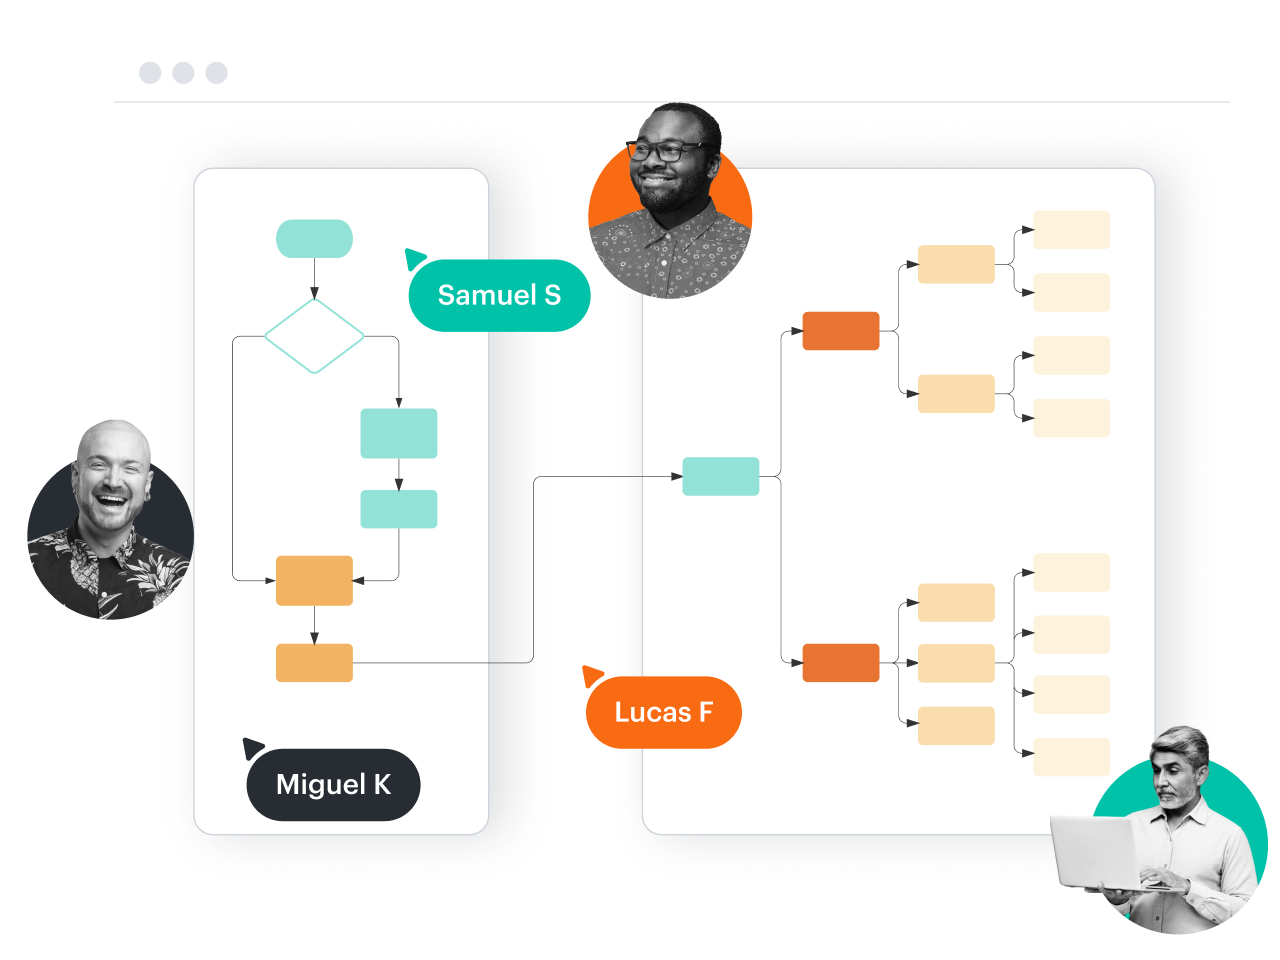
Collaborate in real time
Boost productivity with 100+ integrations
Lucidchart feature highlights
Real-time collaboration
Real-time collaboration
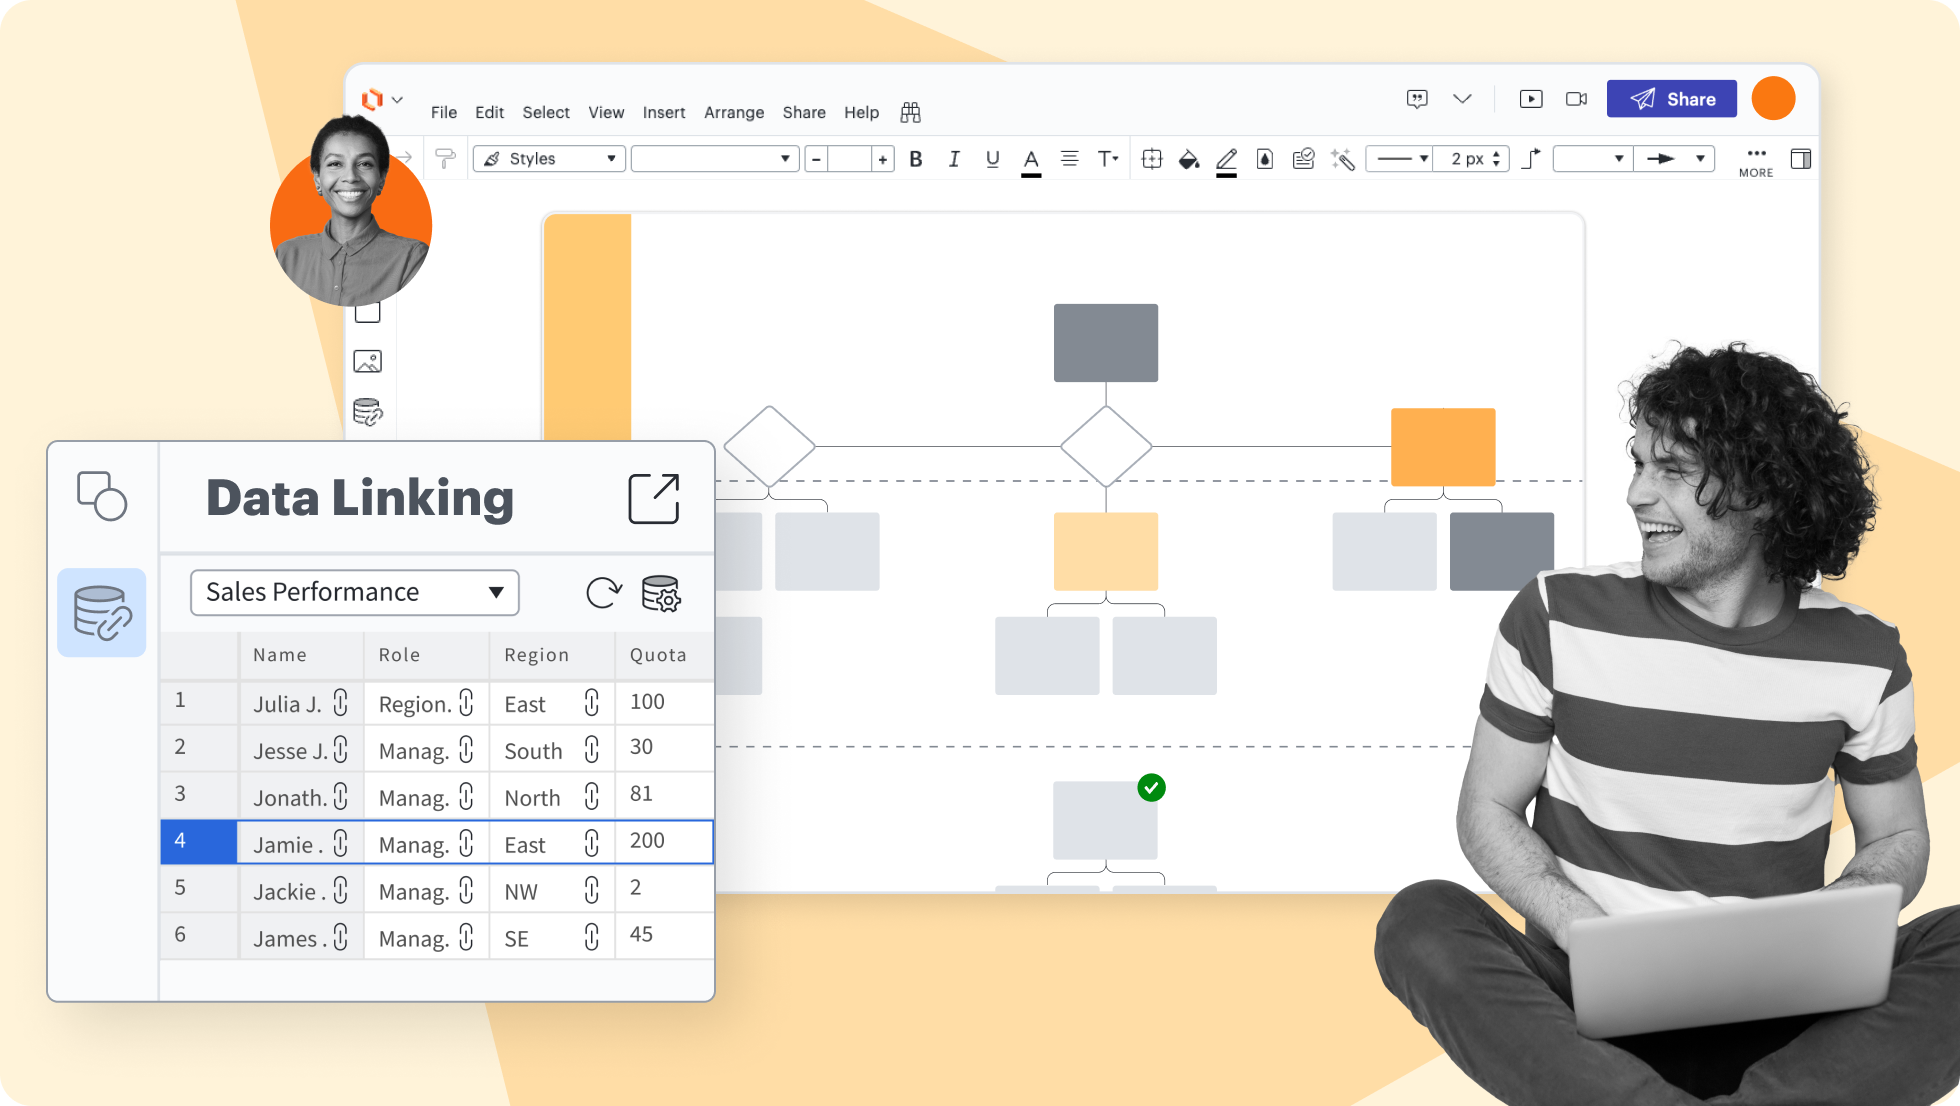
Data linking
Data linking
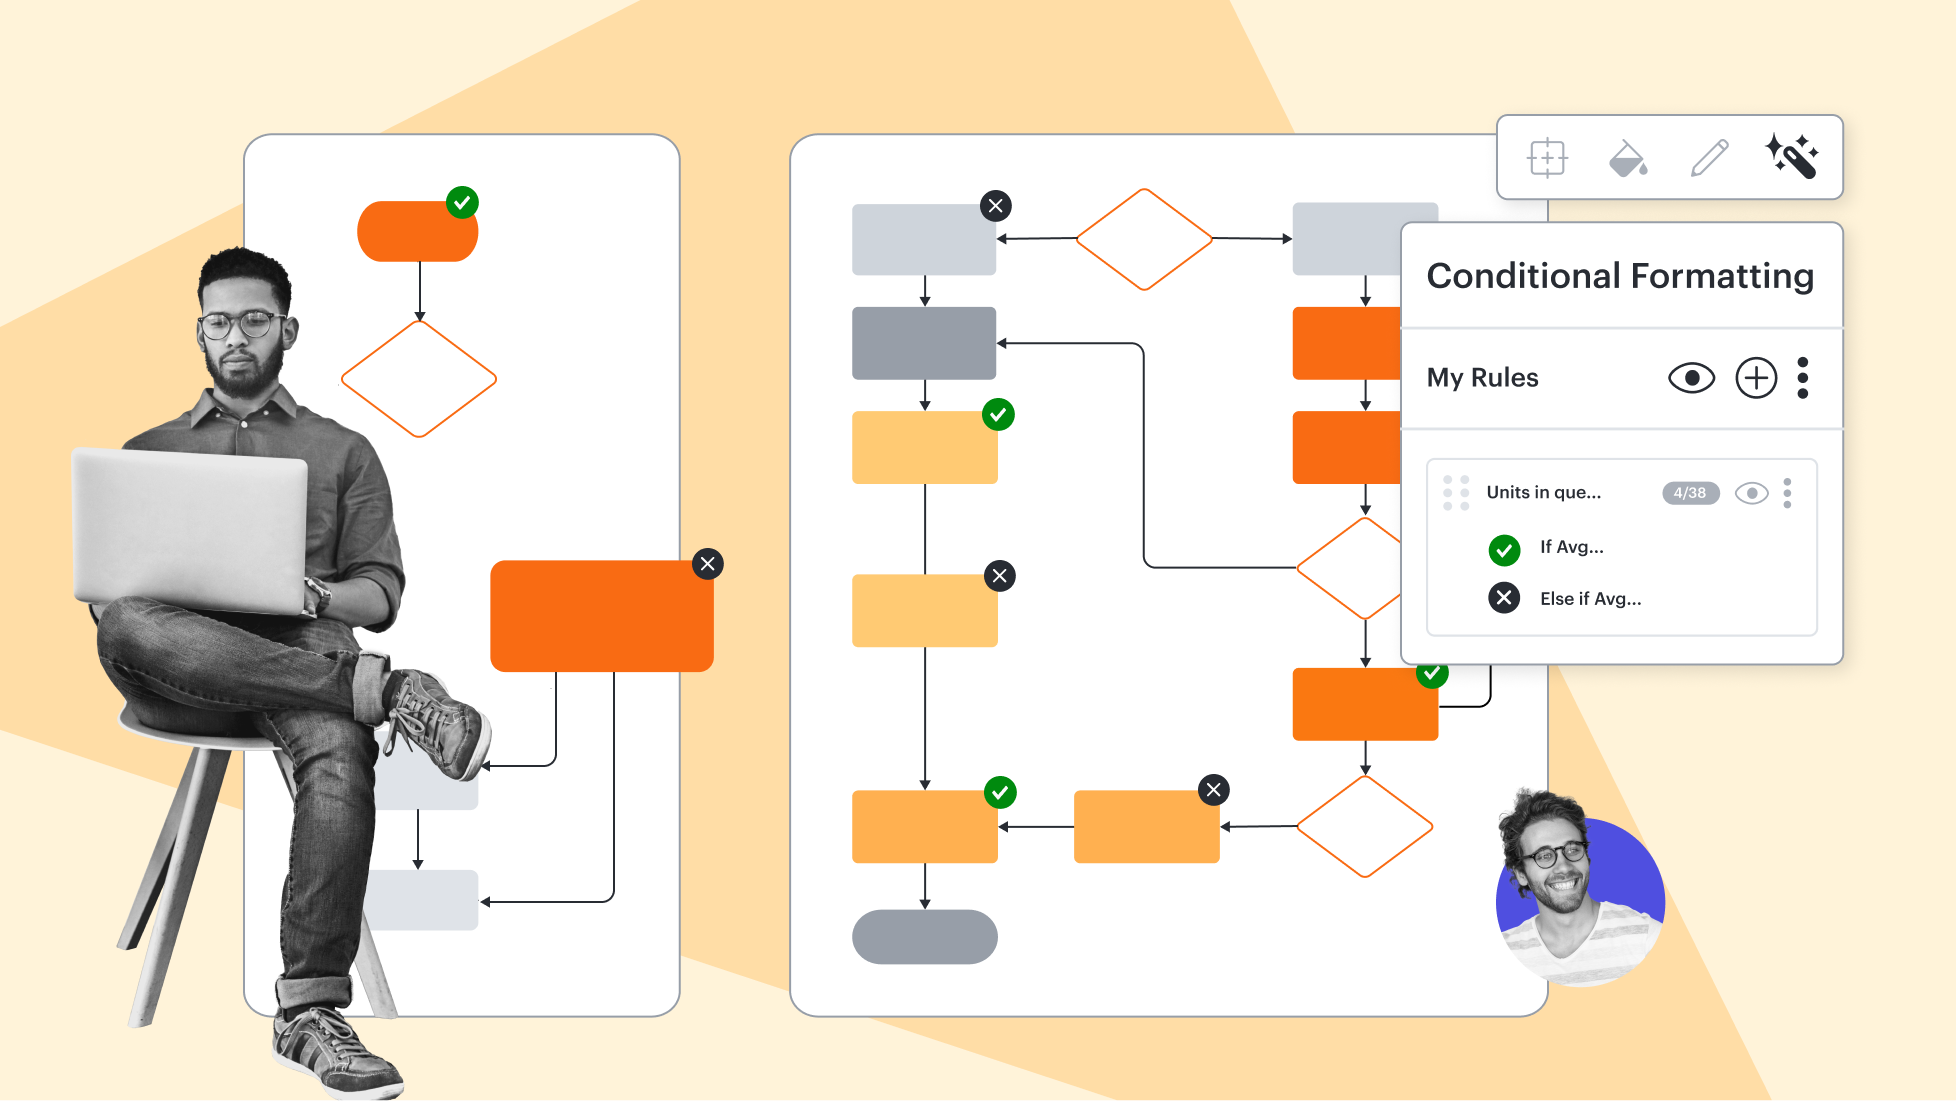
Conditional formatting
Conditional formatting
Layers
Layers
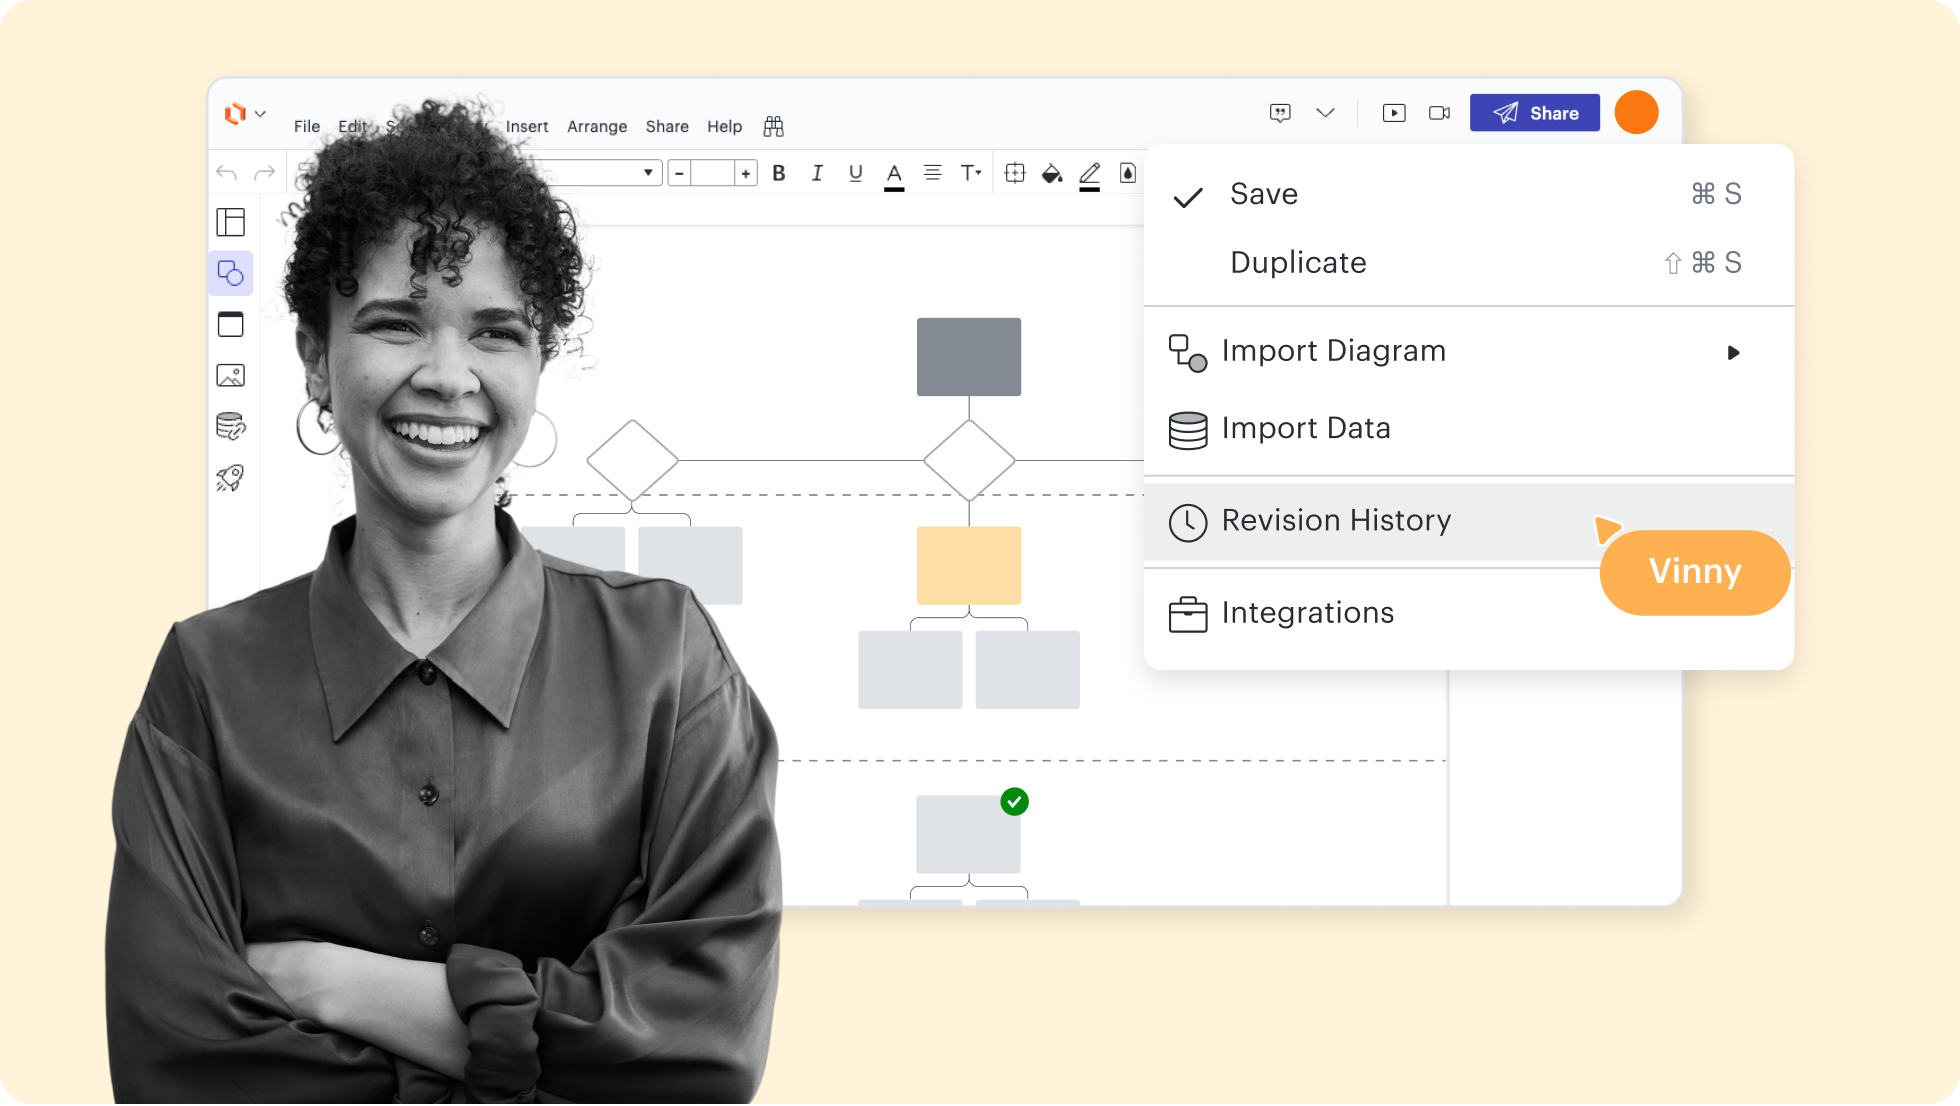
Revision history
Revision history
Shape libraries
Shape libraries
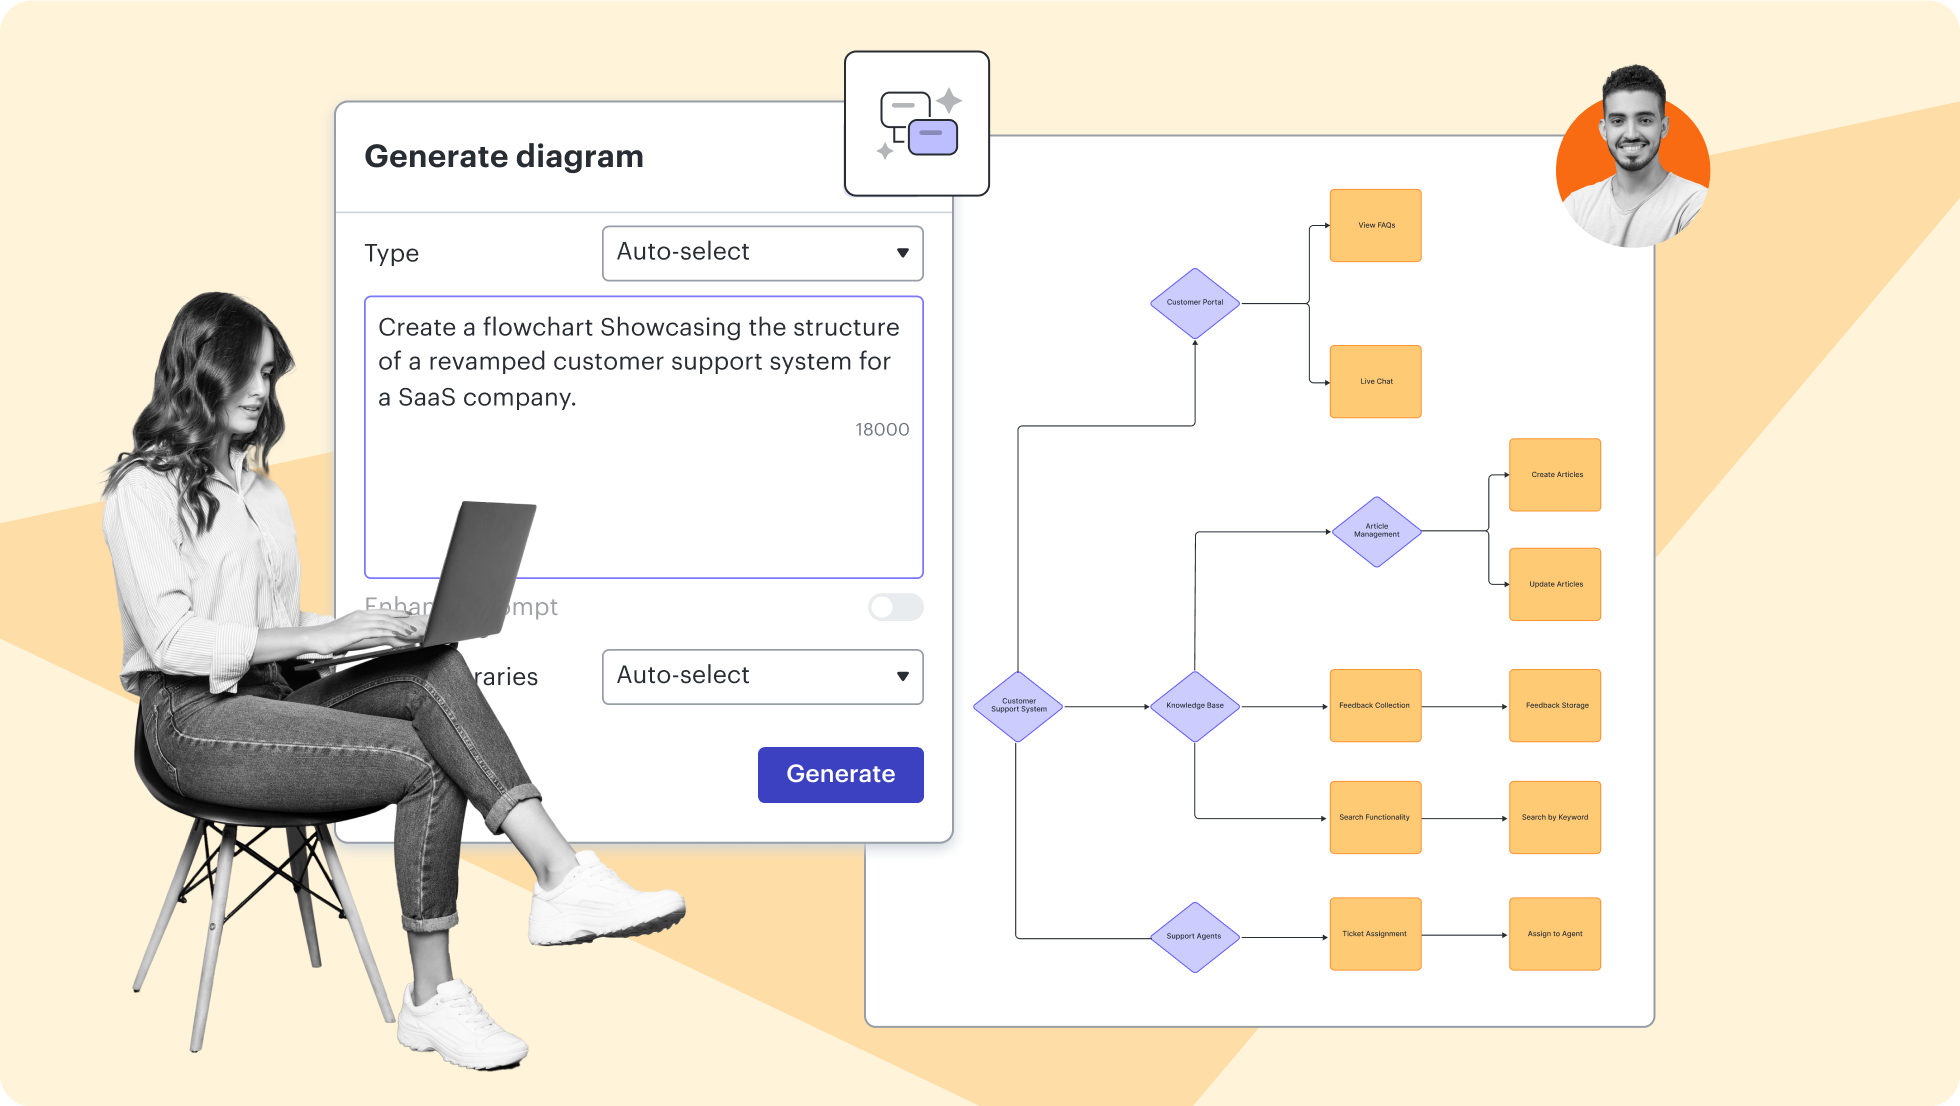
AI prompt flow
AI prompt flow



Lucidchart feature highlights
Streamline work by enabling multiple collaborators to create and edit the same diagram at once.
UML timing diagram templates and examples
Select one of our customizable templates to create a UML timing diagram online.
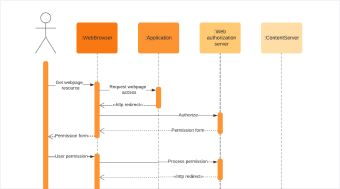
Getting started in Lucidchart
Getting Started in Lucidchart
Follow along with this video tutorial and learn how to make any type of diagram in Lucidchart.
Why teams choose Lucidchart
As an intelligent diagramming application, Lucidchart provides simple yet powerful capabilities for visualizing information.

Collaboration. Bring teams together side by side on a shared canvas from anywhere in the world.
Alignment. Build transparency and shared understanding of how a team or company works.
Large-scale change. Increase visibility, standardization, and knowledge sharing across your entire org.
End-to-end workflows. Upgrade to the Lucid Suite for a complete, connected visual collaboration solution.


What is a UML timing diagram?
A timing diagram is a specific behavioral modeling diagram that focuses on timing constraints. While similar to a sequence diagram, it focuses on the duration of events rather than just their order. By mapping time along the horizontal axis, you can identify latency issues, synchronization gaps, and areas where your process can be optimized for better performance.
How to create a UML timing diagram
Identify the lifelines and participants
Define possible states
Define the time axis
Map out the state transitions
Add events and messages
Apply constraints and observations
Additional Lucidchart resources

Lucid Training Labs
Learn visual collaboration skills in free, self-serve courses and live training workshops.

Lucid Community
Connect with other users to share tips and insights. Provide feedback to Lucid’s product team.
Help center
Find detailed articles with step-by-step instructions for using specific Lucid features.

Lucidchart tutorials
Go to the Lucidchart tutorials playlist on YouTube for video training on various topics.
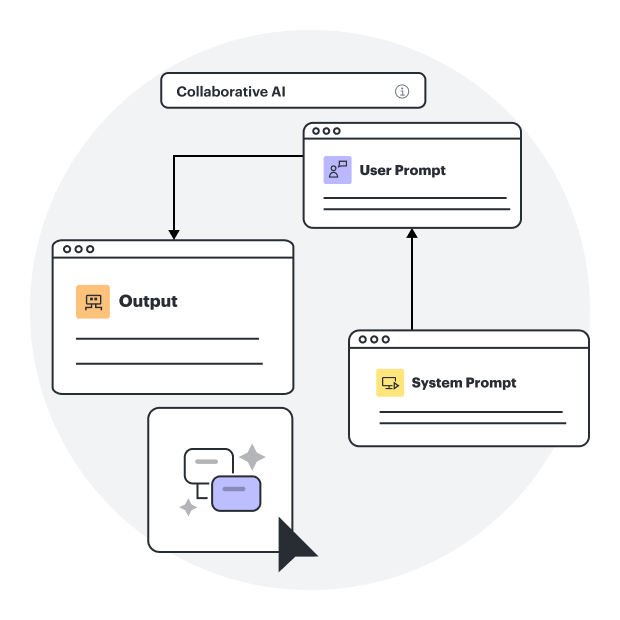
Collaborate with AI
Get an overview of Lucid’s AI functionality and find additional resources.
Lucid blog
Explore tips for optimizing collaboration, aligning teams, and driving initiatives in Lucidspark.

Lucidchart pricing
Create a free account and compare options for paid Individual, Team, or Enterprise plans.
Frequently asked questions about UML diagrams
Can I build a UML diagram using markup?
How can I change the formatting of a UML diagram?
Can I show the difference between current and future states within the UML diagram?
What are the options for sharing my UML diagram in Lucidchart?
Everything you need to make a diagram
In addition to our online timing diagram tool, Lucidchart offers support and training resources to help you branch out to any type of diagram.
Lucid Training