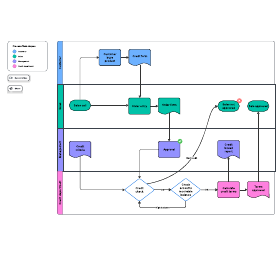
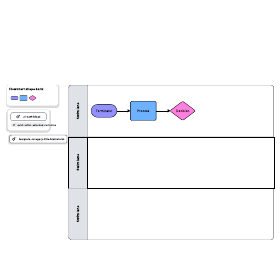
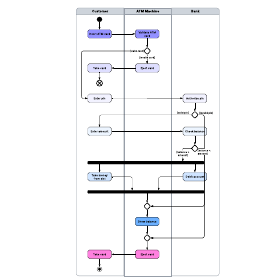
Swimlanes add an extra level of clarity about who does what to process flowcharts. If you're not familiar with using a swimlane diagram tool like Lucidchart, here's everything you need to know, including what they are, and how to create your own swimlane diagram.
What are swimlane diagrams?
A swimlane diagram is a type of flowchart that delineates who does what in a process. Using the metaphor of lanes in a pool, a swimlane diagram provides clarity and accountability by placing process steps within the horizontal or vertical “swimlanes” of a particular employee, work group or department. It shows connections, communication and handoffs between these lanes, and it can serve to highlight waste, redundancy and inefficiency in a process.
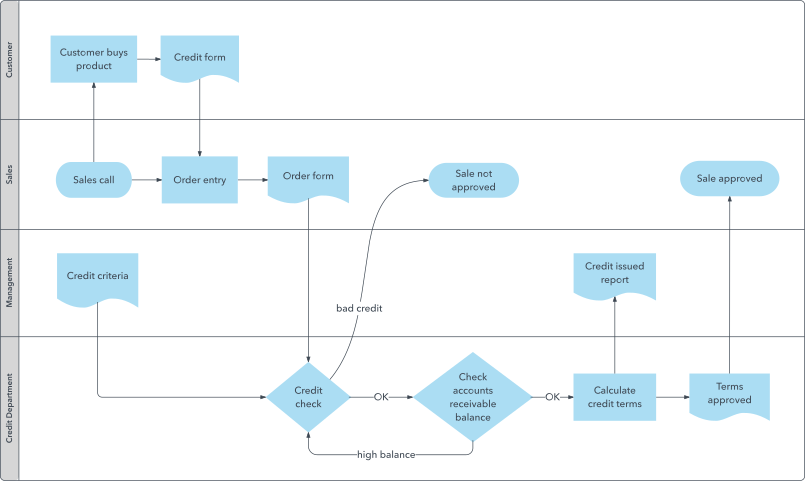
This type of diagram is also known as a Rummler-Brache diagram or a cross-functional diagram (swimlanes are sometimes called functional bands). Swimlanes (also written as "swim lanes") are used as a valuable element in Business Process Model and Notation, opens in a new tab (BPMN and BPMN 2.0); its software design counterpart, Unified Modeling Language (UML); and process flow diagrams, opens in a new tab (PFDs.) Standard symbols used in all these types of diagrams, combined with the swimlanes, can provide an easy-to-read visual representation of responsibilities in a process.
Master the basics of Lucidchart in 3 minutes
- Create your first diagram from a template or blank canvas or import a document.
- Add text, shapes, and lines to customize your diagram.
- Learn how to adjust styling and formatting.
- Locate what you need with Feature Find.
- Share your diagram with your team to start collaborating.
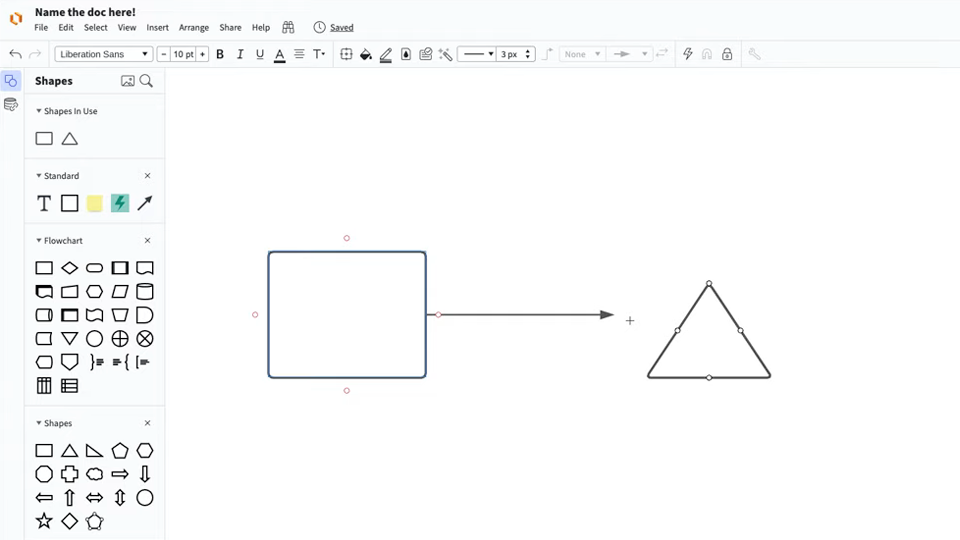
Master the basics of Lucidchart in 3 minutes
History of swimlanes
In the 1940s, a variation of early flow process charts called multi-column process charts began appearing. They were used to spell out processes involving more than one unit or department, similar in purpose if not appearance to today’s swimlane diagrams.
In 1990, Geary Rummler and Alan Brache published their book Improving Processes and highlighted swimlane diagrams. The diagrams now are sometimes called Rummler-Brache diagrams after the authors. In Microsoft Office Visio, they’re called cross-functional diagrams. In computer engineering, the swimlane term also appears in JBoss Process Definition Language. This history shows efforts to solve a continuing business problem of process clarity and accountability, leading to today’s well-established usages.
Swimlane purposes and benefits
In today’s organizations with multiple work groups or departments, this diagramming can help in various ways:
- It can help to ensure that the right hand knows what the left is doing in an organization. Swimlane Diagrams, and swimlanes used in other diagram types, highlight which process steps or sub-processes are assigned to a particular actor in the organization.
- By spelling this out in a diagram, you can highlight redundancies between different lanes and identify bottlenecks, waste and other inefficiencies. This sometimes reveals duplicative or unnecessary steps in a process, such as different departments performing the same task. It also can highlight process delays or capacity constraints within a particular swimlane so that they can be addressed and resolved. This can increase performance and quality and reduce unnecessary work and costs.
- You can use a second Swimlane Diagram to model a better way to structure the process or to account for changing circumstances, such as staffing changes or technology changes.
- Like other diagrams, Swimlane Diagrams can communicate in clearer terms than a narrative description would.
- Swimlane Diagrams can be formalized as a way to integrate processes between teams or departments, resulting in cleaner processes on an ongoing basis.
Attributes and elements of swimlane diagrams
Using standard symbols of whatever type of process flow chart is being produced, swimlanes introduce parallel or vertical or horizontal lines grouping the process steps by actor, such as employee, work group department or even an information system. Each lane is labeled by that actor. Sometimes, but not always, horizontal lanes are more practical given that desktop computer screens are wider than tall. Process steps are spelled out within their respective lanes, and also shown are the interconnection of steps between lanes. This shows how the different actors interact to keep a process rolling efficiently.
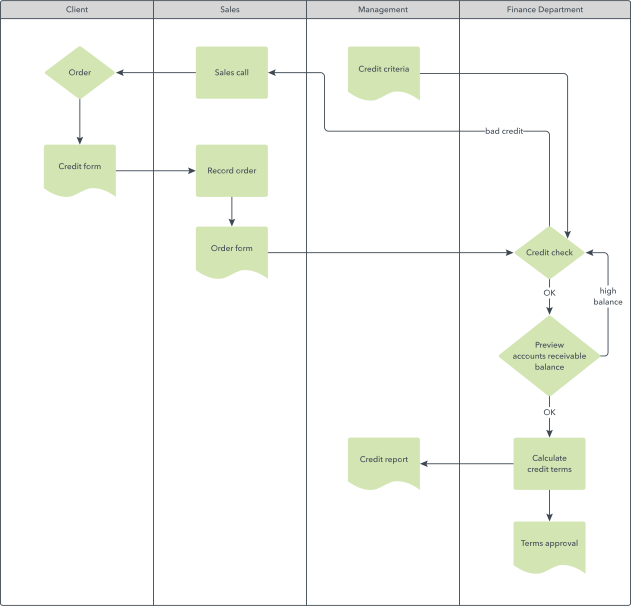
Swimlanes as an element of BPMN 2.0 diagram
In BPMN 2.0, pools/swimlanes are of one of four element types for Business Process Diagrams. A pool represents major participants in a process. A different pool may be in a different company or department, but still involved in the process. Swim lanes within a pool show the activities and flows for a certain role or participant, defining who is accountable for what parts of the process. The three other element types are:
- Flow objects: Events, activities, and gateways
- Connecting objects: sequence flow, message flow, and association
- Artifacts: data object, group, and annotation
You can learn more about BPMN symbols here, opens in a new tab.
How to do research for a swimlane diagram (a.k.a., Rummler-Brache Diagram)
- Determine your goal and what process or processes should be studied to achieve that goal. Think about what level of detail is needed to have sufficient understanding to be effective.
- Break the work down into manageable pieces, but make sure that you’re studying a complete process so that you can effectively see it and potentially improve it. Clearly identify the boundaries of the process to be studied.
- Identify the swimlanes which may be employees, work groups or departments.
- For an existing process, research the process steps, both the “who” and “what,” so they can be divided into their respective swimlanes. Spell out the interconnections, communications and handoffs between the lanes. Document the process as it is, but you might be on the lookout for process gaps, redundancy or outright duplication, bottlenecks and other inefficiencies. Take note that sometimes redundancy is purposely built into a process for safety or quality purposes. You might take notes, and do a hand-drawn diagram or Post-It Notes, that you can later refine with diagramming software.
- For a new process being modeled, spell out the process steps that would increase efficiency and quality and/or reduce delays and cost.
- Special note: For an involved process being documented with Process Flow Diagrams (PFDs), Business Process Model Notation 2.0 (BPMN 2.0) or other diagram types, a team with expertise in these methods might perform this research, and use swimlanes as an element of them.
Everything you need to make a diagram
Make a polished, professional diagram for free with Lucidchart. No matter what you have in mind, we have the tools you need to build it. Make an account and start diagramming today.
Sign up free