Project network diagrams are the magical flowcharts that every project manager should know and love. As opposed to communicating a project plan with lengthy blocks of text, project network diagrams allow PMs to summarize their plans in one visual that viewers can easily digest and understand. When combined with the critical path method (CPM), opens in a new tab, project network diagrams also help determine how long a project will take and which tasks will be the most important to complete on time.
Intrigued? Read on to learn more about project network diagrams and how to make them in Lucidchart.
What is a project network diagram?
Commonly mistaken for work breakdown structures (WBS), opens in a new tab, project network diagrams are similar but not the same thing. While a WBS divides project deliverables into manageable pieces, a project network diagram takes those pieces and the tasks required to complete them and organizes them chronologically. In short, a work breakdown structure shows a whole and its parts, while a project network diagram shows a sequence of events.
Because project network diagrams show chronology, PMs always draw them left to right, like reading a book.
There are two formats for drawing project network diagrams. The first format, activity on node, shows an event as a box, also known as a node. Arrows connect events together to show sequence. The second format, activity on arrow, shows events on the arrows that connect nodes. Of the two formats, diagrammers typically use activity on node over activity on arrow.

Other names for a project network diagram include project management network diagram, project flow diagram, project flow chart, project management flow chart, and project management process flow chart. No matter what you call them, these diagrams are fantastic productivity tools.
How to build a project network diagram
Project network diagrams are indeed magical, but they don’t build themselves. These steps should get you started.
1. Start with a predecessor table
You might be thinking, “Woah! I thought this was about network diagrams, not tables!” Don’t worry—it is. Predecessor tables list all of the tasks in your project along with their immediate predecessors, tasks one must complete before starting another task. With this information, your network diagram will fall right into place.
Suppose you want to make lasagna. This could be your predecessor table (built in Lucidchart, of course):

2. Build the flowchart
Drag a process box onto your canvas and label it “Start.” Then, lay down boxes for each of the tasks that do not have an immediate predecessor, or tasks 1, 3, and 5 in our example. These will connect to the start box. Task 2 comes immediately after task 1, so put them close together and connect them. Continue to do this until all of your tasks have been charted and connected. As you build, remember that project network diagrams are read from left to right. Your flowchart will look something like this when you finish:
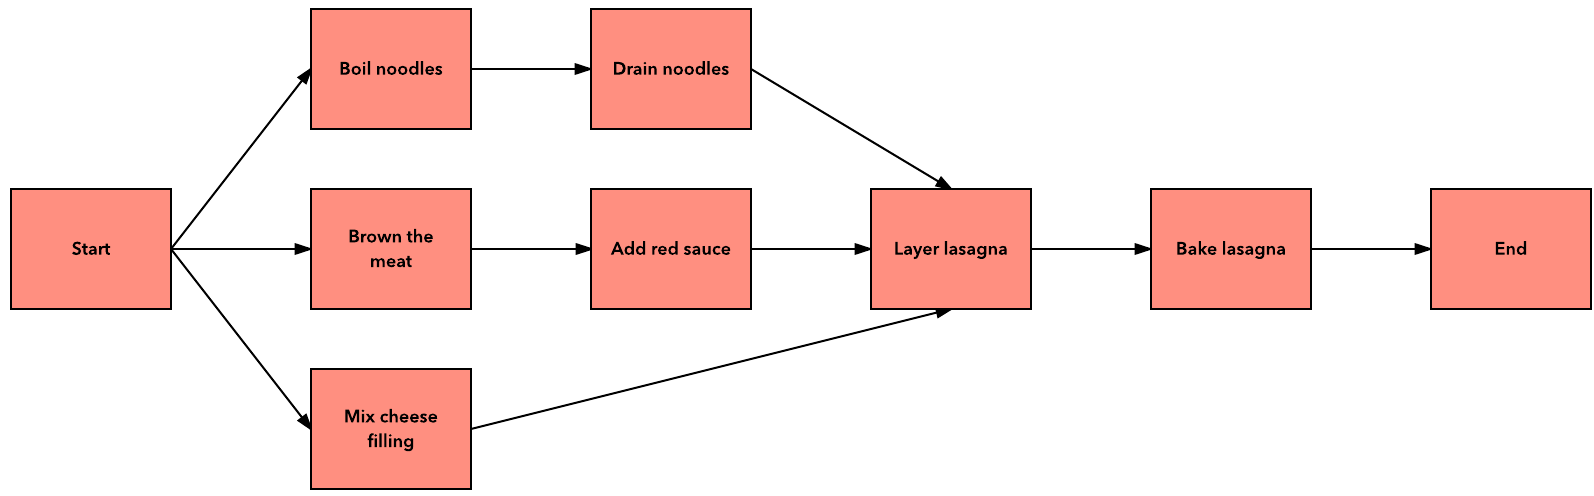
If you want, you could stop right here. But for extra magic, you can apply the Critical Path Method to determine how long your project will take and which tasks are the most important to complete on time.
3. Apply the critical path method.
The best way to understand the critical path method is to use it, so let’s jump right in.
First, go back to your project network diagram and figure out how long each step will take.
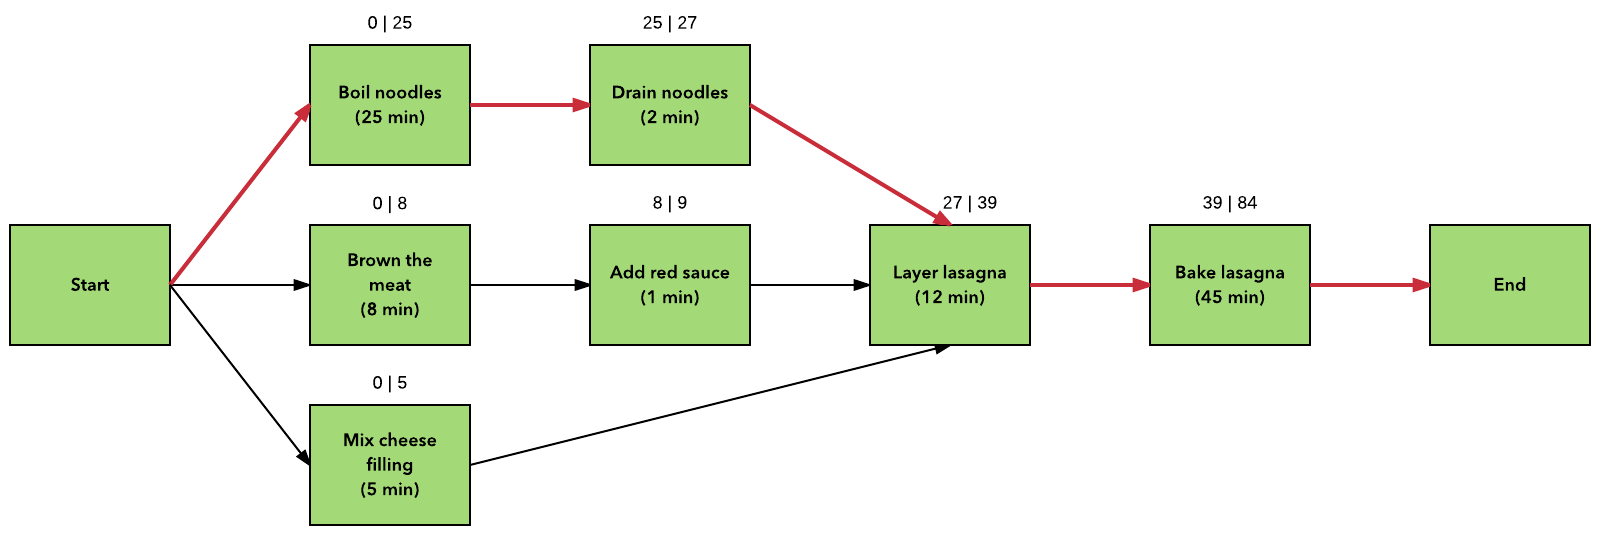
Next, determine the start and end times for each task. All of the tasks immediately after “Start” will begin at minute 0. The tasks that follow will begin when their latest predecessor ends. For example, notice that “layer lasagna” begins at minute 27 because boiling and draining noodles takes longer than making red sauce and mixing cheese.
You now have a projected end time for making lasagna. Assuming that you can do three things at once, or that you invited some friends, it will take you 84 minutes. The critical path is the noodles. If preparing the noodles starts late or takes too long, you will run behind schedule. On the other hand, you have 18 minutes of flex time on the red sauce and 22 minutes of flex time on the cheese mixture.
Bon appétit and happy diagramming!
Ready to create your own project network diagram? Try our free template.
Open template