Key takeaways
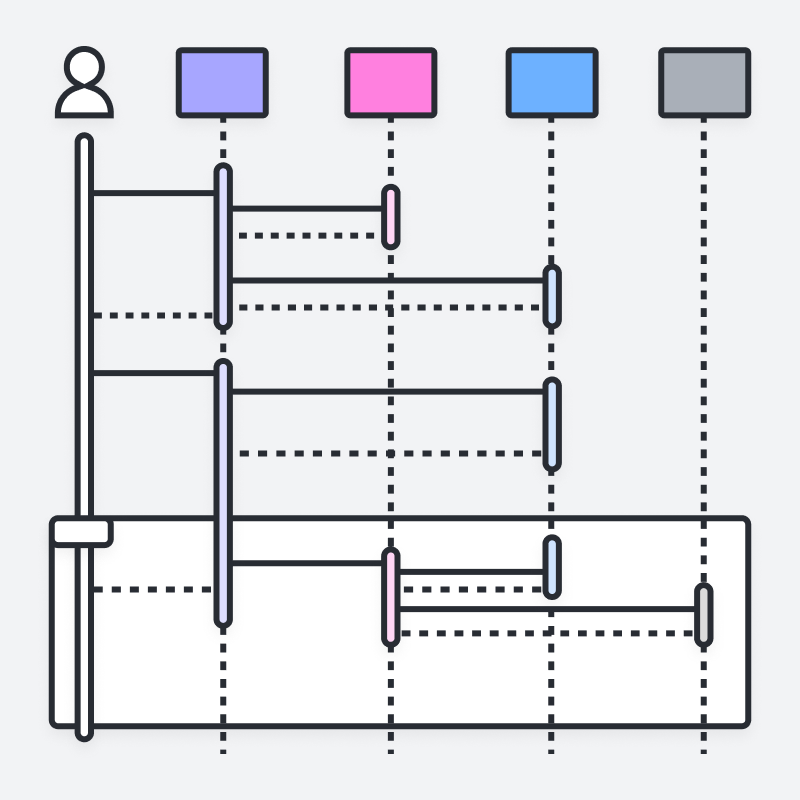
A sequence diagram is a type of UML interaction diagram that shows how objects exchange messages over time along their lifelines.
Software developers and business stakeholders both use sequence diagrams to specify requirements for new systems, document existing processes, and model complex logic.
The core building blocks of sequence diagrams include lifelines, activation boxes, actors, objects, and message arrows that read from top to bottom in execution order.
Common real-world examples of sequence diagram applications include ATM cash withdrawals, hospital management systems, and web application login and authentication flows.
You can easily build a sequence diagram in Lucidchart by dragging shapes manually, typing UML markup, or generating a diagram with Lucid AI.
Sequence diagrams are a popular dynamic modeling solution in UML because they specifically focus on lifelines, or the processes and objects that live simultaneously, and the messages exchanged between them to perform a function before the lifeline ends. Along with our UML diagramming tool, use this guide to learn everything there is to know about sequence diagrams in UML.
What is a sequence diagram in UML?
UML (Unified Modeling Language) is a standardized way to visualize the design of a system. A sequence diagram is a type of interaction diagram that describes how, and in what order, a group of objects works together. They are also called event diagrams or event scenarios.
Software developers and business professionals use sequence diagrams—also known as event diagrams or event scenarios—to visualize interactions over time, clarify system requirements, and clarify complex processes for both technical and non-technical stakeholders.
What is a system sequence diagram (SSD)?
A system sequence diagram (SSD) is a subtype of sequence diagram. It treats the system as a single "black box" and focuses on the event flow between external actors and the system for one use case.
An SSD can help you:
Model operations step by step in response to events.
Map the main success scenario first, then add alternative paths.
Identify major system events and operations to estimate resources.
What are the benefits of sequence diagrams?
A sequence diagram turns abstract logic into an ordered, readable flow that teams can review and act on. Sequence diagrams also:
Represent the details of a UML use case.
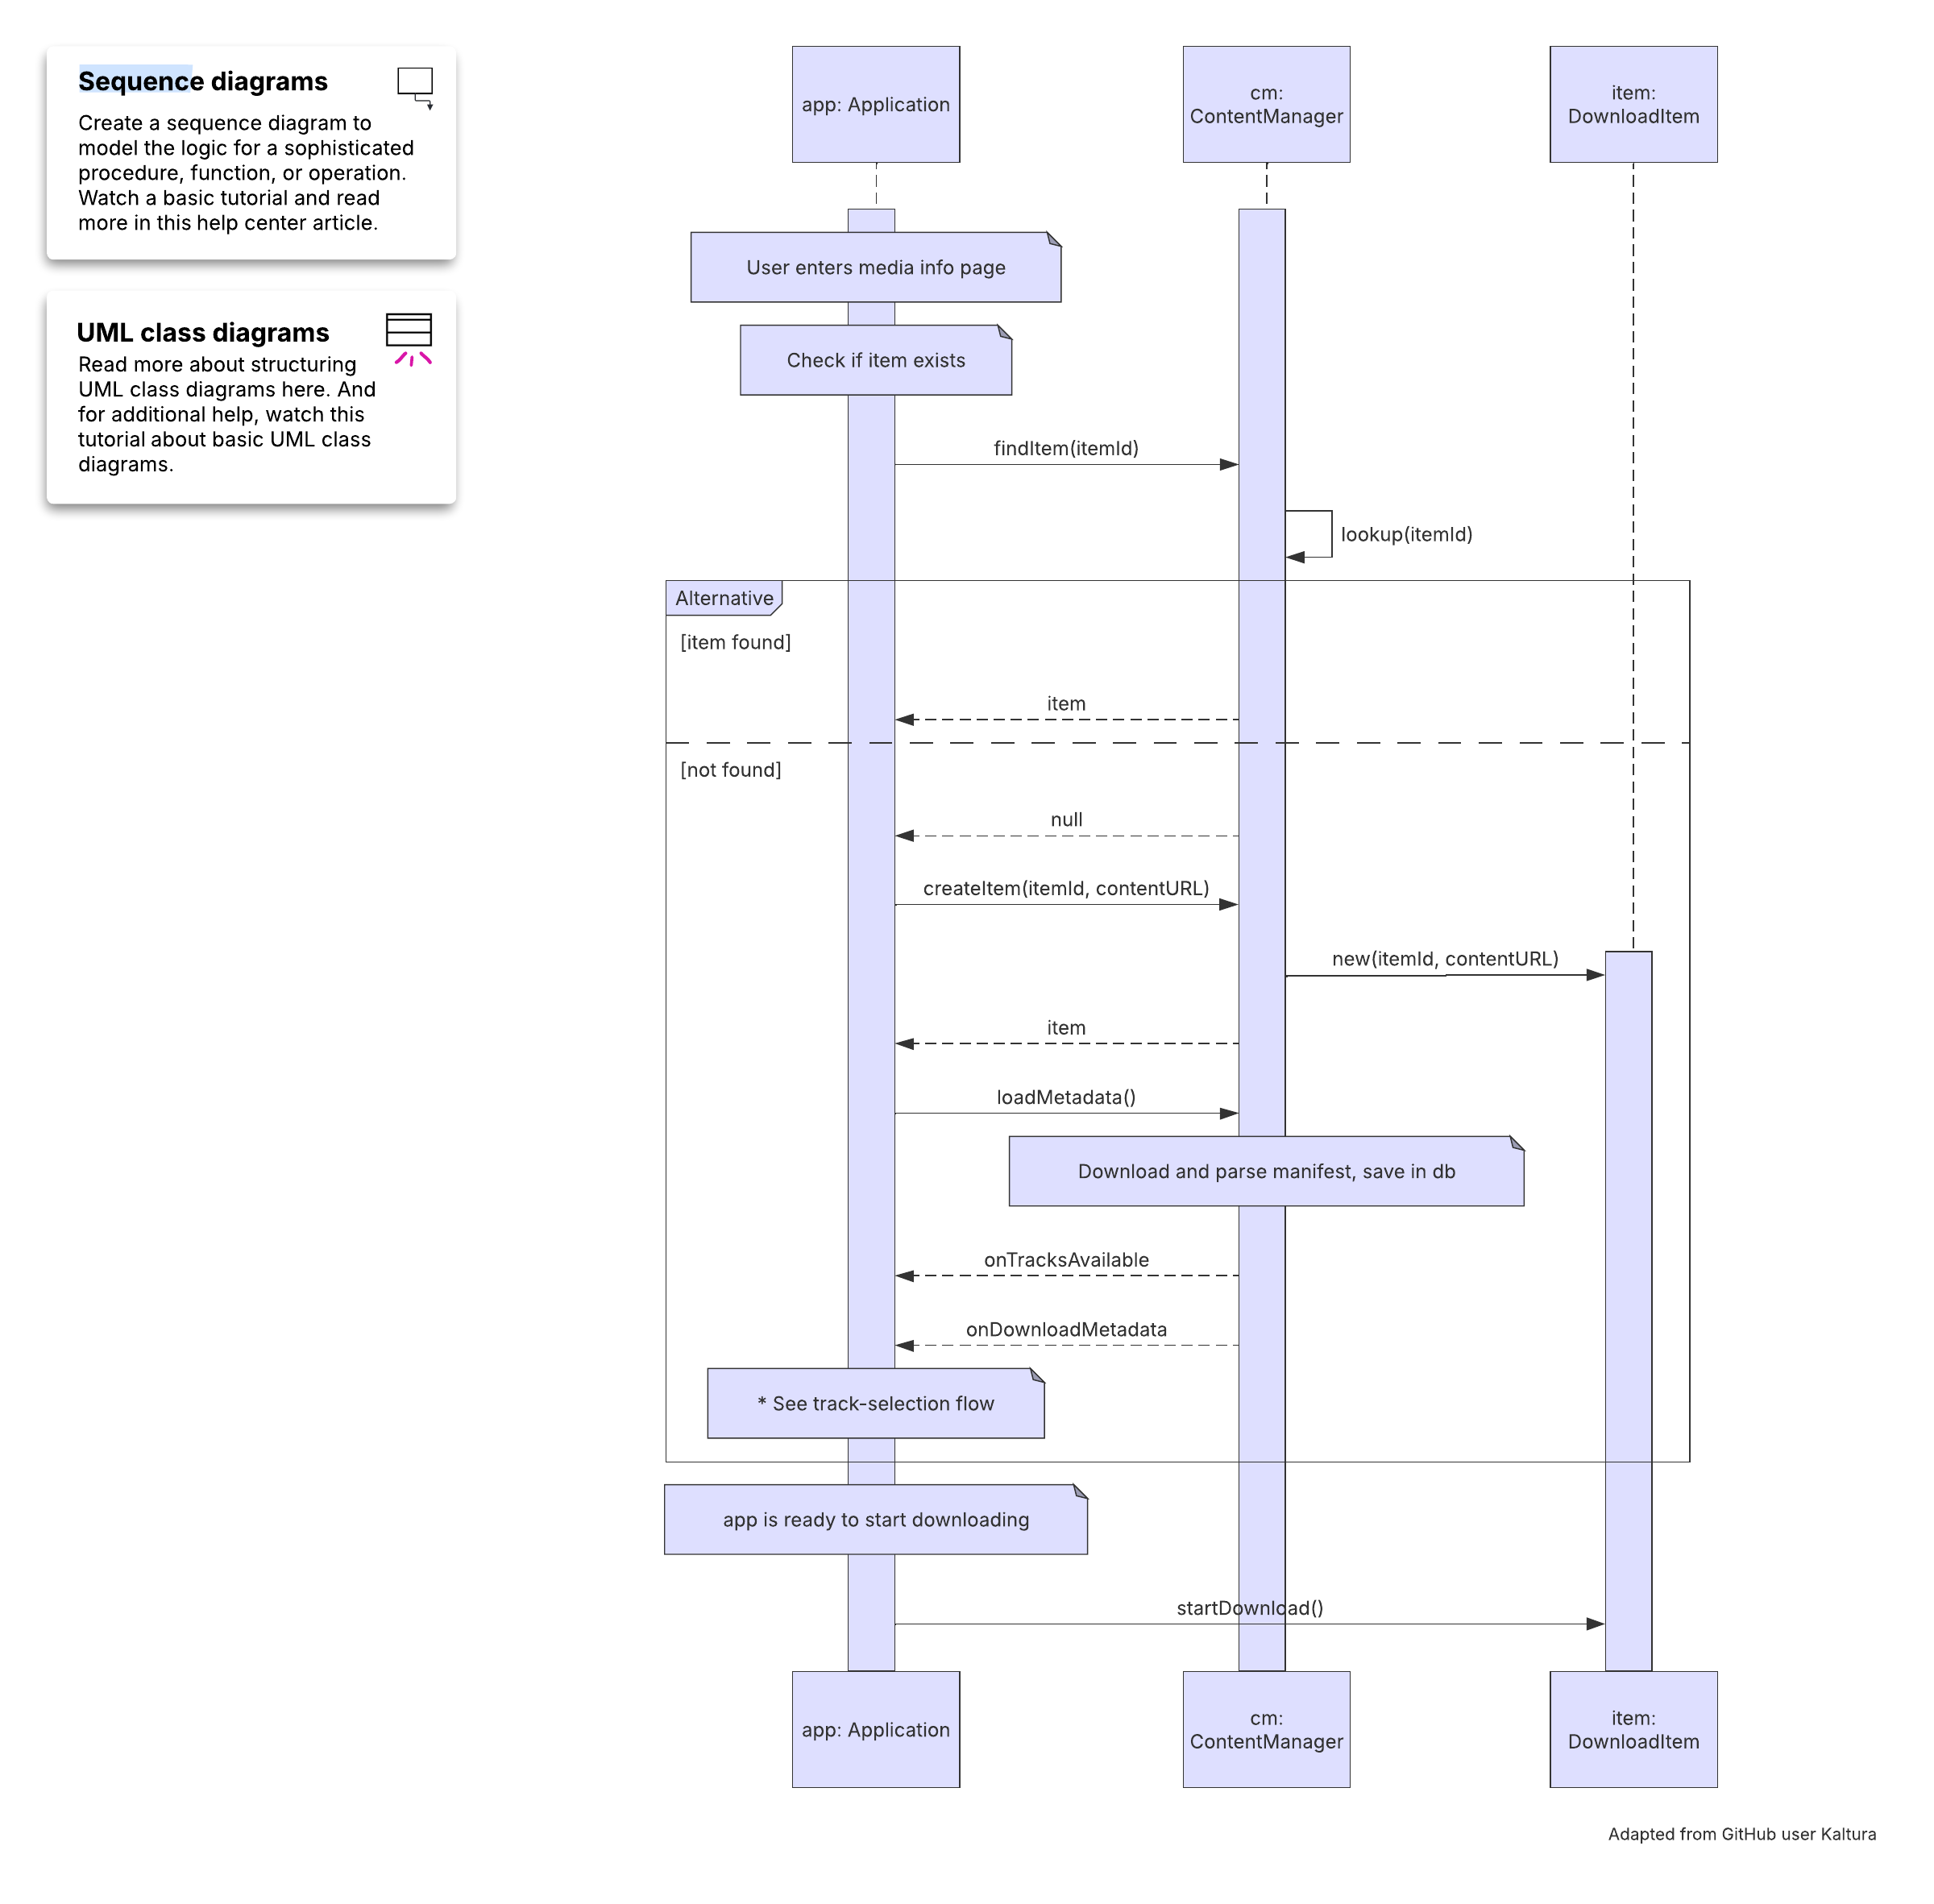
Model the logic of a sophisticated procedure, function, or operation.
Visualize how objects and components interact across lifelines to complete a process.
Understand the detailed functionality of an existing scenario and plan future scenarios.
Clarify how the system responds to external events and which operations those events should trigger.
Use cases for sequence diagrams
Sequence diagrams fit both technical and operational scenarios, allowing you to diagram:
Usage scenarios, which show how a system can be used and how its parts interact
Method logic, which explores the logic of a specific method or operation
Service logic, which maps a service shared by many methods or components
You can also import existing sequence diagrams from other tools. Lucidchart accepts Visio files (.vsd and .vdx), making it a strong Microsoft Visio alternative for teams migrating their diagrams.
Basic symbols and components
A small set of shapes covers most sequence diagrams.
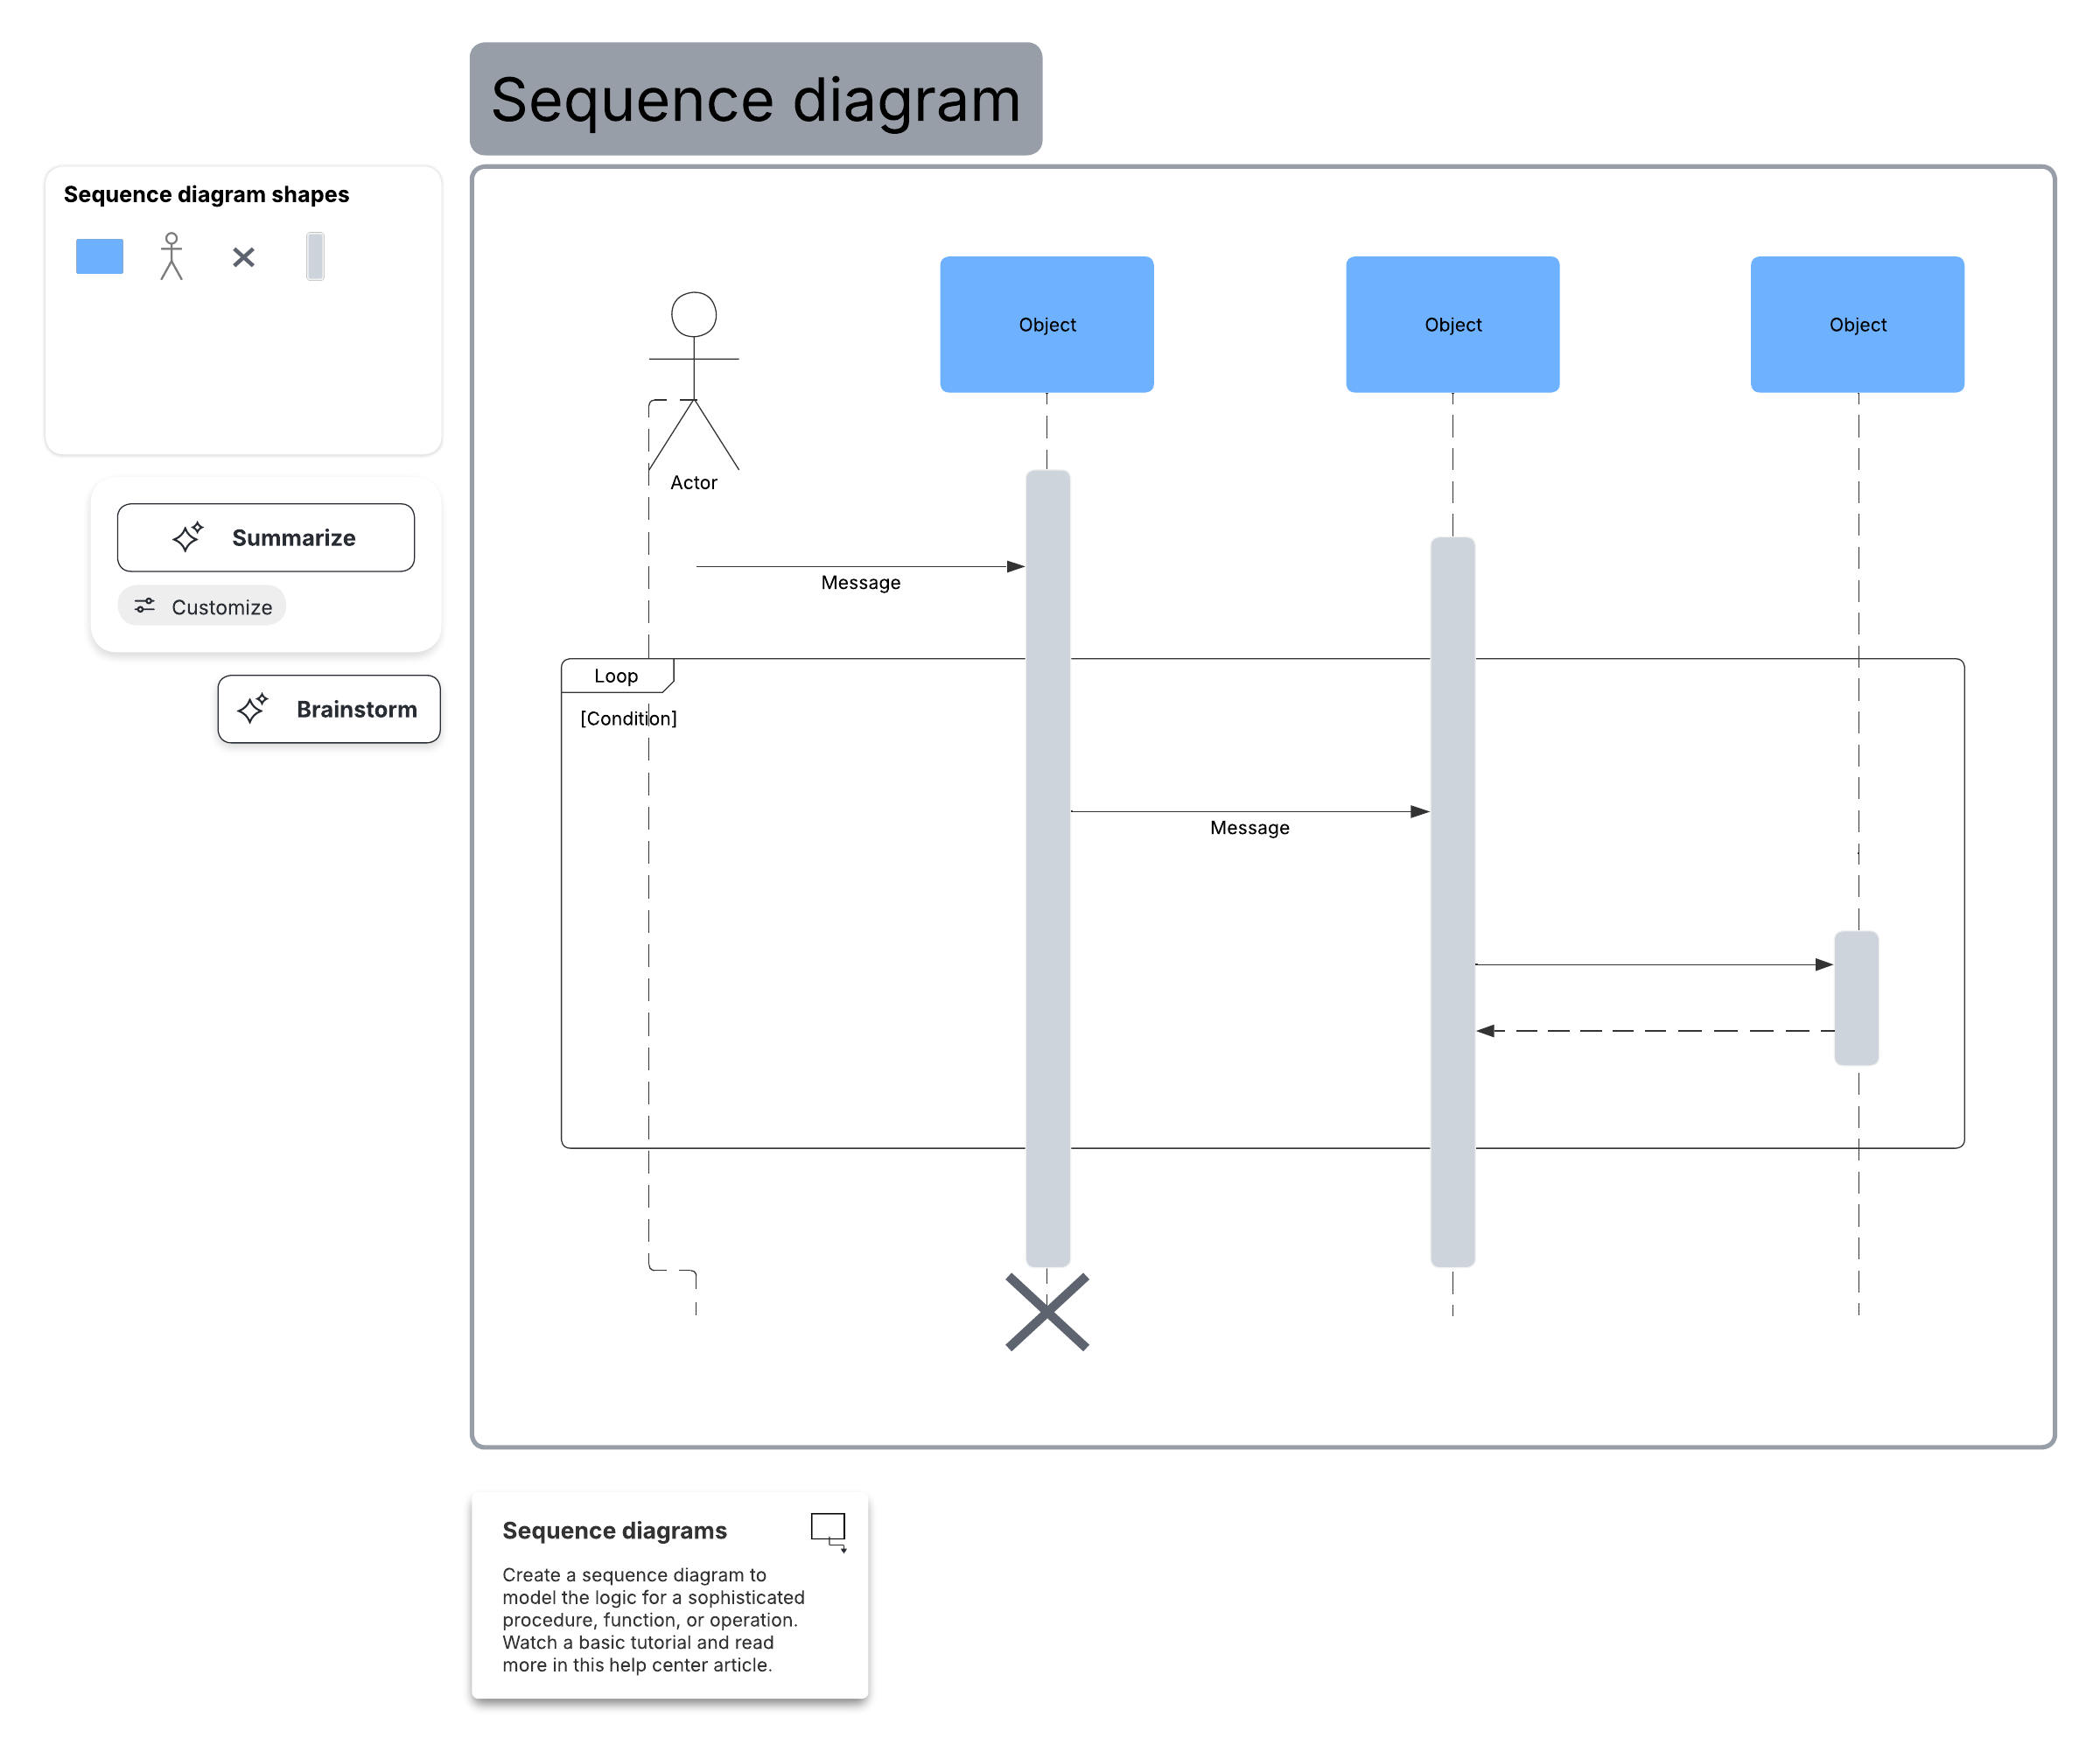
Object symbol
An object symbol represents a class or object participating in the interaction.

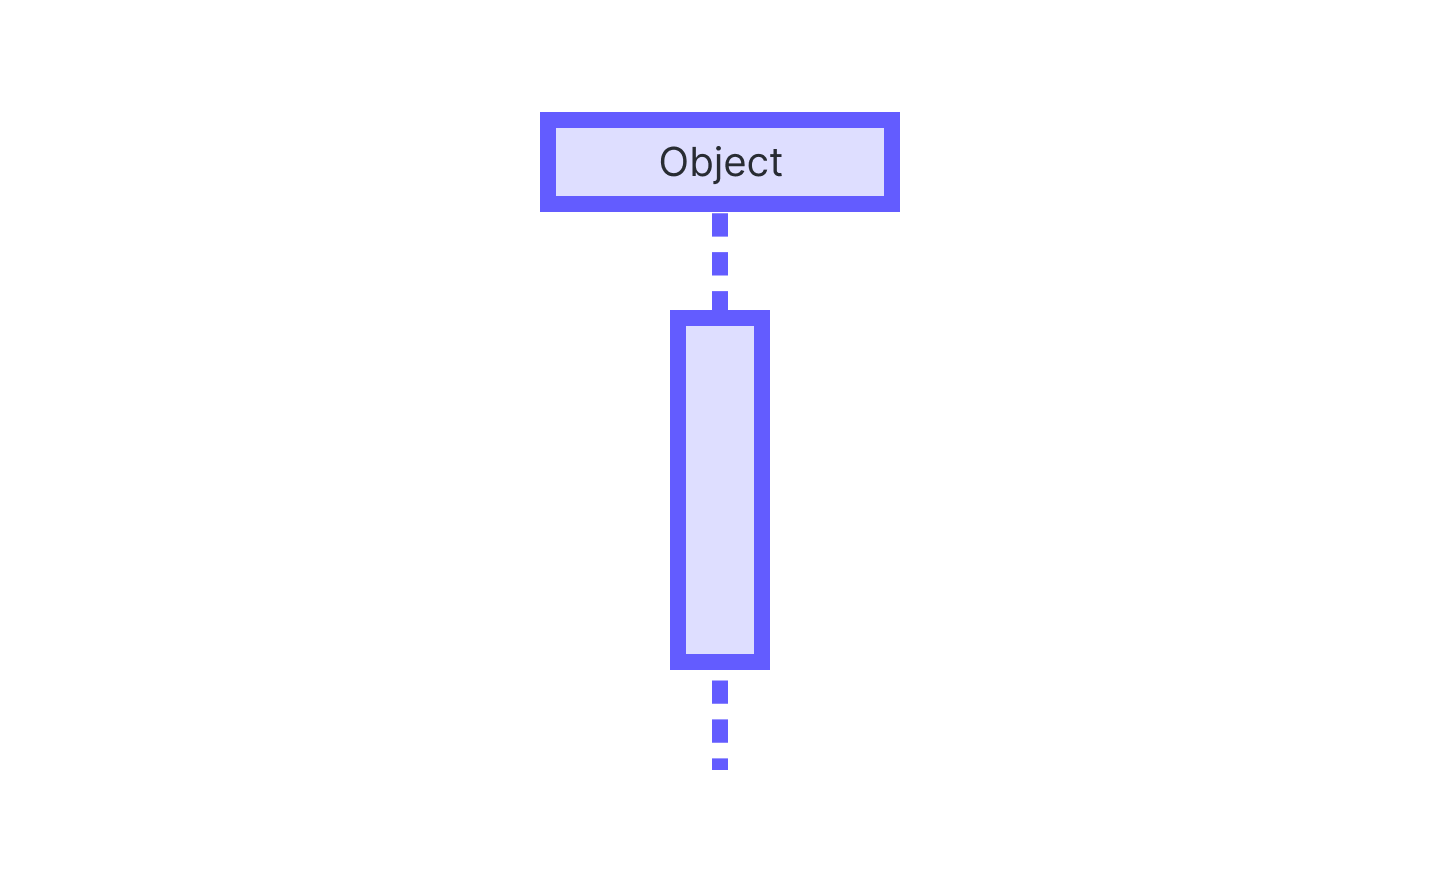
Activation box
An activation box represents the time an object needs to complete a task.

Actor symbol
The actor symbol represents the time an object needs to complete a task.

Package symbol
A package symbol, or a frame, is used in UML 2.0 notation to contain interactive elements of the diagram.

Lifeline symbol
The lifeline symbol is a dashed vertical line that represents the passage of time.
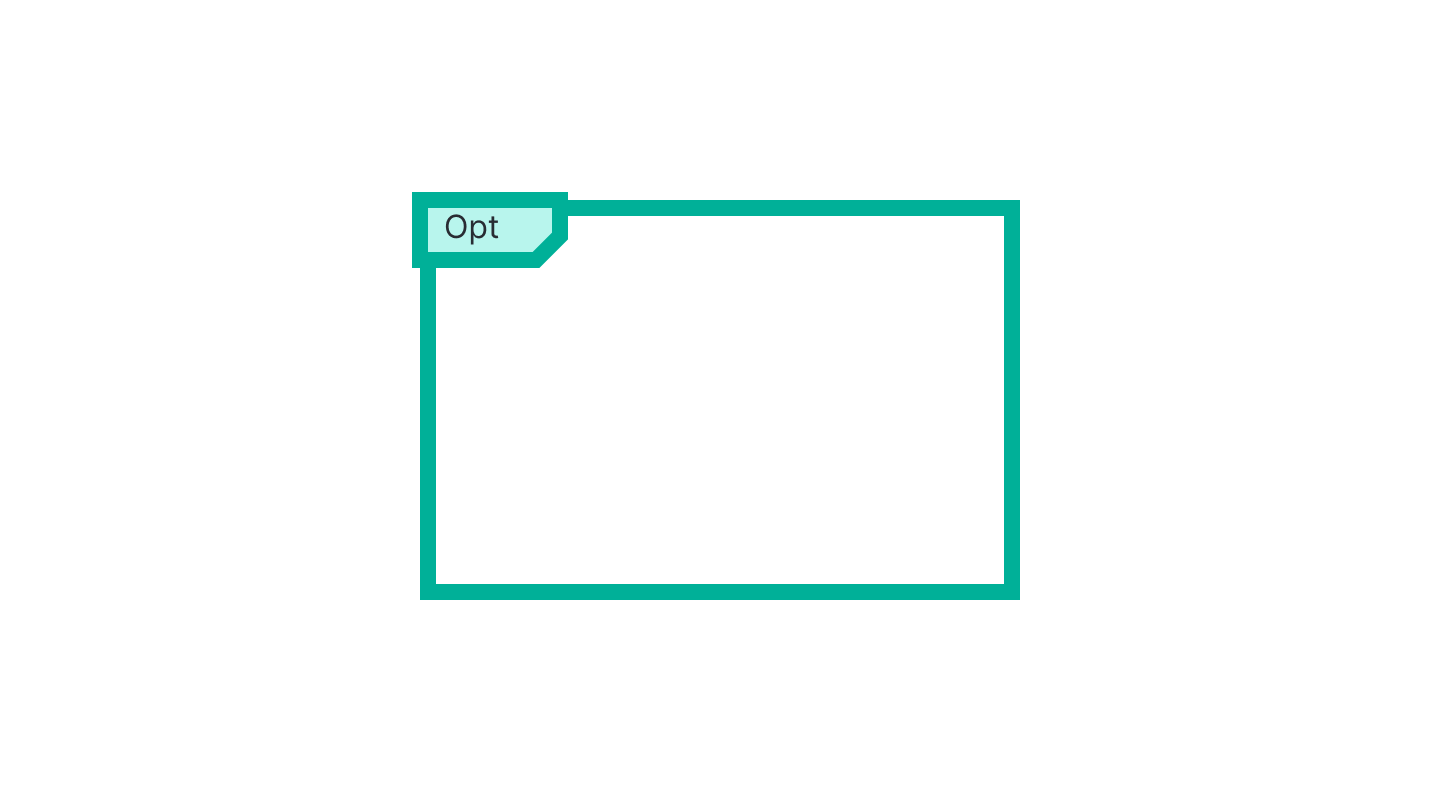
Option loop symbol
An option loop symbol models if/then conditions.
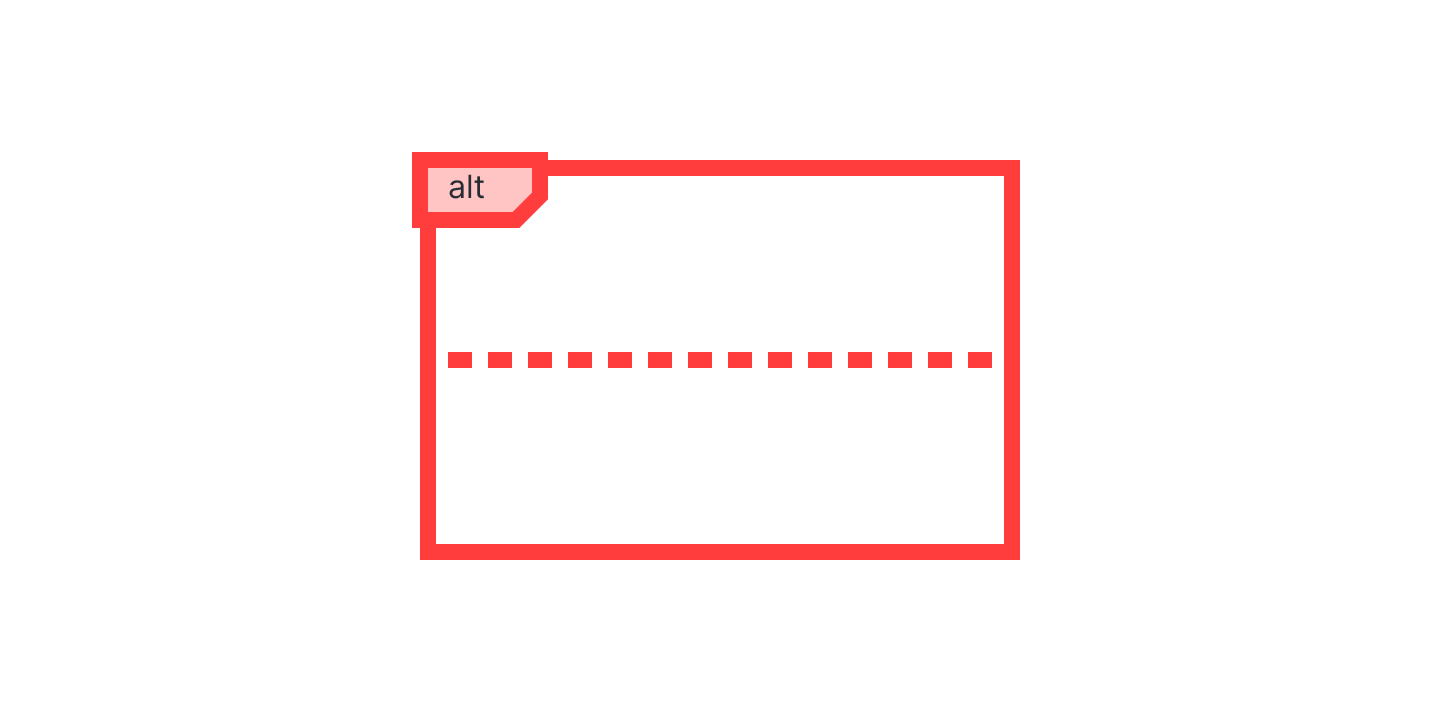
Alternative symbol
The alternative symbol represents a mutually exclusive choice between two or more message sequences.
Common message symbols
Messages are the arrows that connect lifelines. Each type carries a different meaning.
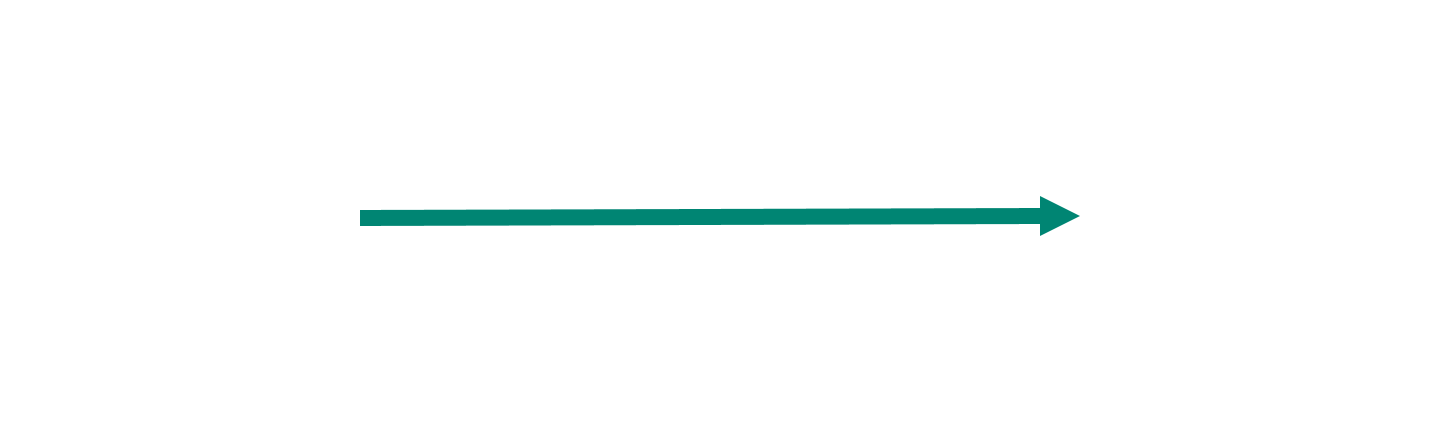
Synchronous message
A synchronous message is represented by a solid line with a solid arrowhead. It indicates a blocking call where the sender pauses and waits for a response before continuing.
Asynchronous message
An asynchronous message is represented by a solid line with a lined arrowhead that indicates a non-blocking call where the sender does not need to wait for a response.

Asynchronous return message
An asynchronous return message is represented by a dashed line with a lined arrowhead. It indicates that a status update or completion signal should be sent back to the caller asynchronously.

Asynchronous create message
Asynchronous create messages are represented by dashed lines with lined arrowheads. They indicate the creation of a new object box.

Reply message
A reply message is represented by a dashed line with a lined arrowhead. It indicates responding back to a caller after completing a synchronous request.

Delete message
A delete message is represented by a solid line with a solid arrowhead ending in an “x.” It indicates the destruction of an object.

Objects do not need to be adjacent to communicate. Messages can cross the diagram between any two lifelines.
Grouping fragments in sequence diagram markup
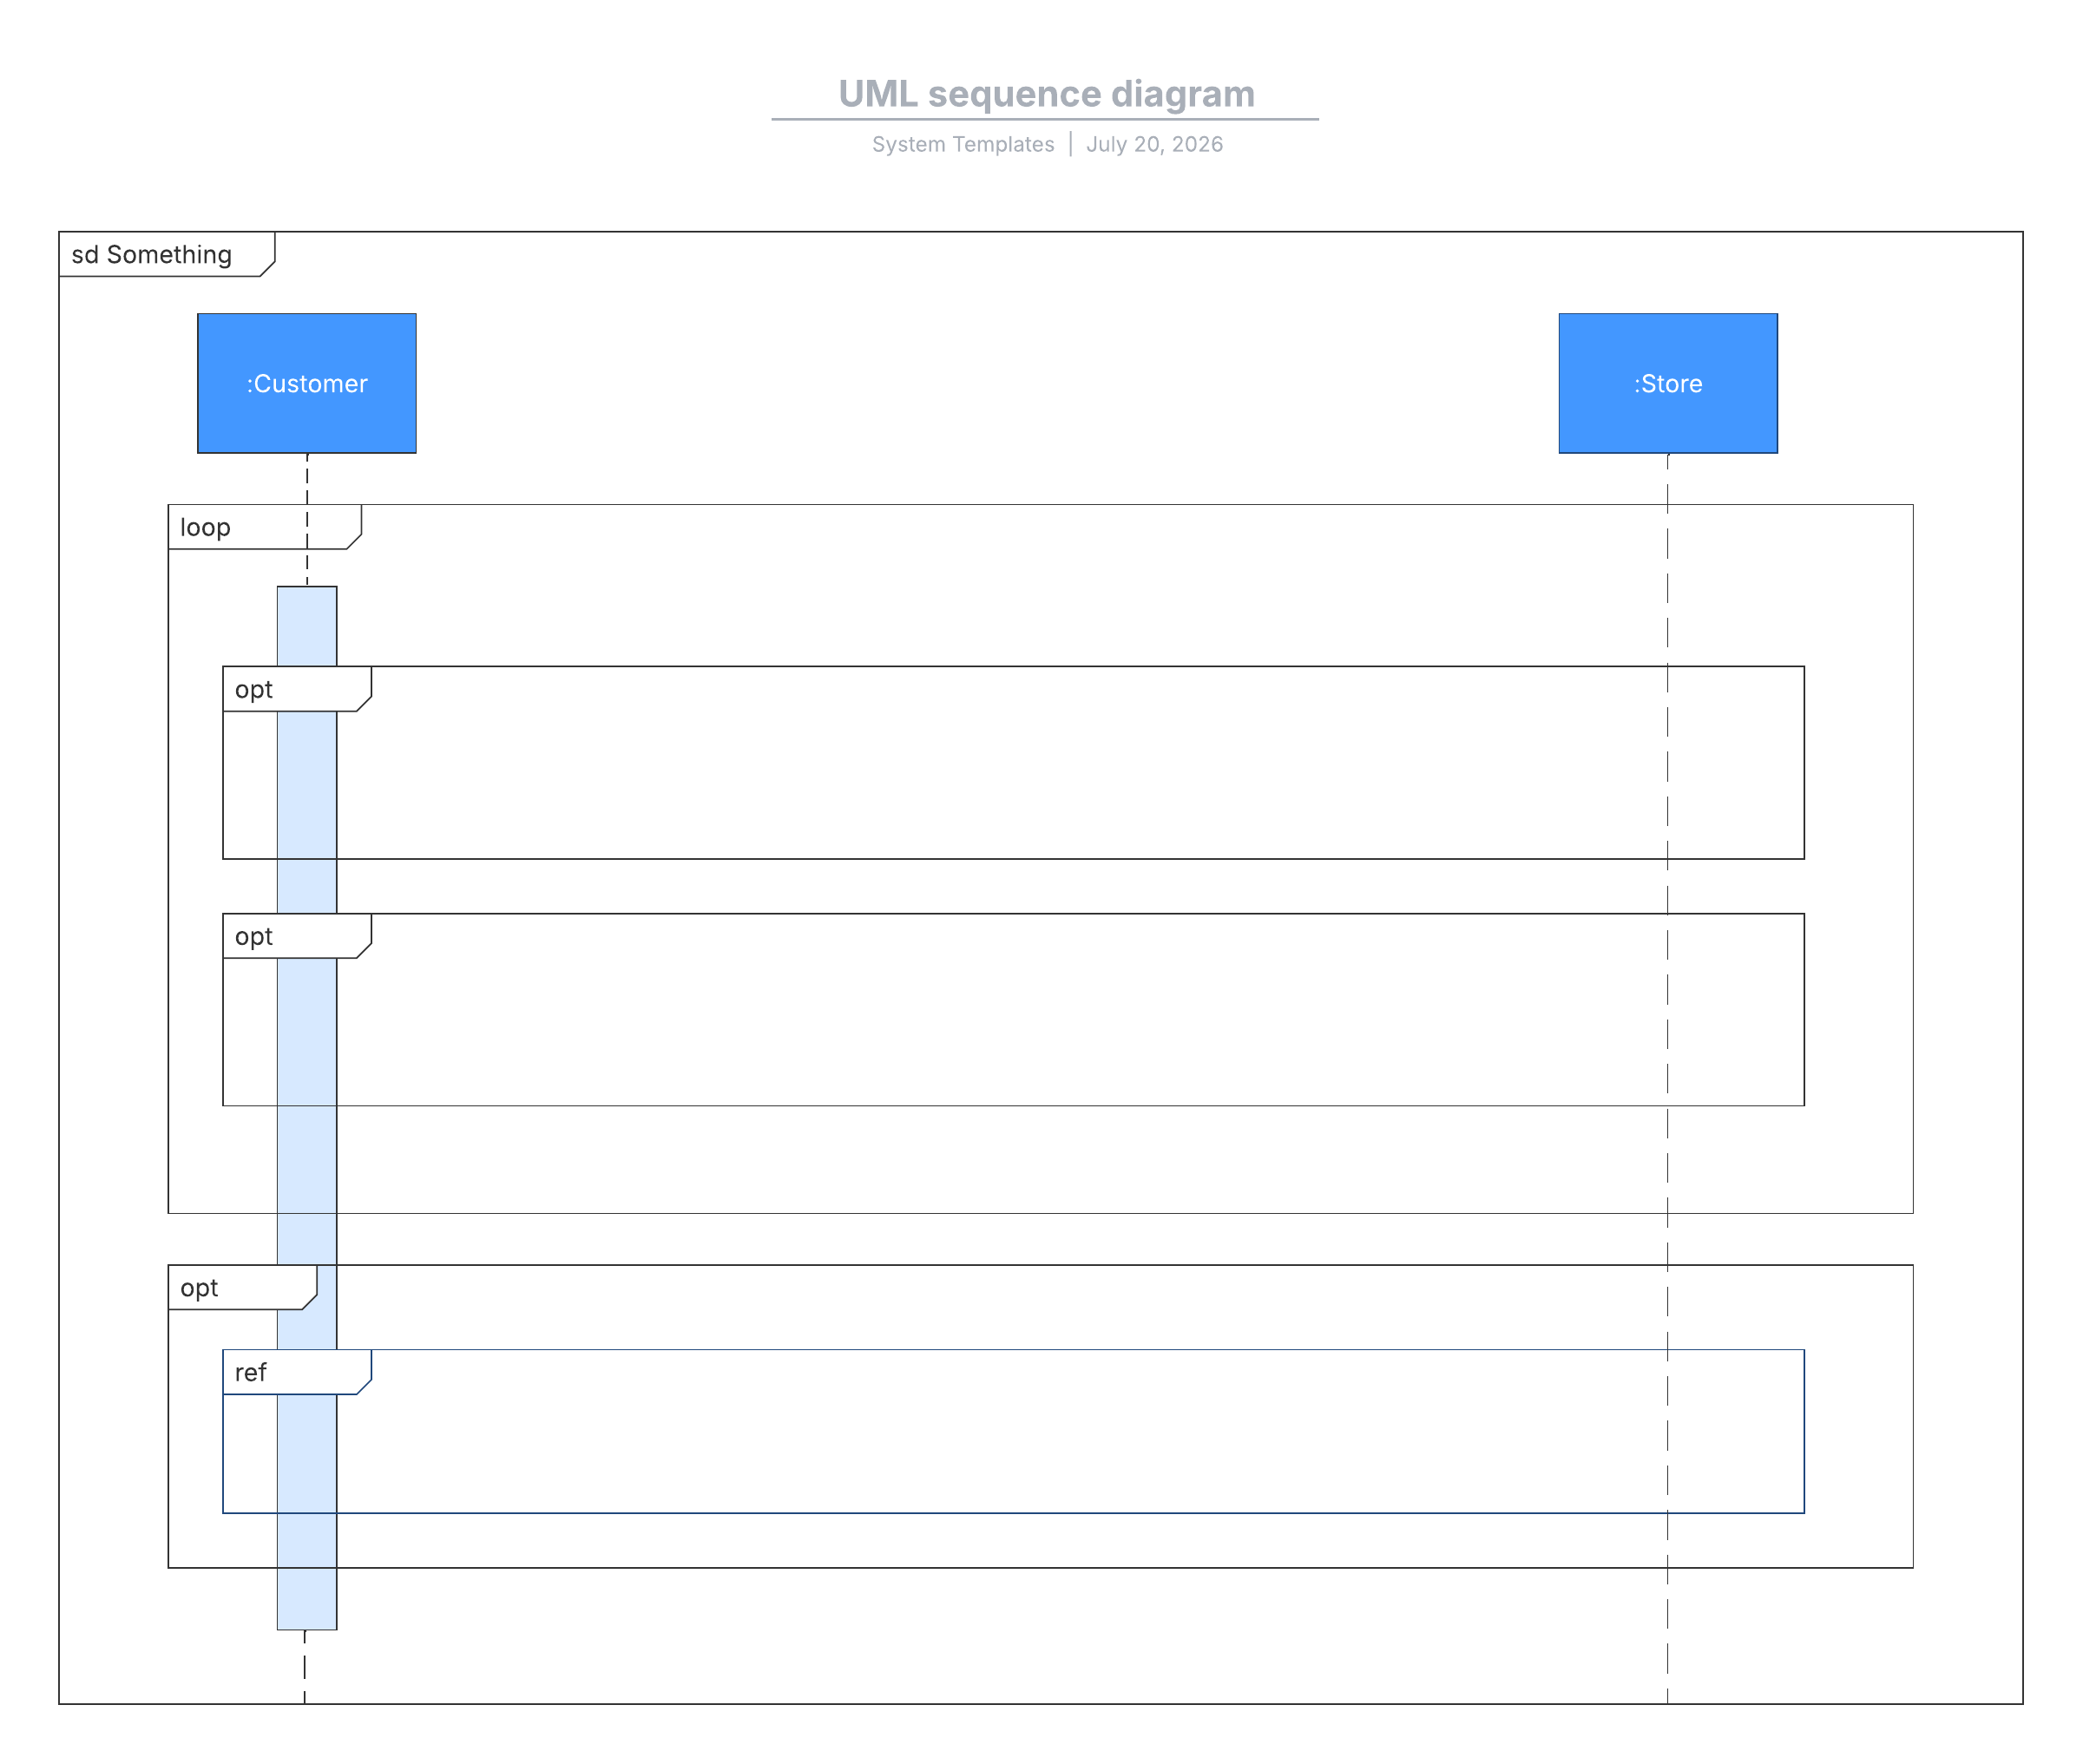
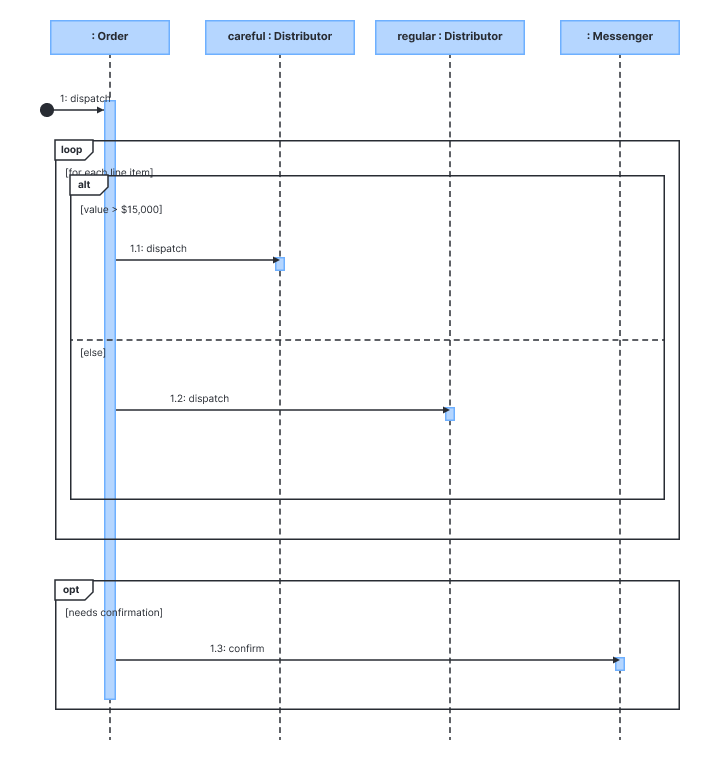
Group related messages to model conditions, repetition, and concurrency. Lucidchart's markup supports five grouping fragments:
alt: lowercase keyword used in a frame to define alternative flows, where mutually exclusive paths depend on a condition
opt: lowercase keyword used in a frame to define an optional step that runs only when its condition is met
par: lowercase keyword used in a frame to define parallel processes that run at the same time
loop: lowercase keyword used in a frame to define a sequence of steps that repeats
critical: lowercase keyword used in a frame to define a section of process execution that must run without interruption
Sequence diagram examples
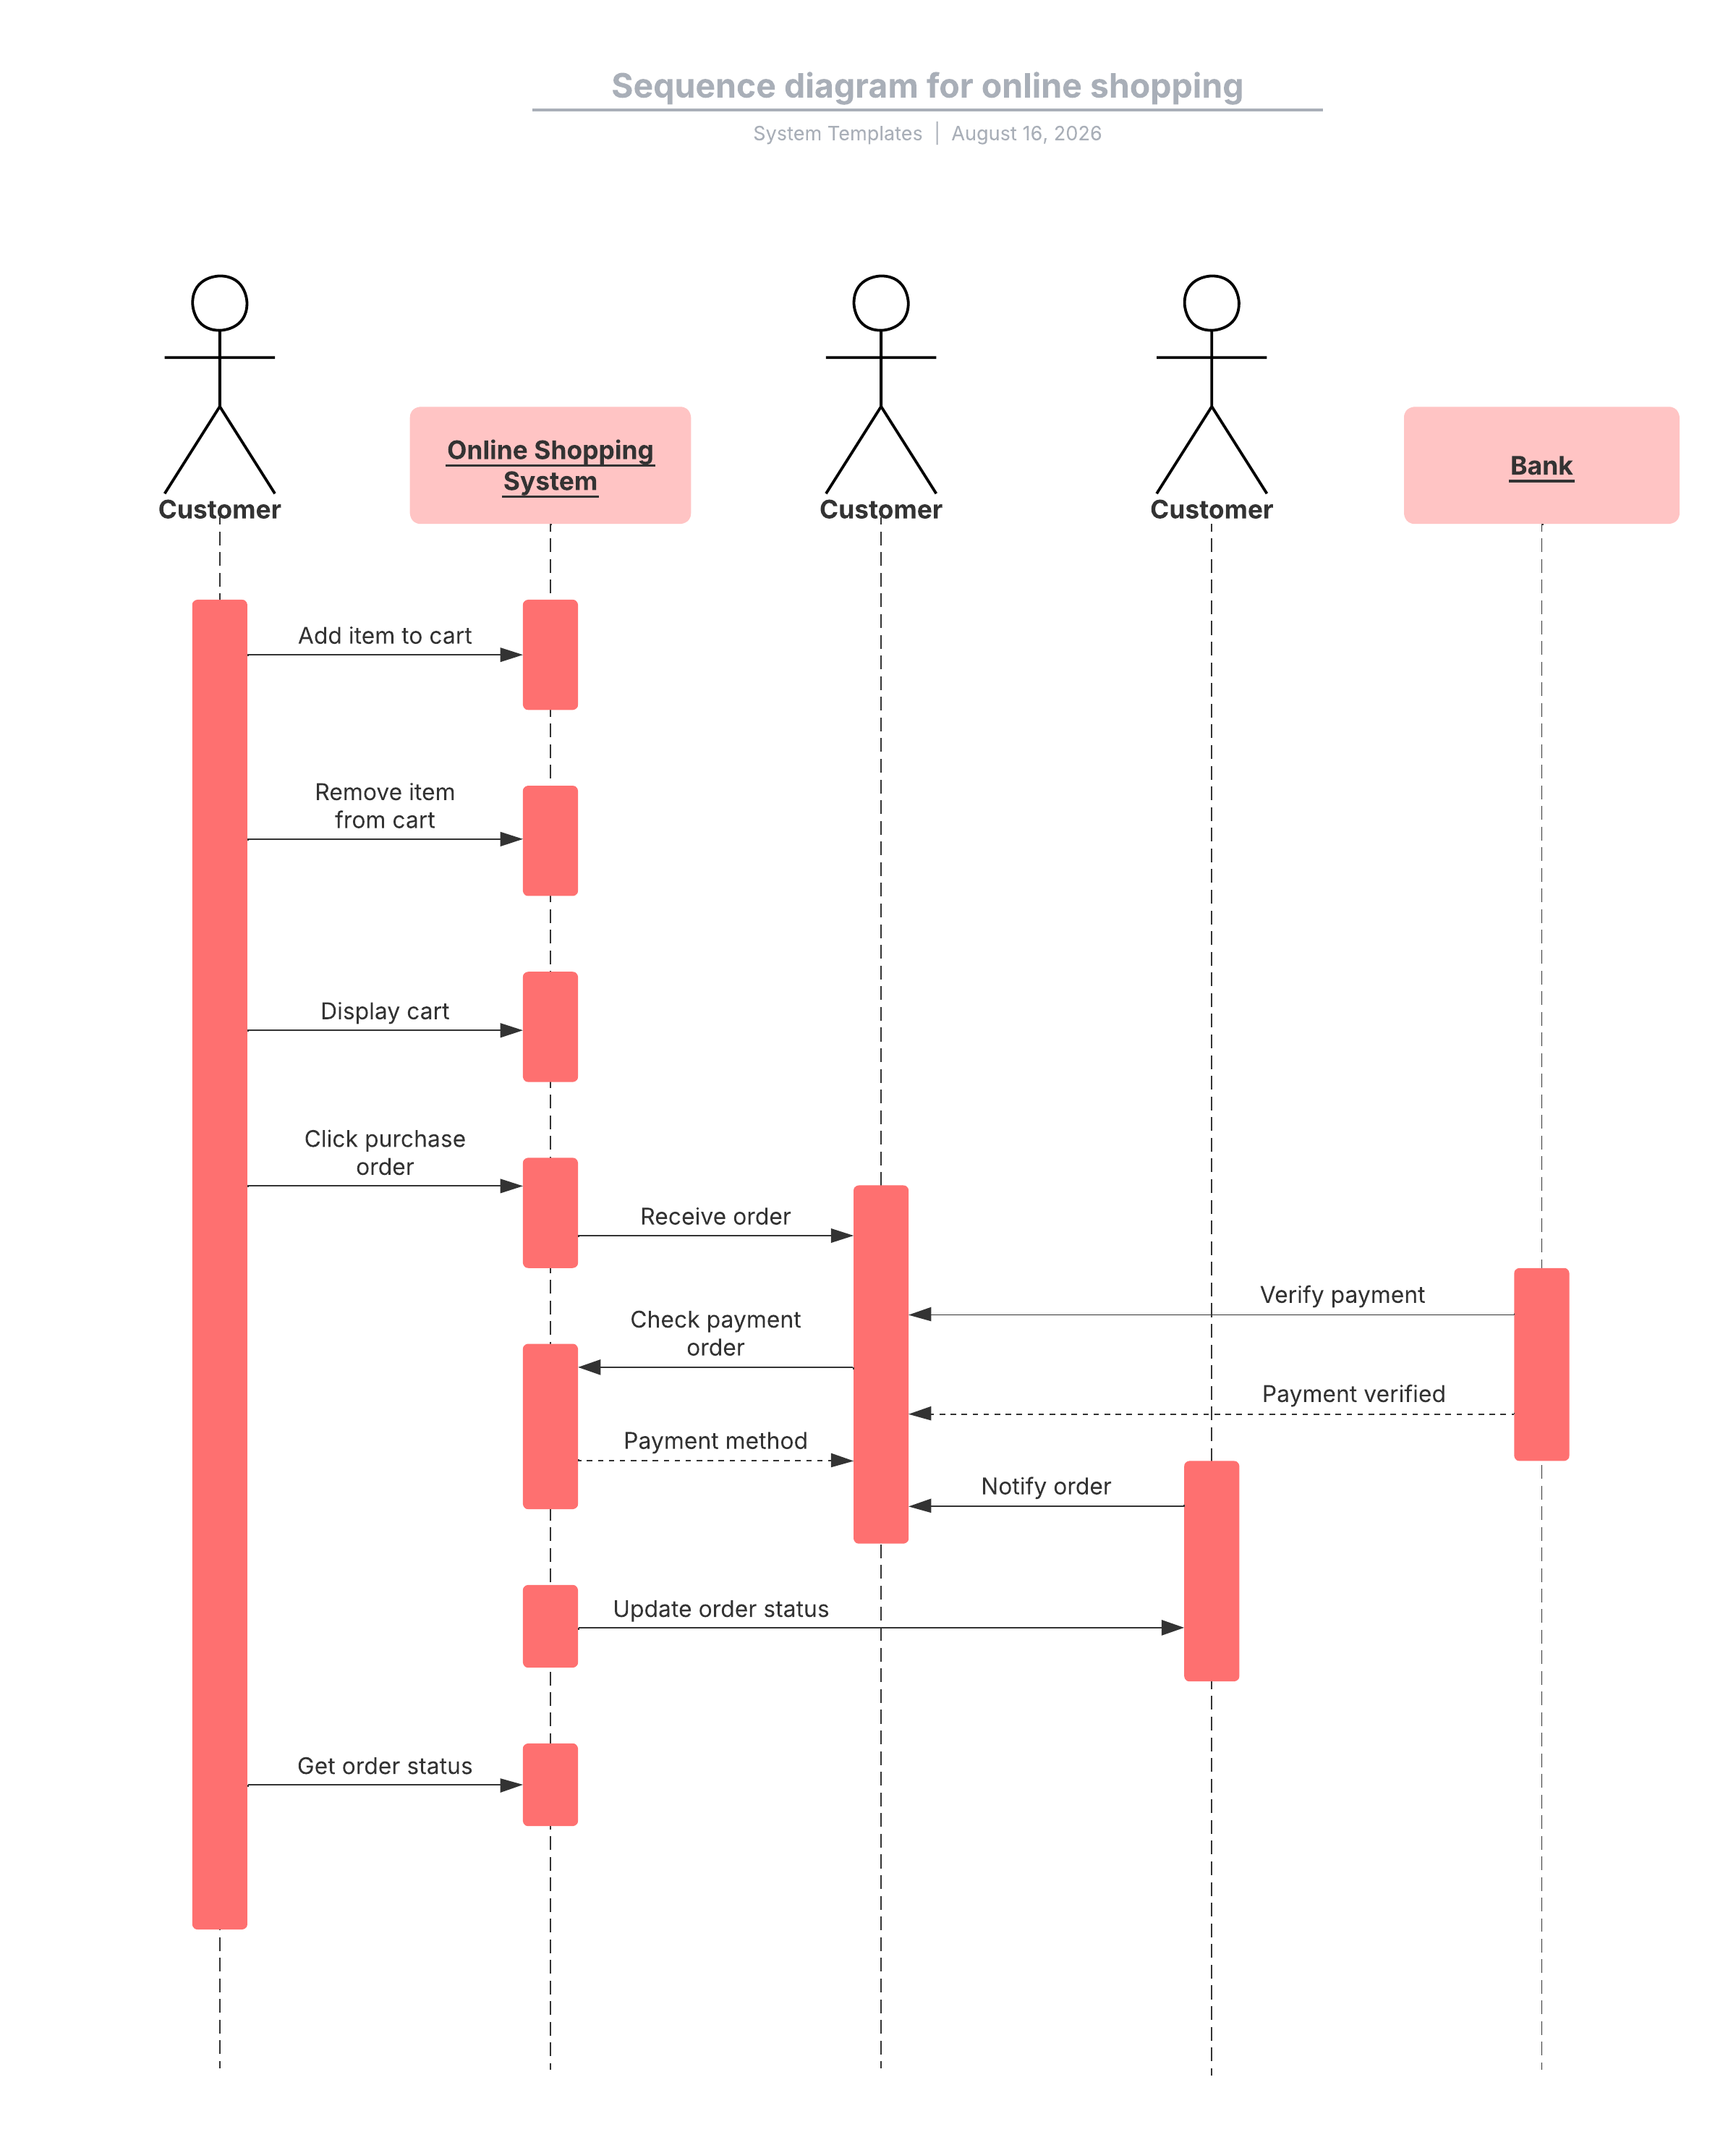
Sequence diagrams can be applied to a variety of situations. Here are just a couple to consider.
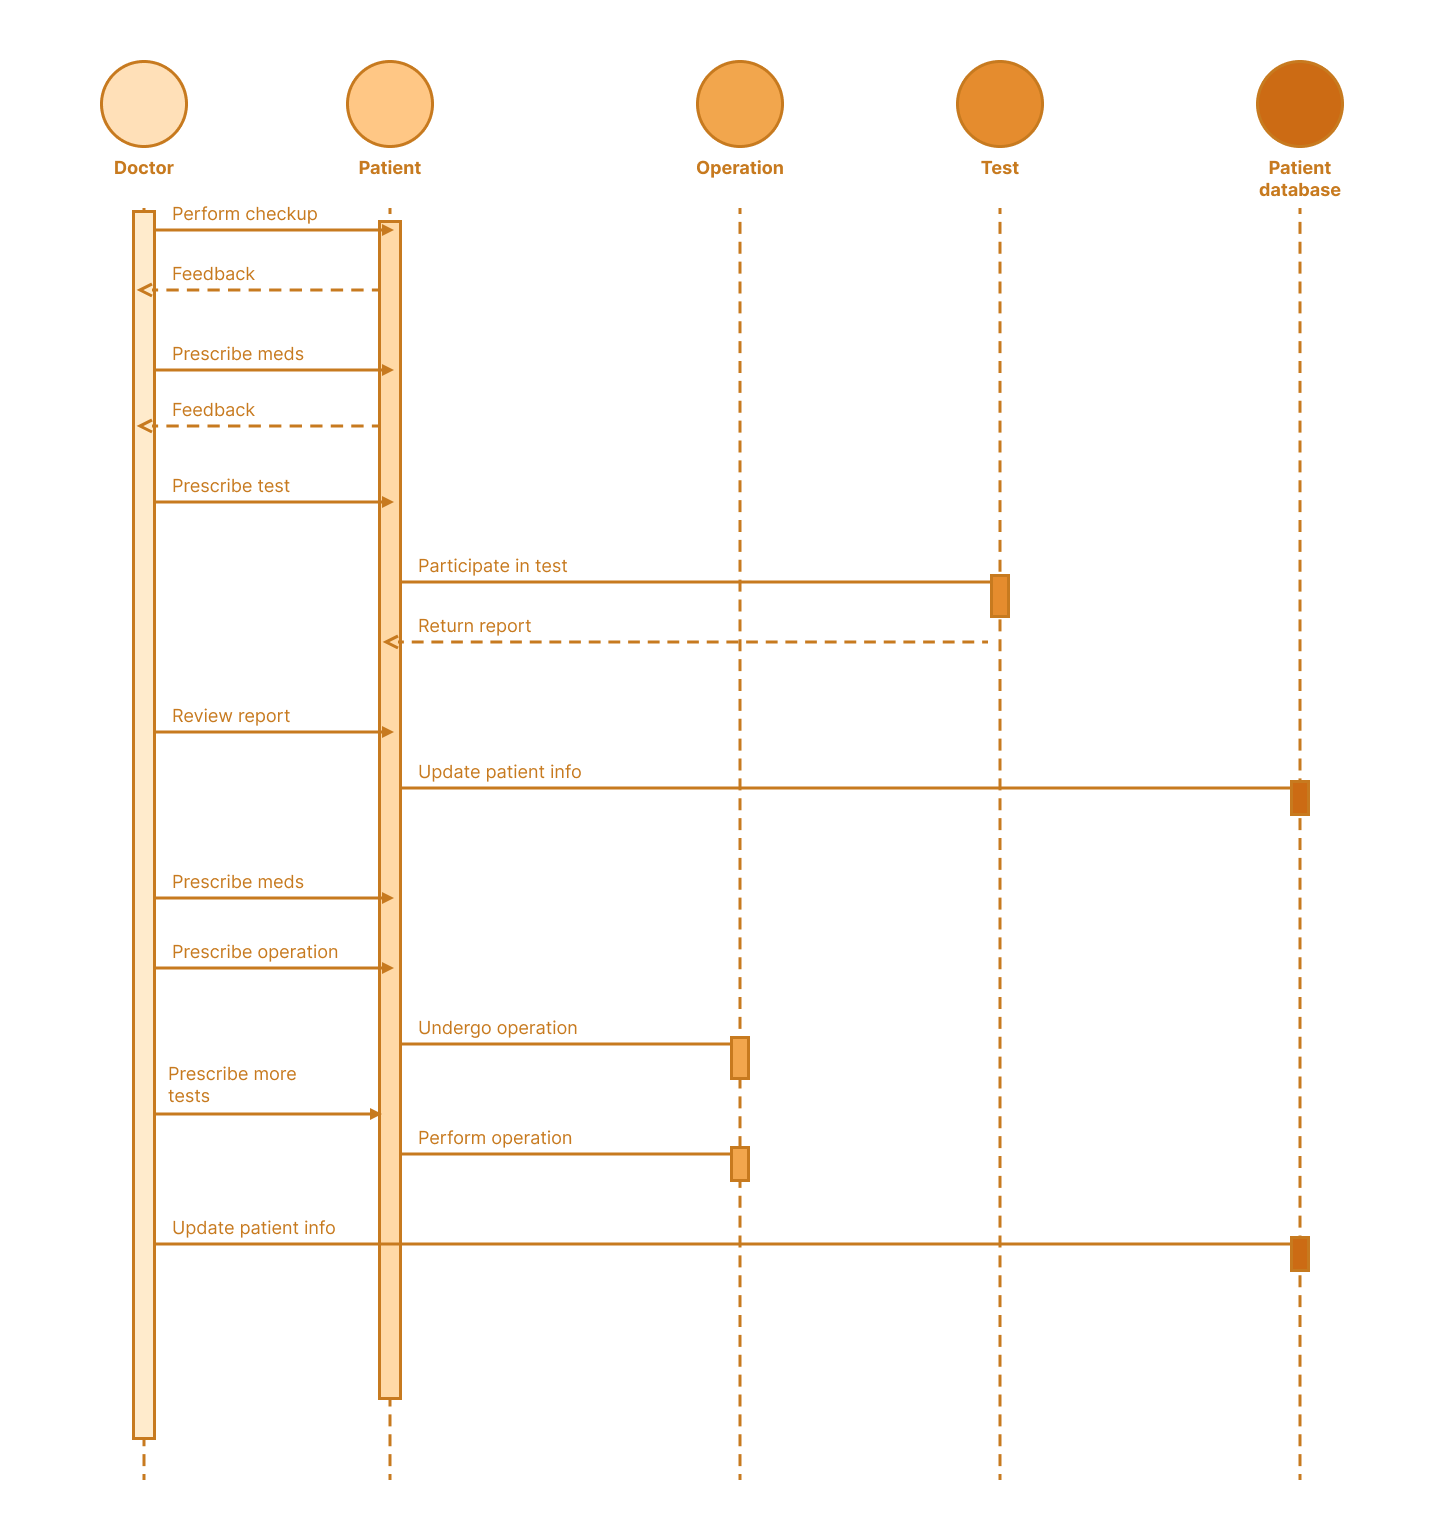
Sequence diagram of a hospital management system
A hospital management system (also called a hospital information system) helps doctors, administrators, and staff manage activities and information collected at a hospital. These activities and information include checkups, prescriptions, appointments, and patient information. A sequence diagram could map how these participants exchange messages to complete each task.
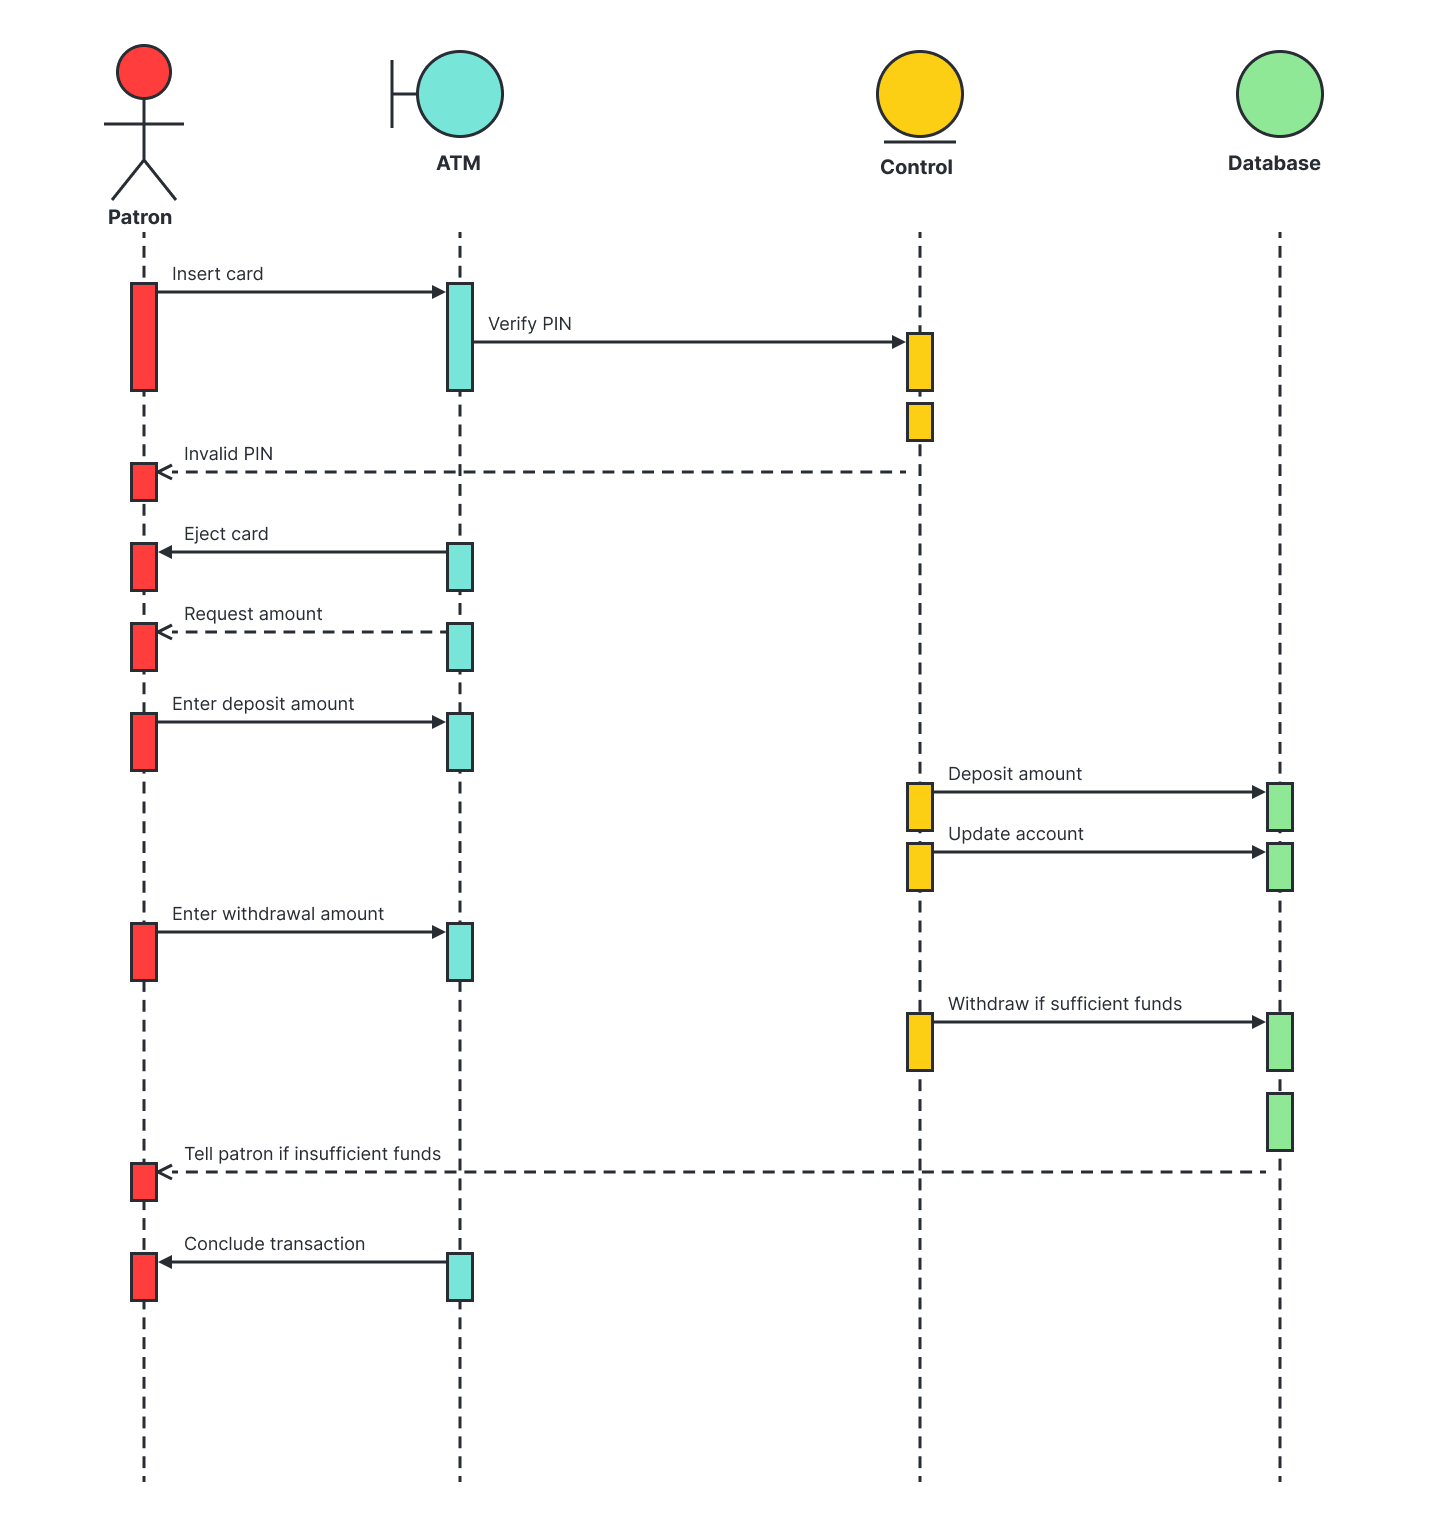
Sequence diagram for ATM systems
An ATM lets patrons access their bank accounts through an automated process. A sequence diagram could outline the sequential order of interactions: inserting a card, entering a PIN, requesting a withdrawal, and receiving cash.
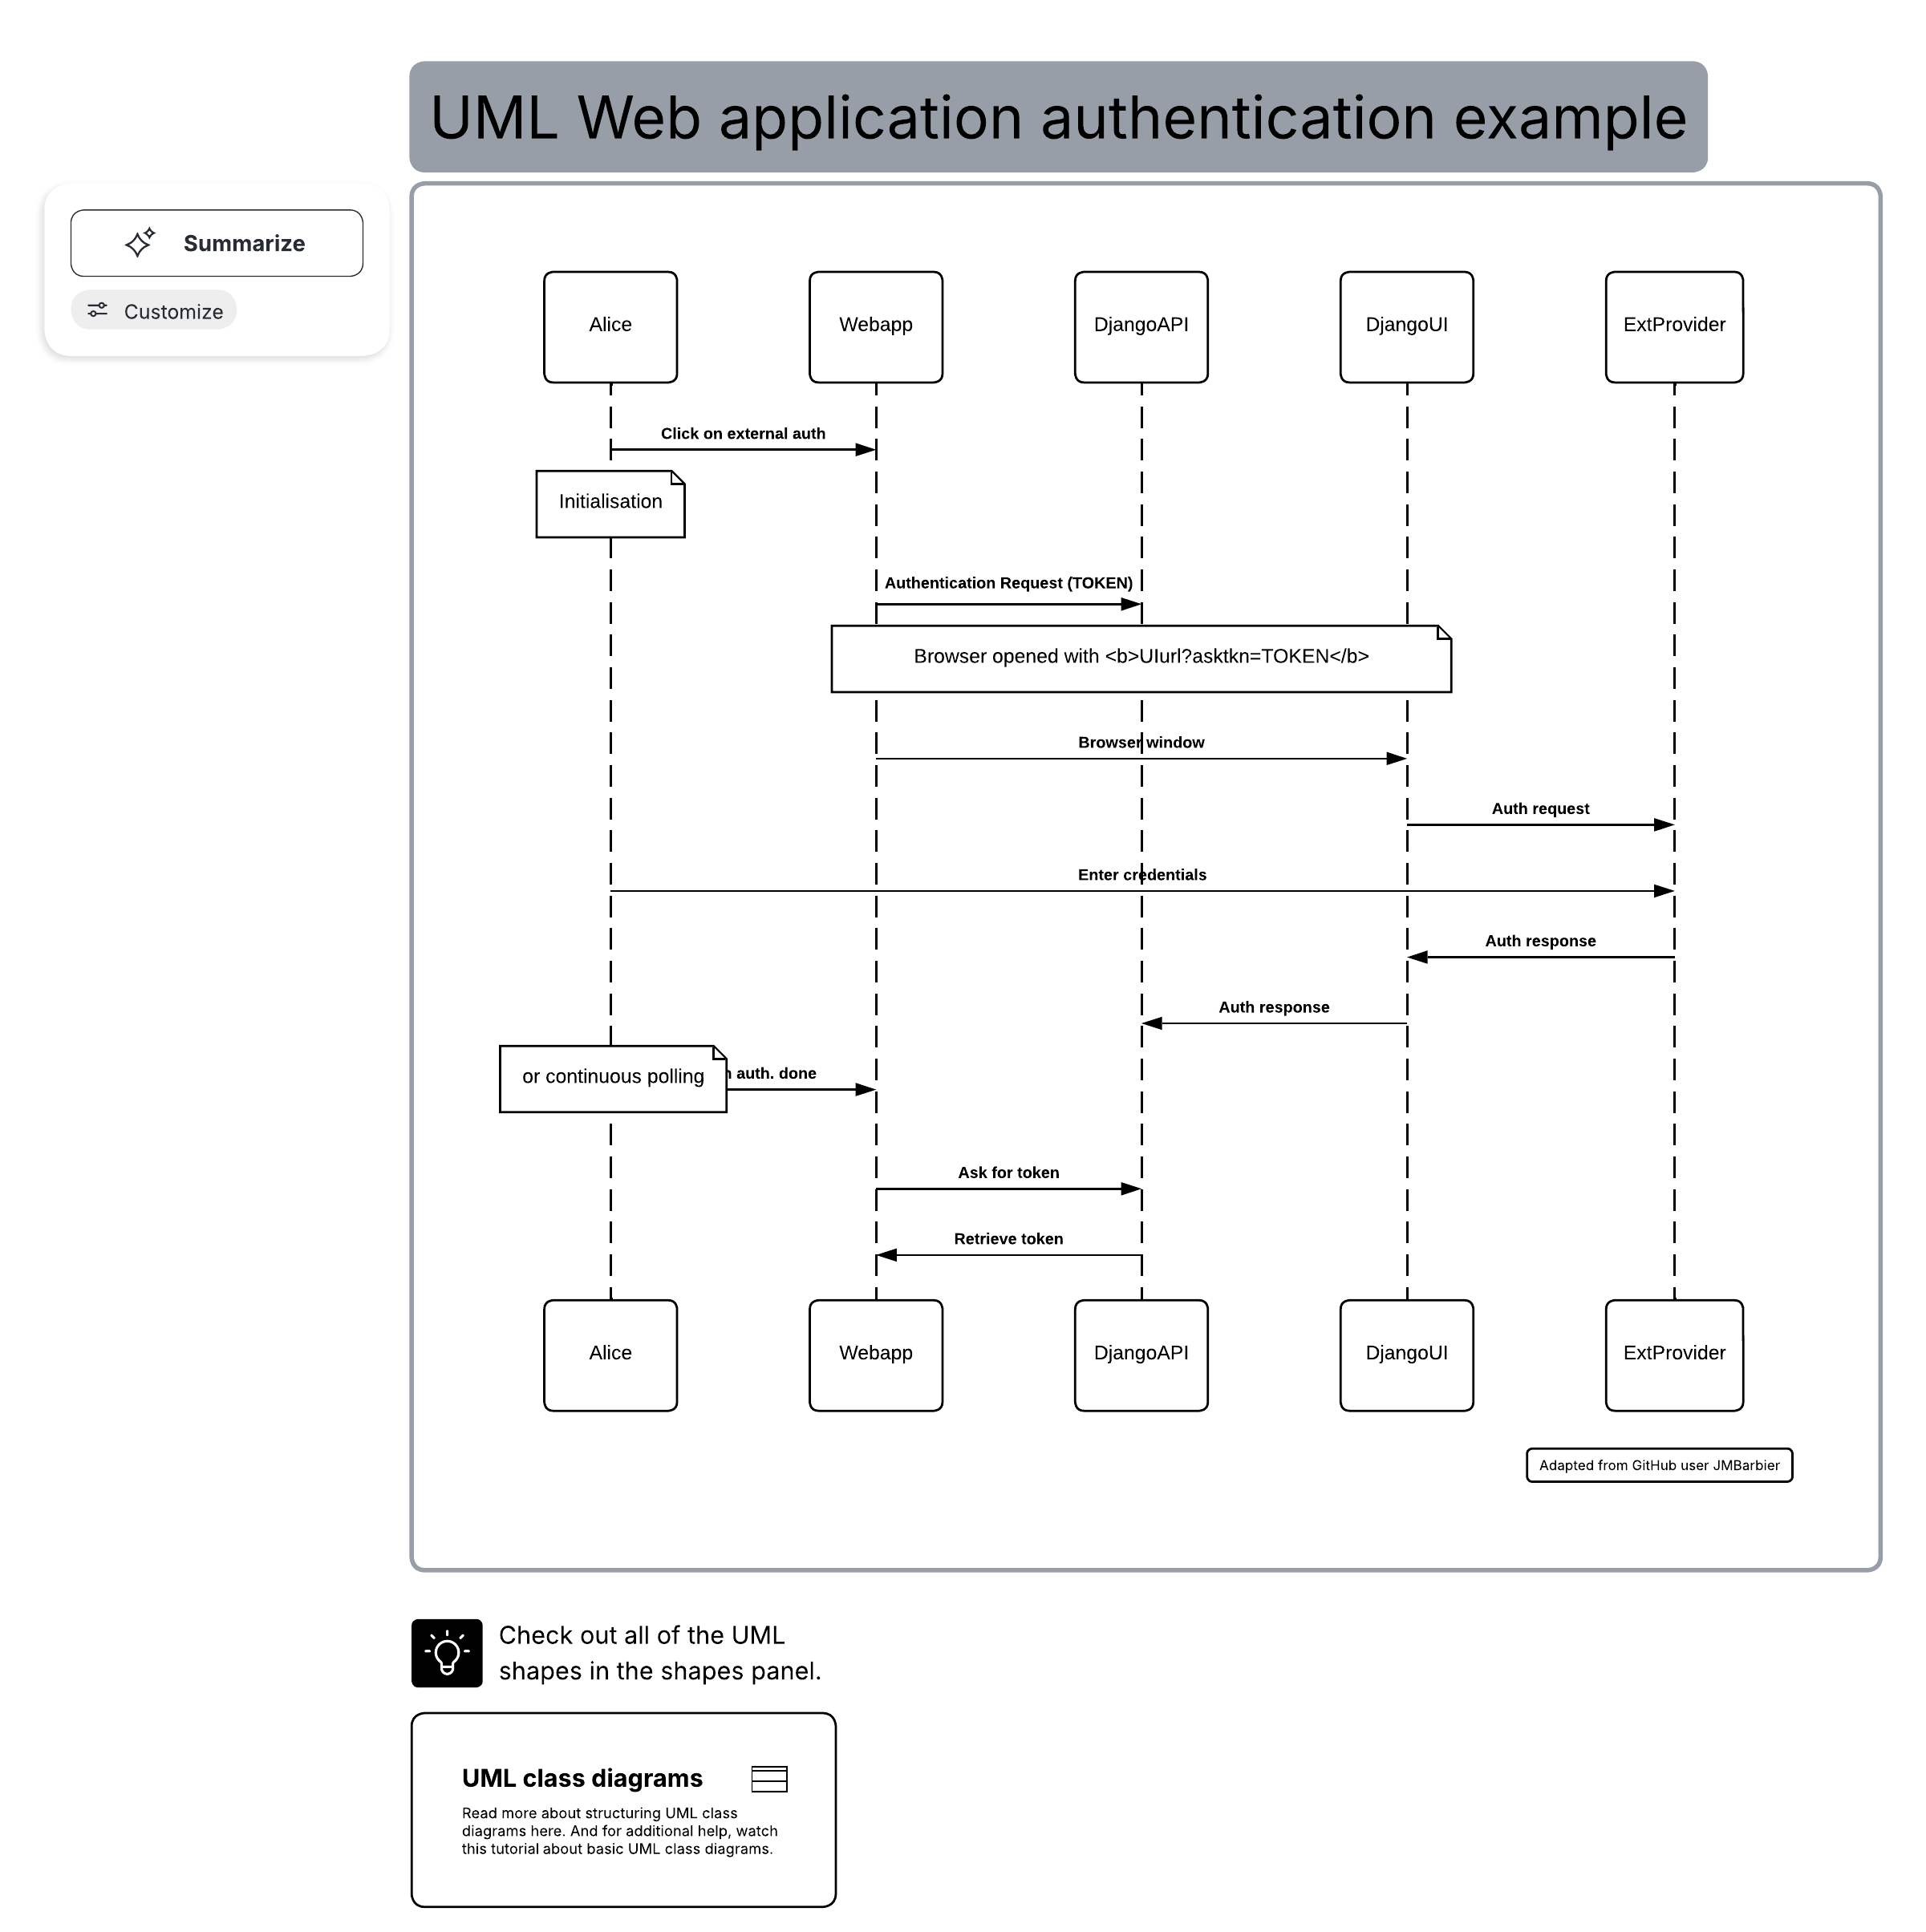
Sequence diagrams can also document web application flows, such as sign-in, password reset, and multi-factor authentication.
How do you make a sequence diagram in Lucidchart?
Lucidchart offers several ways to create UML sequence diagrams faster. Follow these basic steps if you prefer to build your sequence diagram manually, with a template, or by importing existing files.
1. Get started with a new document
Open up your Lucidchart account (or sign up for free if you haven’t already!). Select a template or open a blank document. You can also import existing diagrams from Visio and other platforms to continue existing work.
2. Identify and add components
Consider what information needs to be included in this diagram. Identify the objects (actors) and the messages they exchange. For a login sequence, that might be a visitor or user and a login page. Validate the participant list. Consider who initiates, which systems receive, and what downstream services respond.
3. Open the UML shape library
In Lucidchart, click the search icon and then Shapes. Select UML. You can also import your own icons or Visio stencils.
4. Add shapes and lines
Once the UML shape library has been added, it's easy to add your shapes to the canvas with a simple drag-and-drop action. Add rectangles to the top of the canvas, one for each object, and label each rectangle with the name of the object. If the object is both external and internal to the system, you may choose to use an actor symbol instead of a rectangle.
Represent the flow of time in a sequence by clicking and dragging lines from the object shapes. Dotted lines will instantly appear, symbolizing lifelines. How long you make these lifelines depends on how many messages you must present in the sequence.
5. Add text and concepts
Drag an activation box (a long, thin rectangle) onto a lifeline. Drag a message arrow and label it. Reverse a message's direction from the info icon. Use the delete (X) symbol at the end of a lifeline to show a destroyed object.
6. Format your sequence diagram
Check the logic. Messages should read sequentially from top to bottom. Use themes to keep the diagram consistent.
7. Publish, implement, and share
Using Lucid’s sequence diagram maker, you can share or publish the diagram, set collaborative permissions, or embed it in your company wiki. Download it in any format, including Visio. You can also publish to Google Workspace or add diagrams to Microsoft Word, Excel, and PowerPoint through free add-ons.
Options for diagramming faster
If you’re interested in saving time, you can generate a UML sequence diagram in Lucidchart using markup.
To use sequence markup:
Click the search icon, and select Tools > UML Markup.
Type your markup in the left-hand box that pops up.
Click Build to generate the diagram.
You can also save time by generating a sequence diagram using Lucid AI. Select the Lucid AI icon on the left side of the canvas, type a detailed description of the diagram you want, and press "Enter.” Lucid AI will generate an editable diagram in seconds.
How to make a UML sequence diagram video
This tutorial shows how to create a UML sequence diagram in Lucidchart, using an ATM cash withdrawal interaction as an example. It covers the five core elements: actors, objects, lifelines, messages, and activation boxes.
Ready to get started? Try out Lucidchart to create UML sequence diagrams and design your systems more effectively.