A timing diagram is a specific behavioral modeling diagram that focuses on timing constraints. If you need to know how objects interact with each other during a certain period of time, create a timing diagram with our UML diagramming software and refer to this guide if you need additional insight along the way.
What is a timing diagram?
Think of a timing diagram as an inverted sequence diagram. In a timing diagram, time passes on the x-axis from left to right, with different components of the system that interact with each other on the y-axis. Timing diagrams show how long each step of a process takes. Use them to identify which steps of a process require too much time and to find areas for improvement.
Lucidchart makes the process of creating your timing diagram incredibly easy with its UML software, opens in a new tab. In fact, you can create any UML diagram in Lucidchart, including sequence diagrams, activity diagrams, opens in a new tab, and class diagrams, opens in a new tab. Sign up for a free Lucidchart account today to begin diagramming!
Timing diagram components
With timing diagrams, you can easily diagram a process and identify the major steps it takes to complete the process. First, identify the major participants in the process. If you were to create a timing diagram for a factory, you would identify departments such as design, sourcing, manufacturing, QA, shipping, etc.
Then, follow the process closely, charting the time each product spends with each department. The end result should help factory administration to recognize which departments are understaffed, inefficient, or overloaded.
Timing diagram examples
Boat manufacturing timing diagram example
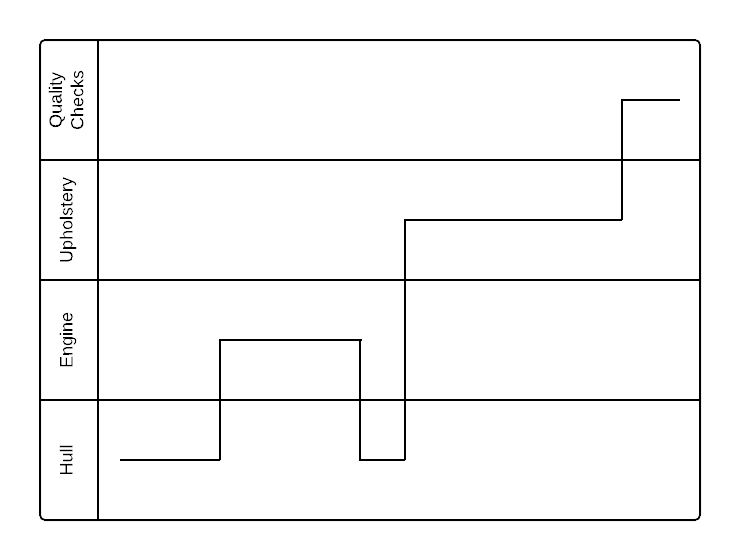
In this simplified example of a boat manufacturing plant, a timing diagram shows that too much time is spent on the upholstery stages of production. As a result, factory administrators may assign more employees to the upholstery stations or seek out ways to increase efficiency. If administrators can effectively use a timing diagram to increase efficiency, the process can be significantly improved, decreasing both time and money spent on the process.
Water cycle timing diagram example
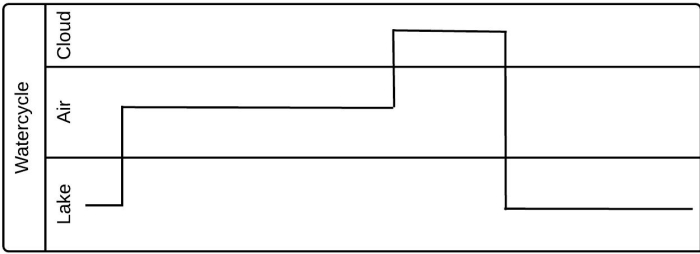
This timing diagram example shows a simplified version of the water cycle. Since the timing diagram focuses on how long each step takes, not on the system itself, you could think of this as a diagram of the different phases that a water droplet cycles through. If this were a manufacturing process, viewers could easily identify areas for improvement. Timing diagrams are powerful tools for making a system as efficient as possible.
How to create a timing diagram
To put together your timing diagram, you will need to understand the UML basics. Try reviewing our timing diagram overview, opens in a new tab, along with this tutorial on Unified Modeling Language, opens in a new tab. Once you have a solid understanding of UML, you can start your timing diagram in Lucidchart.
1. Get started with Lucidchart
Creating UML diagrams in Lucidchart is free and easy. Simply register for a free Lucidchart account if you haven’t already. Log in and open a new document. You can also browse through our UML template library and start with one of our examples.
Lucidchart is also equipped with a feature that imports documents from Visio, opens in a new tab, Gliffy, and other diagramming platforms.
2. Identify components
To create an accurate timing diagram, it is important to recognize all of the stages in a given process. Participants in a timing diagram can be large entities, such as completely different departments, or small entities, such as workstations in a specific part of a complex process.
3. Add shapes
The first shapes that you should add to your timing diagram are the horizontal containers. Enable the Containers shape library, and then drag one horizontal container onto the canvas to represent the first participant in the process. Use the top menu to increase the number of containers (commonly called “swimlanes”), creating a container for each of the previously identified participants in the process.
Let’s say that you want to create a timing diagram that represents the manufacturing process of a boat. After you identify the main stages in the process (hull, engine, upholstery, and quality checks), add a horizontal lane for each stage.
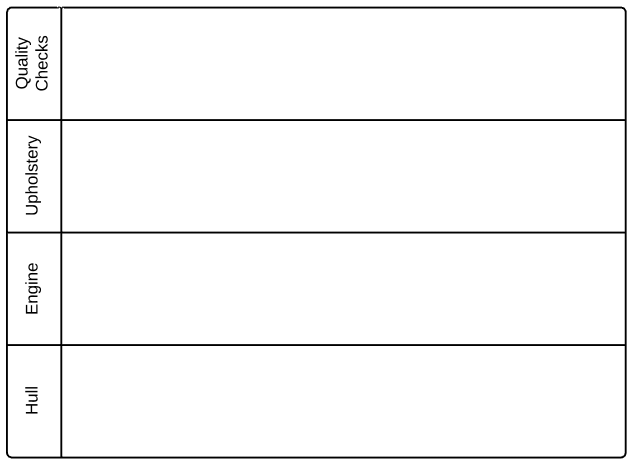
Now that you have set up the structure of the process, add lines that represent the time spent in each stage of the process. Drag a line from the shape libraries to the left, and fit it to the appropriate lane. The horizontal axis represents time, so any horizontal lines will represent the time that the specific process takes. The vertical axis, on the other hand, shows when a process changes hands from one participant to the next.
Following up with our previous example, the timing diagram was completed by adding lines that reflect the time spent in each stage of the process.
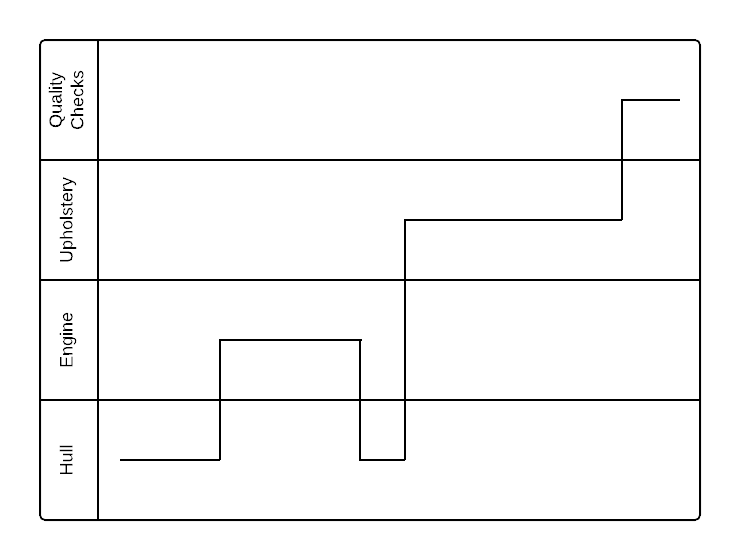
Once you complete your timing diagram, take time to review the diagram to search for areas for potential improvement. In the case of our boat manufacturing example, the upholstery stage looks like it takes far too long, so administrators should increase the efficiency of the upholstery process to decrease the overall time it takes to manufacture one boat.
4. Publish, implement, and share
When you finish your timing diagram, you can easily share it with others. Just click the orange “Share” button at the top-right corner of the Lucidchart editor. Go to advanced options to share your diagram on social media or create a link for both Lucidchart users and non-users to view the document.
You can also embed your diagrams into your favorite apps, including G Suite, Microsoft Office, Confluence, Jira, and Slack, using our Lucidchart integrations, opens in a new tab.
Lucidchart will also allow you to export your timing diagram into a variety of file types, including PDF, PNG, JPEG, and Visio (VDX). To download the diagram, click File > Download As and choose your preferred file type.
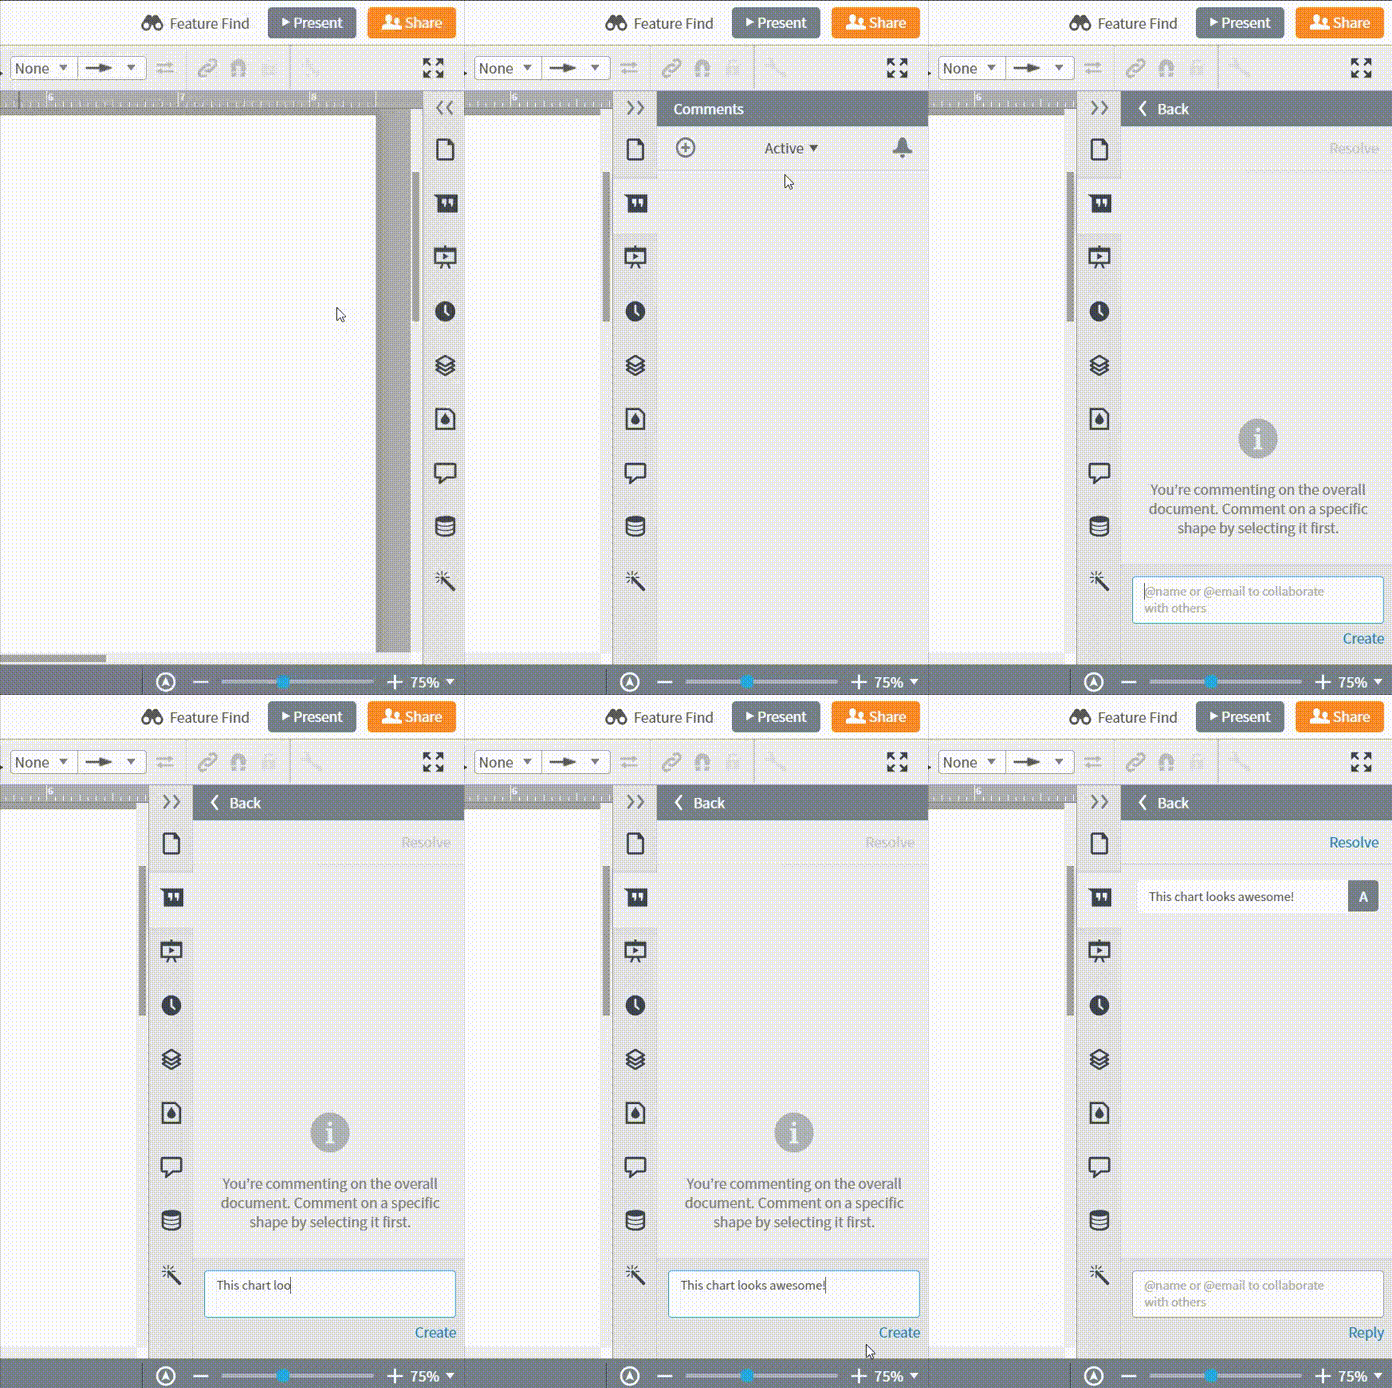
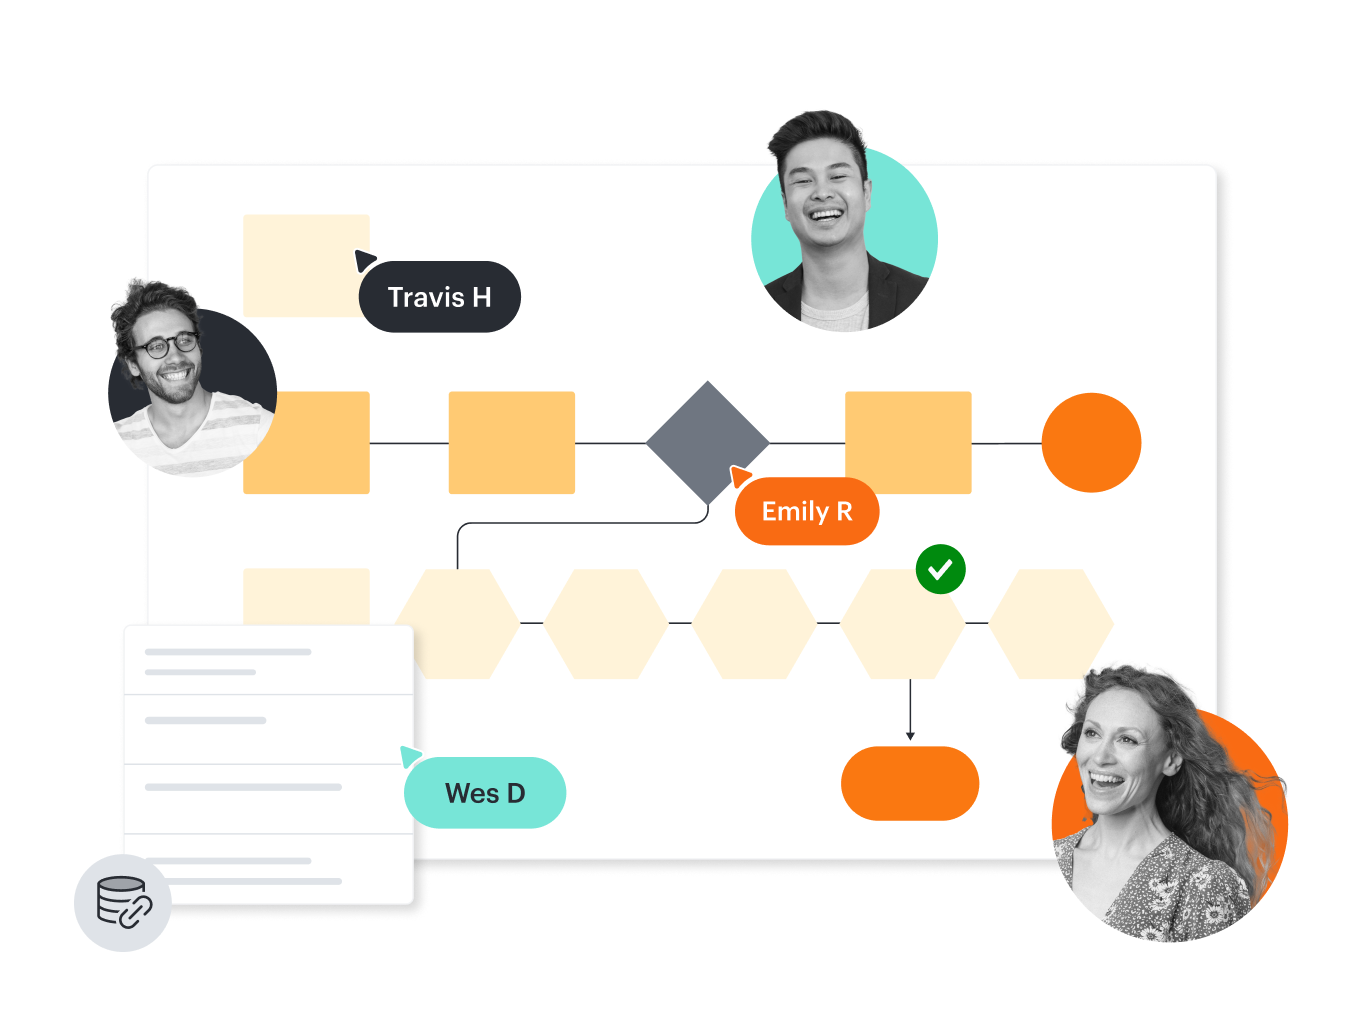
If you’re collaborating on a timing diagram in UML, you have the option to leave comments and see changes in real time with every revision logged for reference so each collaborator sees the most up-to-date version of the diagram.