Creating Venn diagrams is super simple and easy with our Venn diagram maker. Learn the essentials of Venn diagrams, along with their long history, versatile purposes and uses, examples and symbols, and steps to draw them.
What is a Venn diagram?
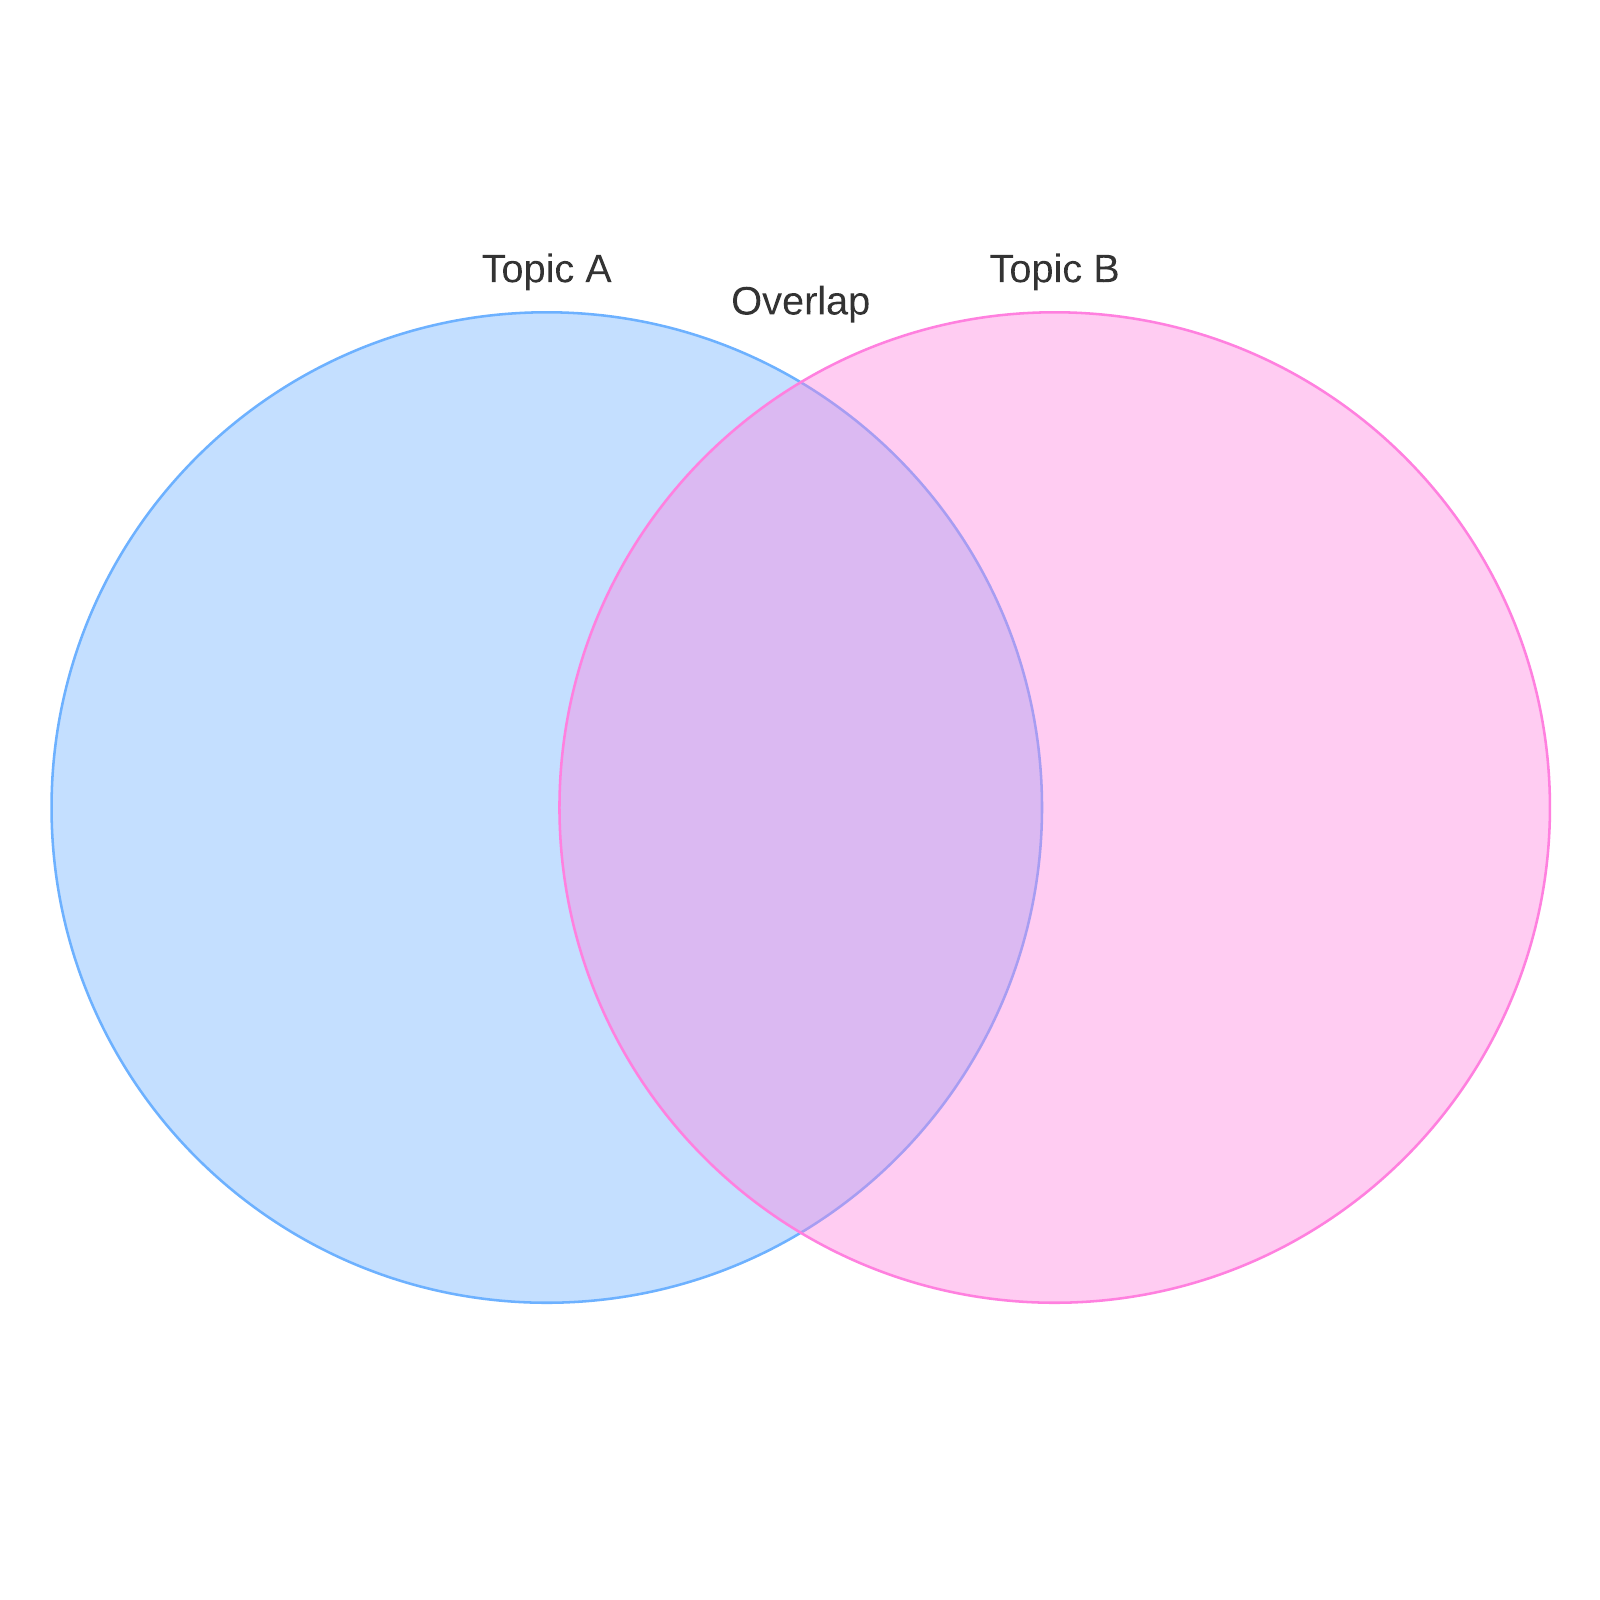
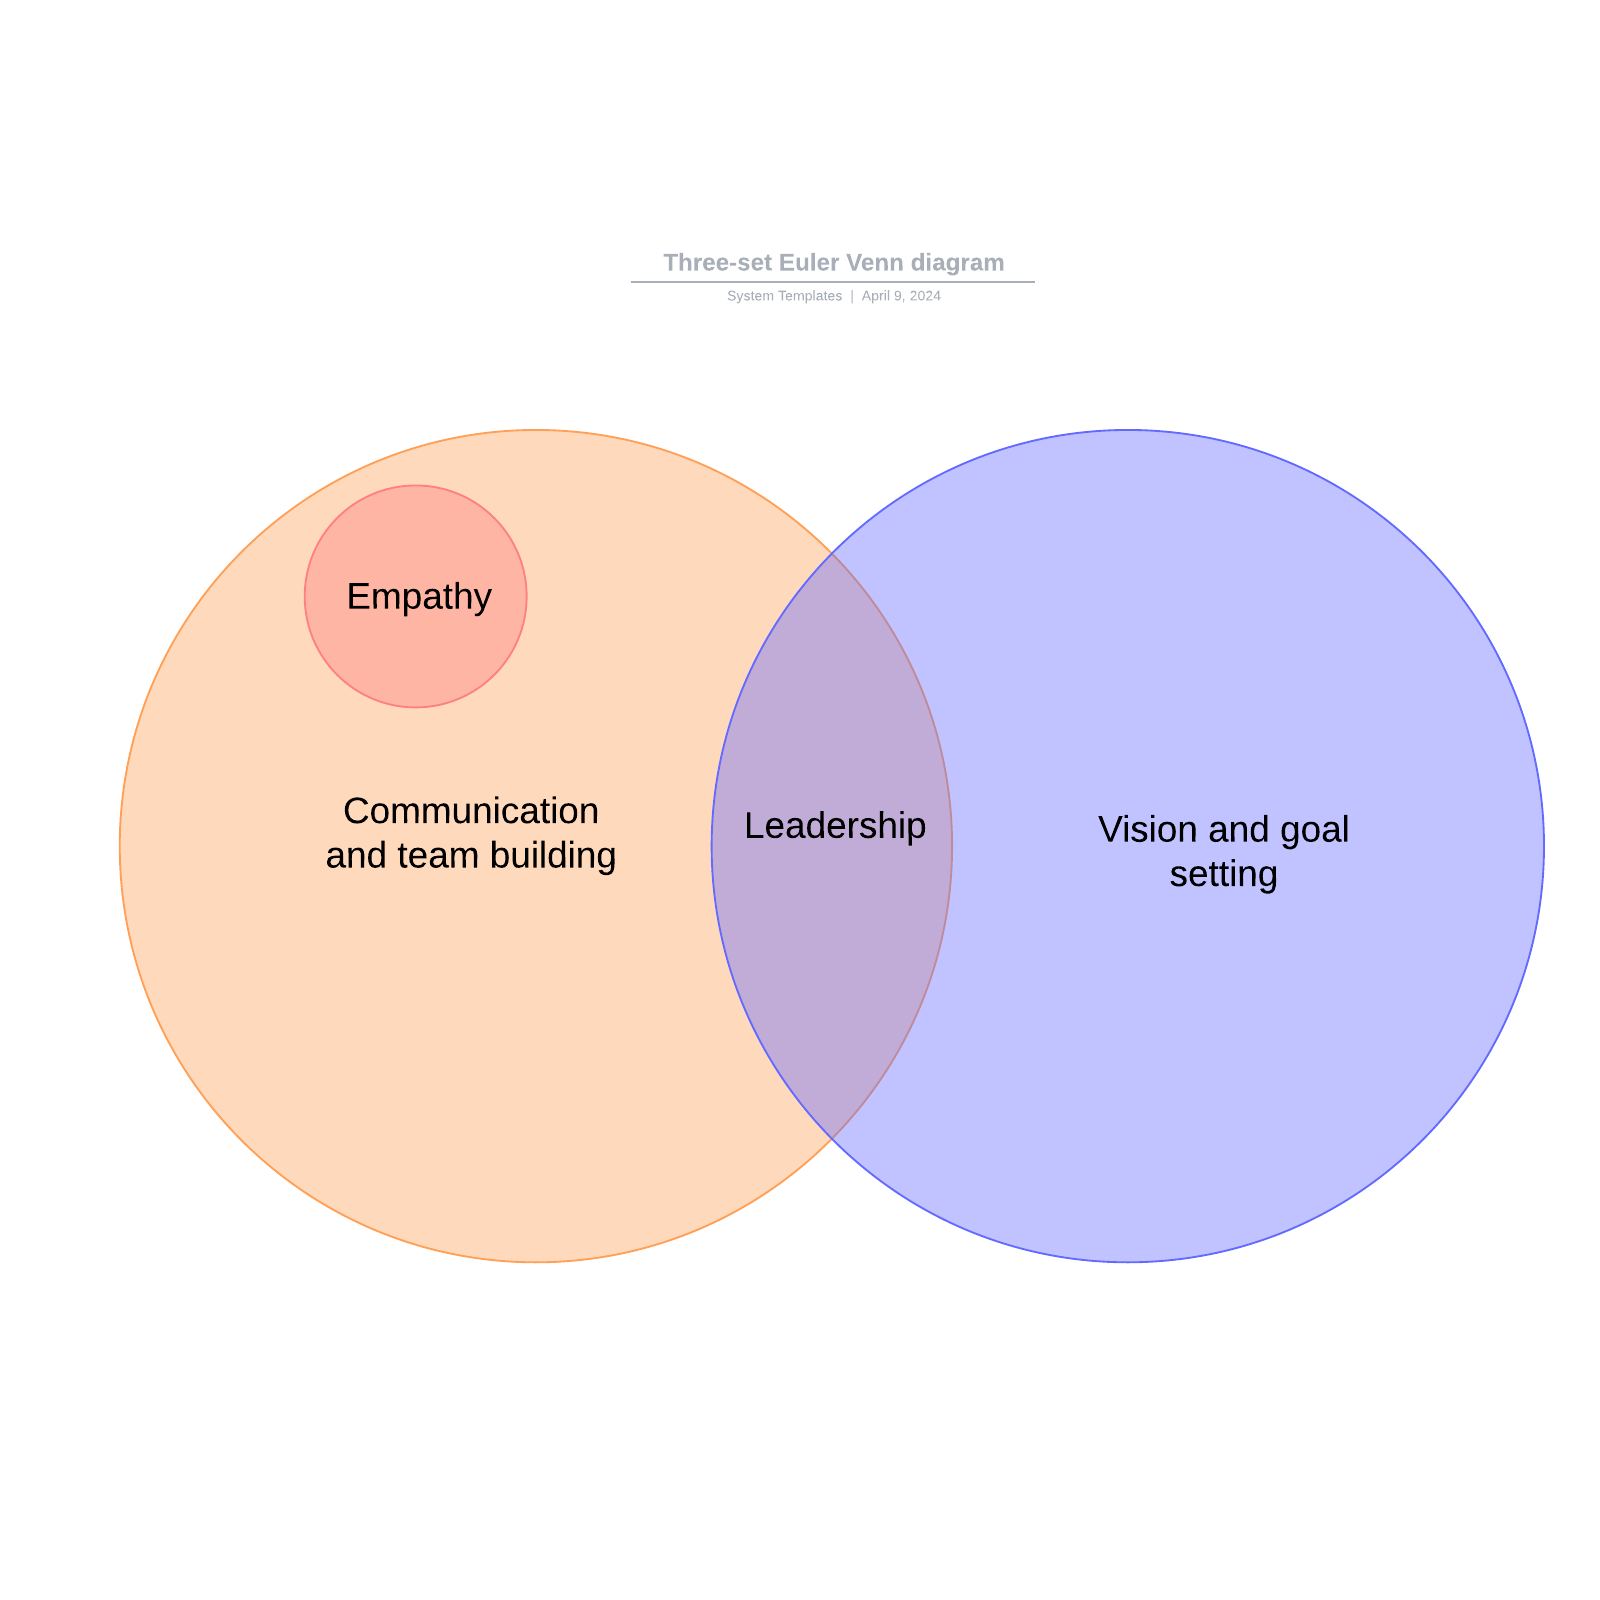
A Venn diagram uses overlapping circles or other shapes to illustrate the logical relationships between two or more sets of items. Often, they serve to graphically organize things, highlighting how the items are similar and different.
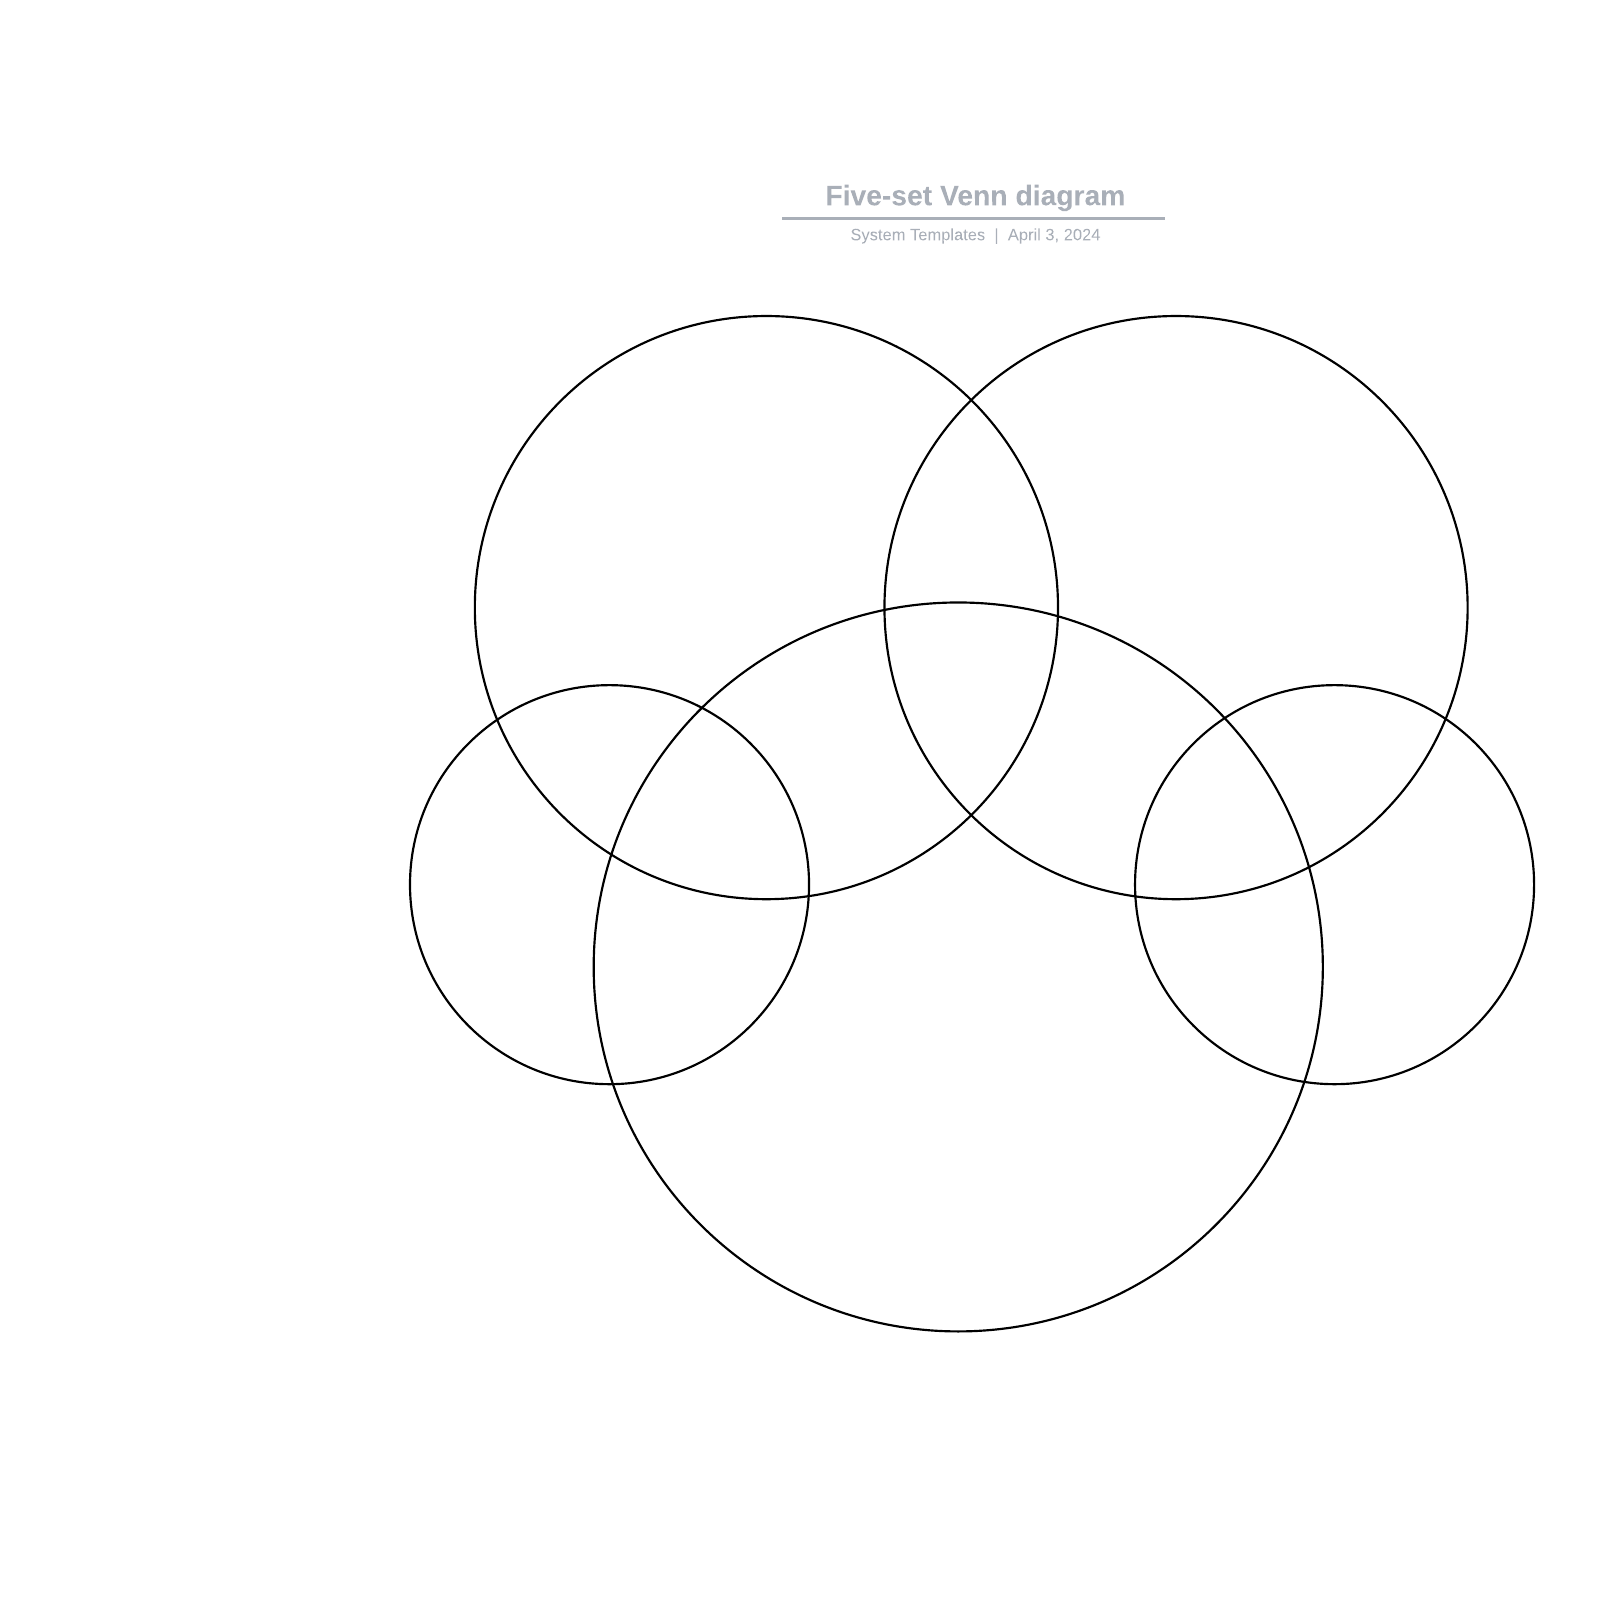
Venn diagrams, also called Set diagrams or Logic diagrams, are widely used in mathematics, statistics, logic, teaching, linguistics, computer science and business. Many people first encounter them in school as they study math or logic, since Venn diagrams became part of “new math” curricula in the 1960s. These may be simple diagrams involving two or three sets of a few elements, or they may become quite sophisticated, including 3D presentations, as they progress to six or seven sets and beyond. They are used to think through and depict how items relate to each within a particular “universe” or segment. Venn diagrams allow users to visualize data in clear, powerful ways, and therefore are commonly used in presentations and reports. They are closely related to Euler diagrams, which differ by omitting sets if no items exist in them. Venn diagrams show relationships even if a set is empty.


Master the basics of Lucidchart in 3 minutes
- Create your first diagram from a template or blank canvas or import a document.
- Add text, shapes, and lines to customize your diagram.
- Learn how to adjust styling and formatting.
- Locate what you need with Feature Find.
- Share your diagram with your team to start collaborating.
Master the basics of Lucidchart in 3 minutes
Venn diagram use cases
-
Math: Venn diagrams are commonly used in school to teach basic math concepts such as sets, unions and intersections. They’re also used in advanced mathematics to solve complex problems and have been written about extensively in scholarly journals. Set theory is an entire branch of mathematics.
-
Statistics and probability: Statistics experts use Venn diagrams to predict the likelihood of certain occurrences. This ties in with the field of predictive analytics. Different data sets can be compared to find degrees of commonality and differences.
-
Logic: Venn diagrams are used to determine the validity of particular arguments and conclusions. In deductive reasoning, if the premises are true and the argument form is correct, then the conclusion must be true. For example, if all dogs are animals, and our pet Mojo is a dog, then Mojo has to be an animal. If we assign variables, then let’s say dogs are C, animals are A, and Mojo is B. In argument form, we say: All C are A. B is C. Therefore B is A. A related diagram in logic is called a Truth Table, which places the variables into columns to determine what is logically valid. Another related diagram is called the Randolph diagram, or R-Diagram, after mathematician John F. Randolph. It uses lines to define sets.
-
Linguistics: Venn diagrams have been used to study the commonalities and differences among languages.
-
Teaching reading comprehension: Teachers can use Venn diagrams to improve their students’ reading comprehension. Students can draw diagrams to compare and contrast ideas they are reading about.
-
Computer science: Programmers can use Venn diagrams to visualize computer languages and hierarchies.
-
Business: Venn diagrams can be used to compare and contrast products, services, processes or pretty much anything that can depicted in sets. And they’re an effective communication tool to illustrate that comparison.
On a lighter note: Venn diagrams hit the small screen
Not many diagrams have crossed over into popular culture, but the esteemed Venn diagram has.
-
Drama: In the CBS TV show NUMB3RS, produced from 2005 to 2010, math genius Charles Eppes uses a Venn diagram to determine which suspects match a description and have a history of violence.
-
Comedy: On NBC’s Late Night with Seth Meyers, the comedian has a recurring routine called “Venn Diagrams,” comparing two seemingly unrelated items to find their funny commonality (he hopes.)
Steps to draw and use a basic Venn diagram
-
Determine your goal. What are you comparing, and why? This will help you to define your sets.
-
Brainstorm and list the items in your sets, either on paper or with a platform like Lucidchart.
-
Now, use your diagram to compare and contrast the sets. You may see things in new ways and be able to make observations, choices, arguments or decisions.
Venn diagram history
Venn diagrams are named after British logician John Venn. He wrote about them in an 1880 paper entitled “On the Diagrammatic and Mechanical Representation of Propositions and Reasonings” in the Philosophical Magazine and Journal of Science.
But the roots of this type of diagram go back much further, at least 600 years. In the 1200s, philosopher and logician Ramon Llull (sometimes spelled Lull) of Majorca used a similar type of diagram, wrote author M.E. Baron in a 1969 article tracing their history. She also credited German mathematician and philosopher Gottfried Wilhelm von Leibnitz with drawing similar diagrams in the late 1600s.
In the 1700s, Swiss mathematician Leonard Euler (pronounced Oy-ler) invented what came to be known as the Euler Diagram, the most direct forerunner of the Venn Diagram. In fact, John Venn referred to his own diagrams as Eulerian Circles, not Venn Diagrams. The term Venn Diagrams was first published by American philosopher Clarence Irving (C.I.) Lewis in his 1918 book, A Survey of Symbolic Logic.
Venn Diagrams continued to evolve over the past 60 years with advances by experts David W. Henderson, Peter Hamburger, Jerrold Griggs, Charles E. “Chip” Killian and Carla D. Savage. Their work concerned symmetric Venn Diagrams and their relationship to prime numbers, or numbers indivisible by other numbers except 1 and the number itself. One such symmetric diagram, based on prime number 7, is widely known in math circles as Victoria.
Other notable names in the development of Venn Diagrams are A.W.F. Edwards, Branko Grunbaum and Henry John Stephen Smith. Among other things, they changed the shapes in the diagrams to allow simpler depiction of Venn Diagrams at increasing numbers of sets.
Venn diagram purpose and benefits
-
To visually organize information to see the relationship between sets of items, such as commonalities and differences. Students and professionals can use them to think through the logic behind a concept and to depict the relationships for visual communication. This purpose can range from elementary to highly advanced.
-
To compare two or more choices and clearly see what they have in common versus what might distinguish them. This might be done for selecting an important product or service to buy.
-
To solve complex mathematical problems. Assuming you’re a mathematician, of course.
-
To compare data sets, find correlations and predict probabilities of certain occurrences.
-
To reason through the logic behind statements or equations, such as the Boolean logic behind a word search involving “or” and “and” statements and how they’re grouped.
Example Venn diagram
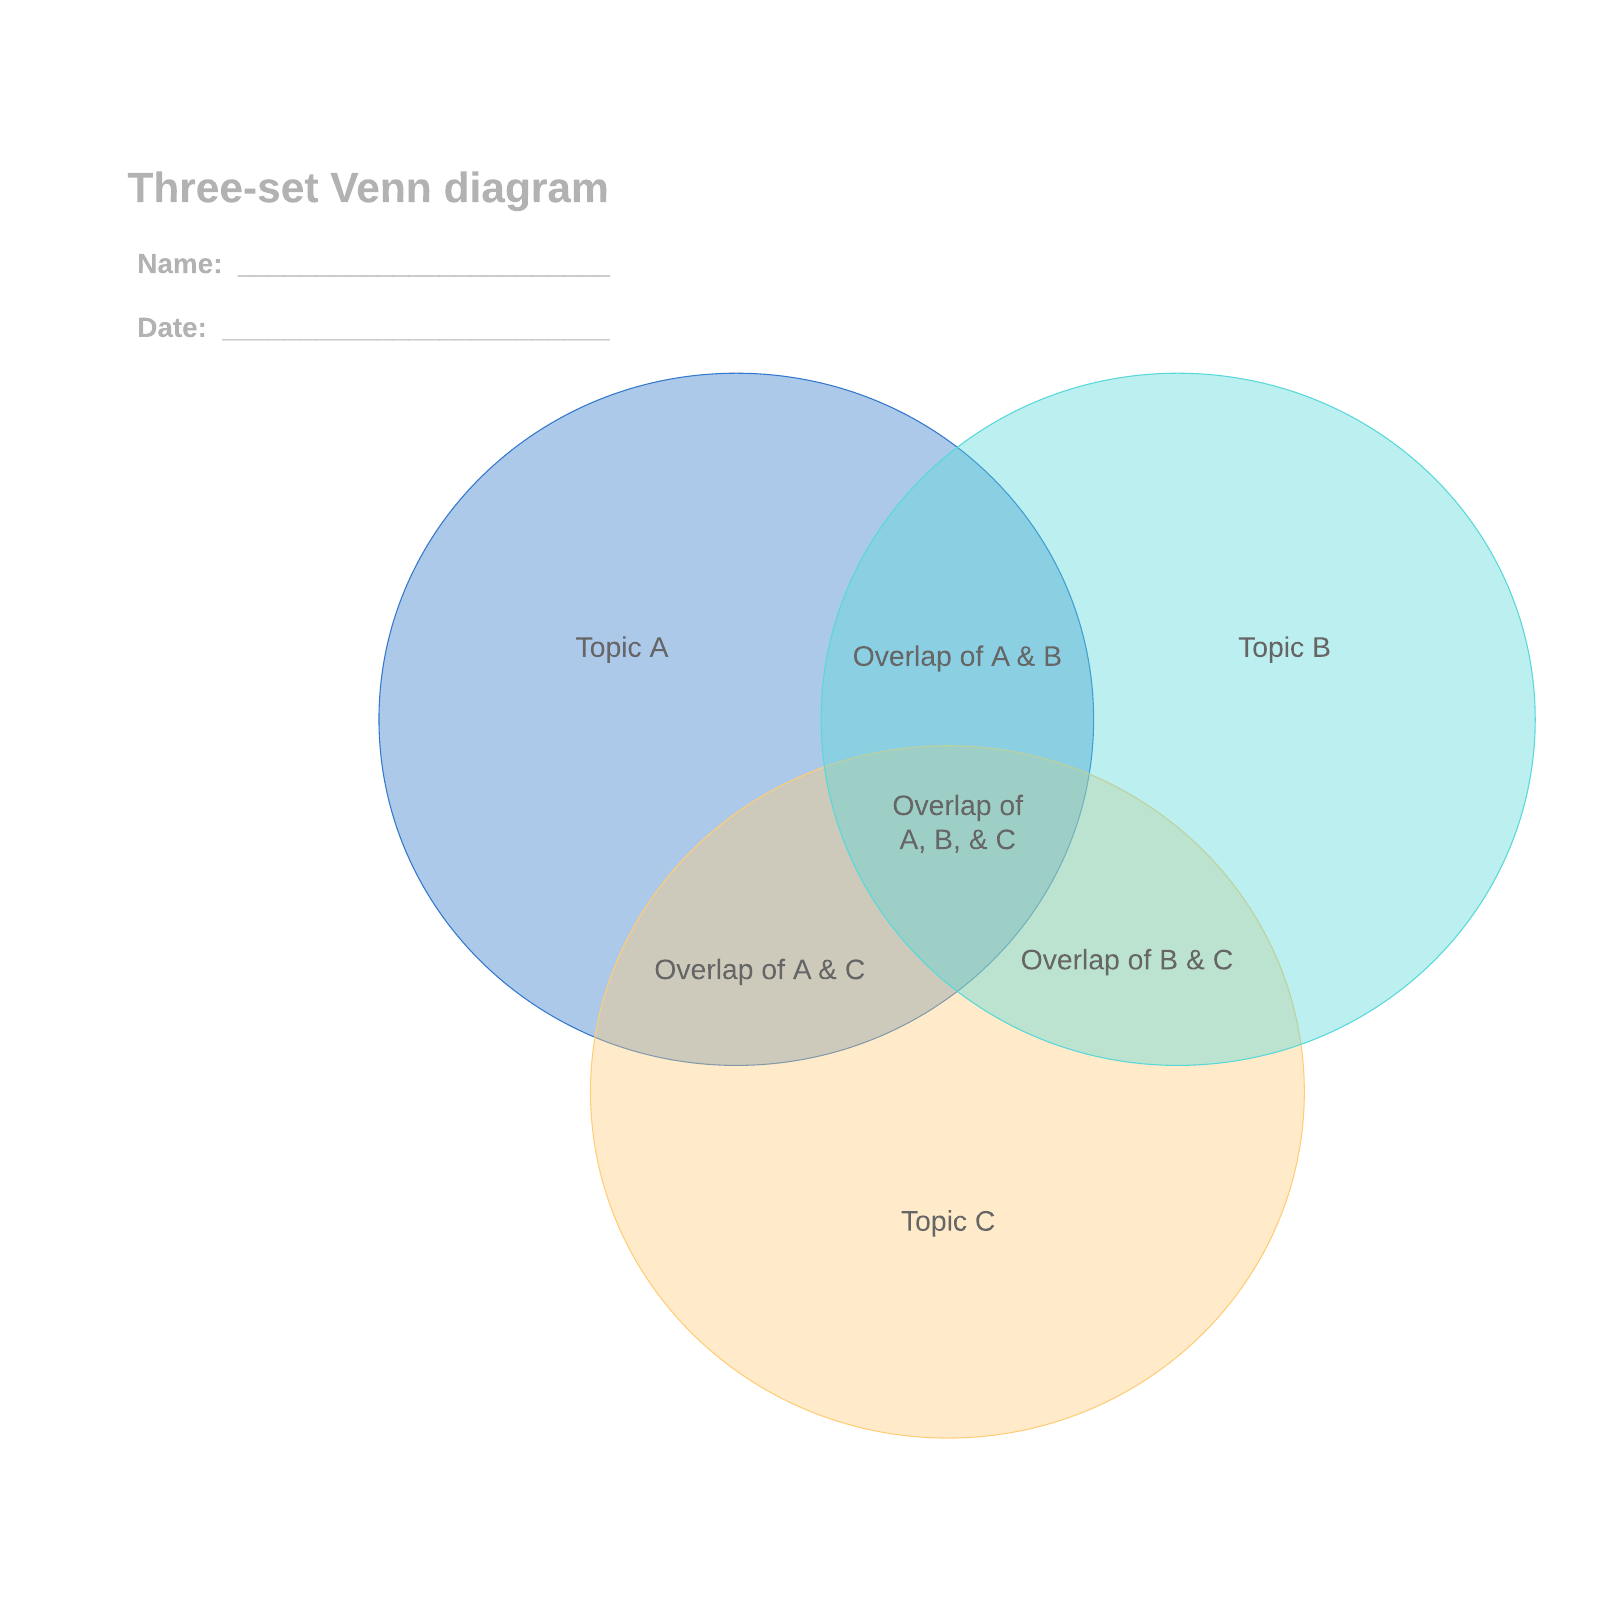
Say our universe is pets, and we want to compare which type of pet our family might agree on.
Set A contains my preferences: dog, bird, hamster.
Set B contains Family Member B’s preferences: dog, cat, fish.
Set C contains Family Member C’s preferences: dog, cat, turtle, snake.
The overlap, or intersection, of the three sets contains only dog. Looks like we’re getting a dog.
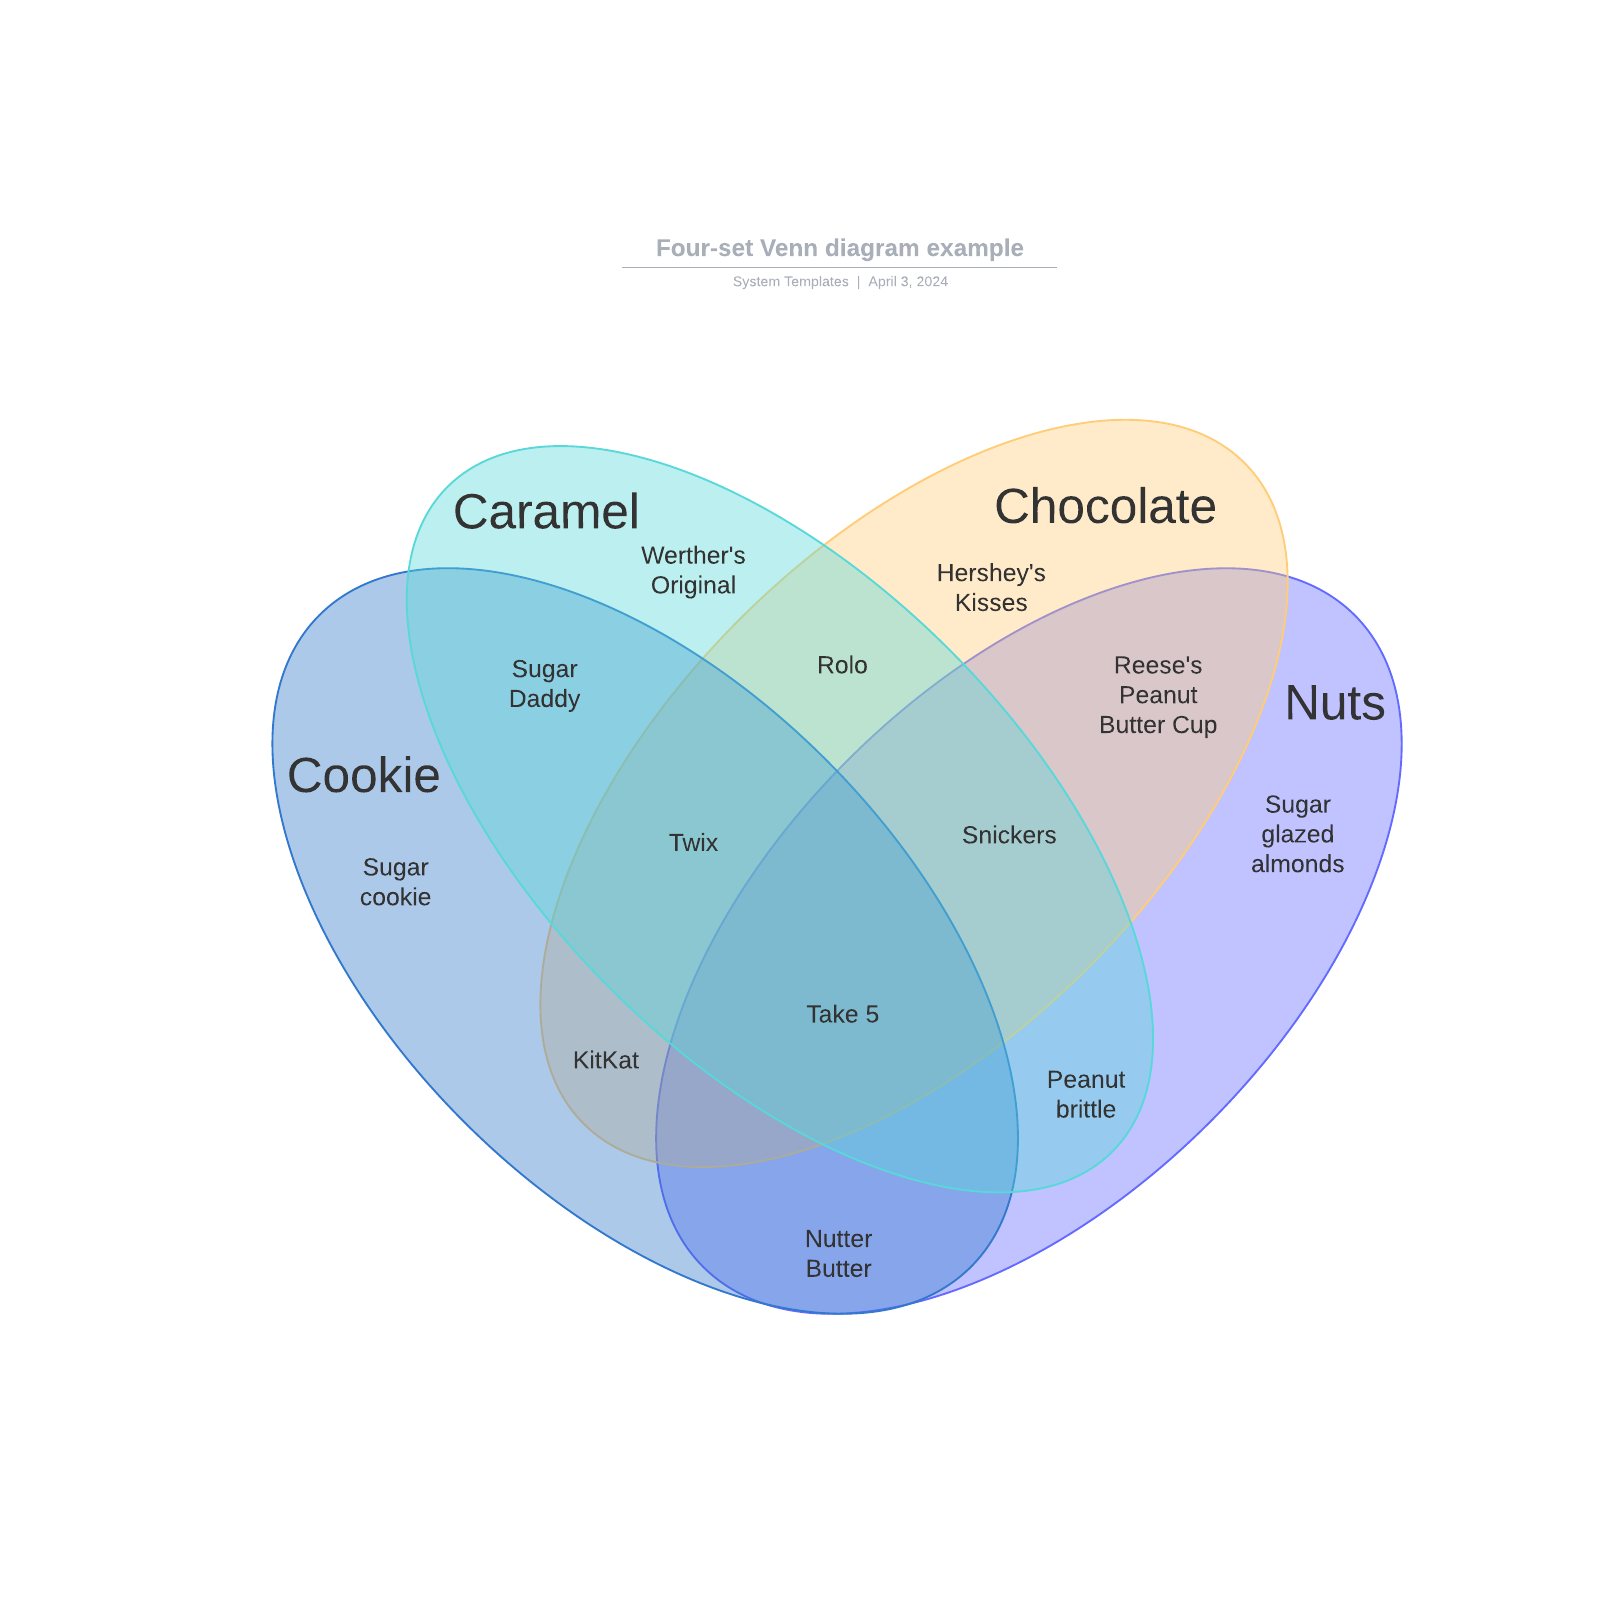
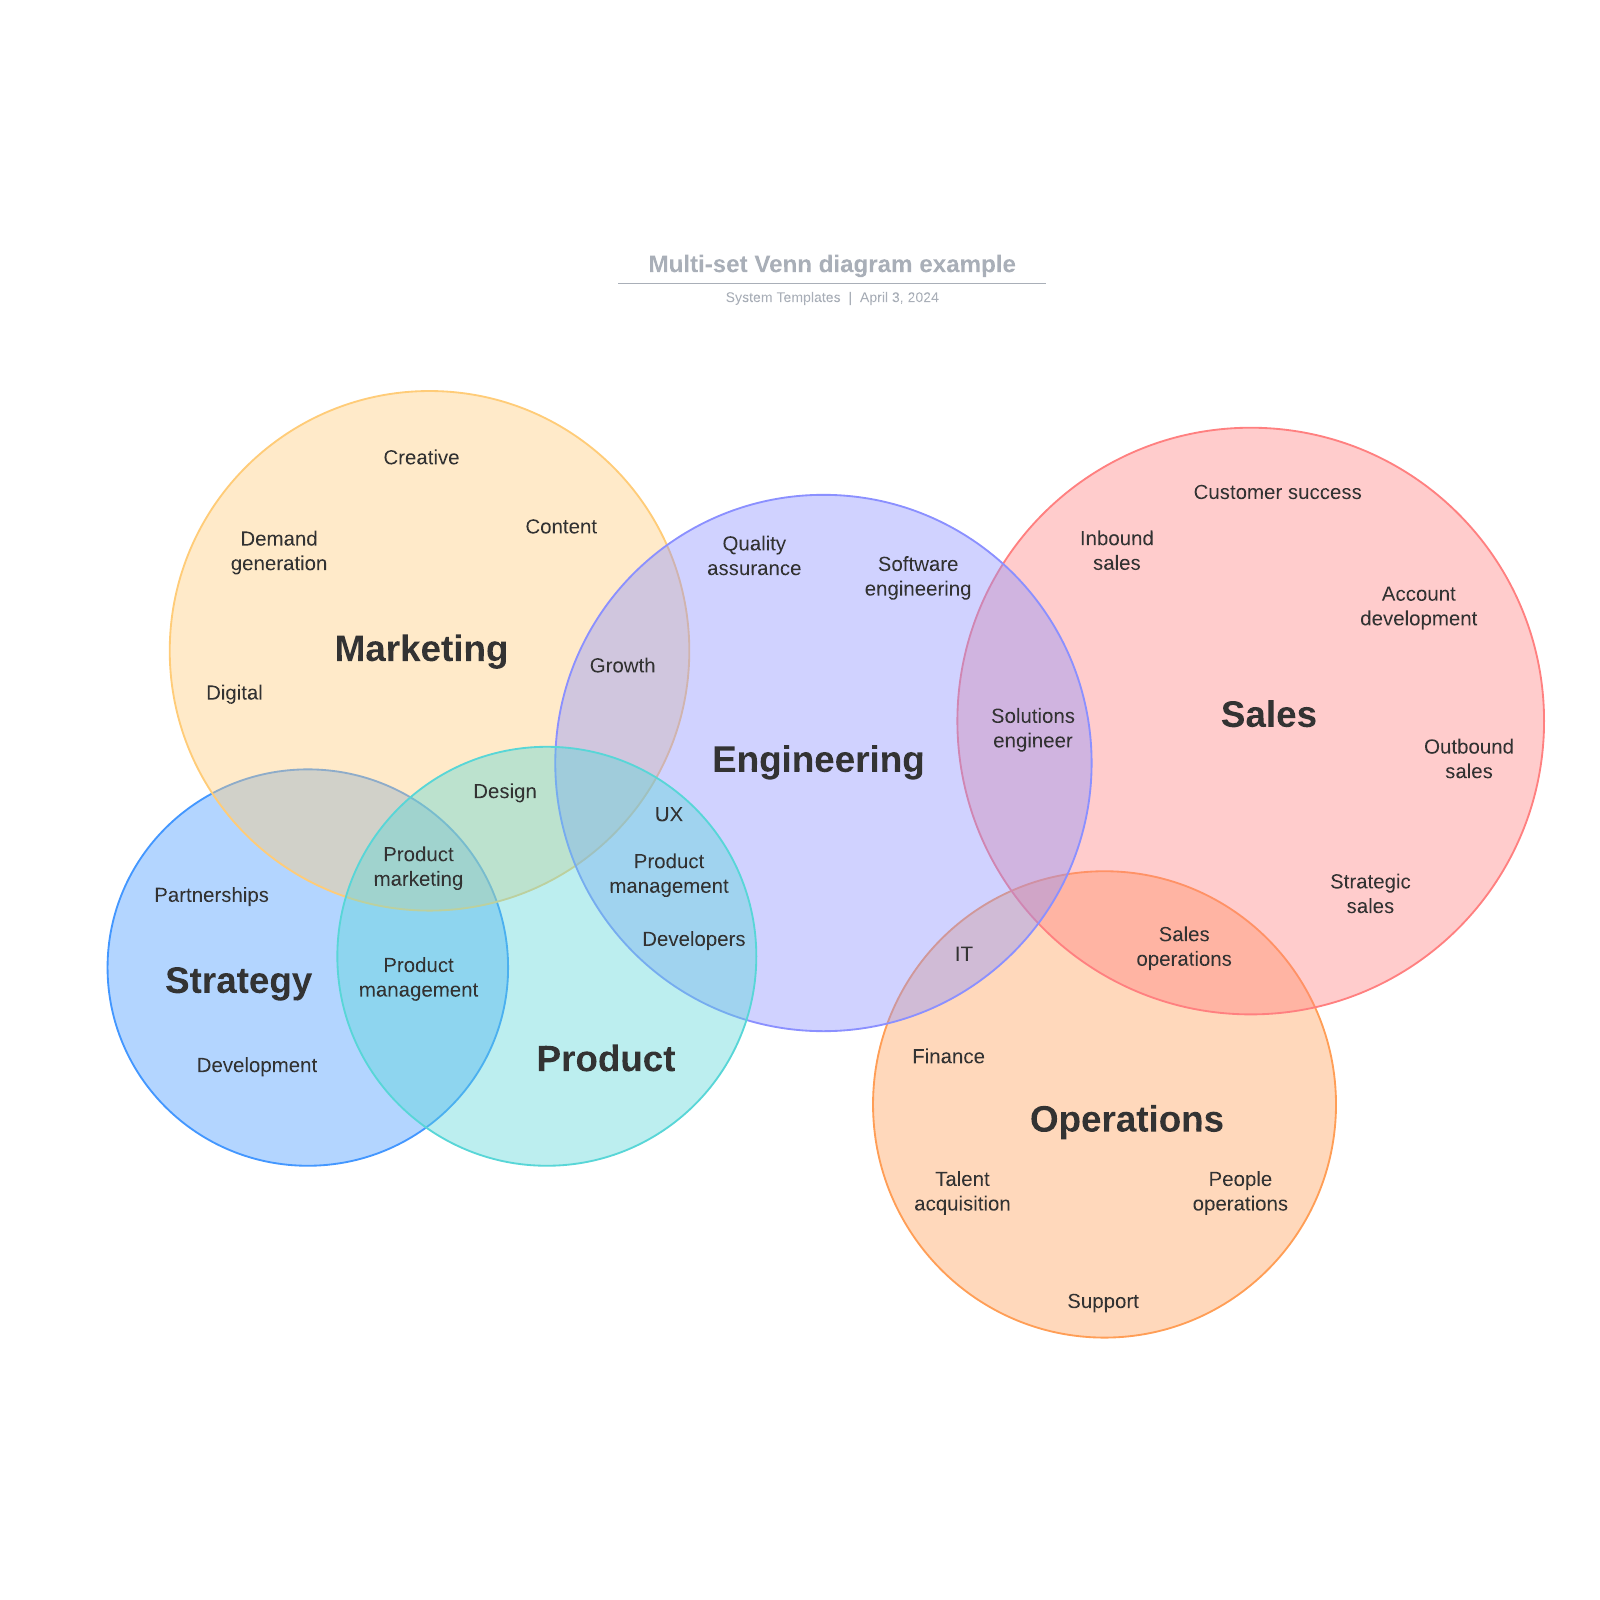
Of course, Venn diagrams can get a lot more involved than that, as they are used extensively in various fields.

Venn diagram glossary
|
Set: A collection of things. Given the versatility of Venn diagrams, the things can really be anything. The things may be called items, objects, members or similar terms. 
|
|
Union: All items in the sets. |
|
Intersection: The items that overlap in the sets. Sometimes called a subset. 
|
|
Symmetric difference of two sets: Everything but the intersection. 
|
|
Absolute complement: Everything not in the set. 
|
|
Relative complement : In one set but not the other. 
|
|
Scaled Venn Diagram: Also called Area Proportional. The circles (or other shapes) are sized by their proportional representation of the whole. 
|
|
Reuleaux Triangle: Shape formed from the intersection of three circulars or shapes, such as in a Venn diagram. 
|
|
Set notations: The concepts illustrated in Venn diagrams are expressed with mathematical notations such as those representing sets and subsets (in brackets), unions (with a U-like symbol) and intersections (with an upside-down U symbol.) |
| Set theory: The longstanding branch of mathematics dealing with sets. |

Everything you need to make a diagram
Make a polished, professional diagram for free with Lucidchart. No matter what you have in mind, we have the tools you need to build it. Make an account and start diagramming today.
Sign up free