A Venn diagram is a visual tool that helps identify similarities and differences between items. There are many different ways to create one, and the “best” way depends on your team’s needs.
In this article, we’ll break down how to create Venn diagrams in different programs, from PowerPoint to Google and more. Once you’ve mastered how to create visuals in the platforms that work best for you, you’ll convey logic and ideas easier than ever.
How to make a Venn diagram in Google Docs
Whether you want to use a Venn diagram for predictive analytics or to compare different solutions for a problem, you can create yours in Google Docs. There are a few options to do this.
Option #1: Use Lucidchart to add Venn diagrams in Google Docs
Lucidchart integrates with Google Workspace to make it as simple as possible to share and collaborate visually. The Lucidchart add-on for Google Docs lets you create a new Venn diagram, insert diagrams, or update the ones you already have in your Google Doc, saving you lots of time.
How to install the Lucidchart add-on for Google Docs
First, install the free Lucidchart add-on if you haven't already. Follow these quick steps to download it:
-
Open a Google Doc.
-
Select Extensions > Add-ons > Get add-ons.
-
Search for and select Lucidchart.
-
When a pop-up window appears, grant the necessary permissions to give Lucidchart access.
How to insert an existing Venn diagram into Google Docs with the add-on
-
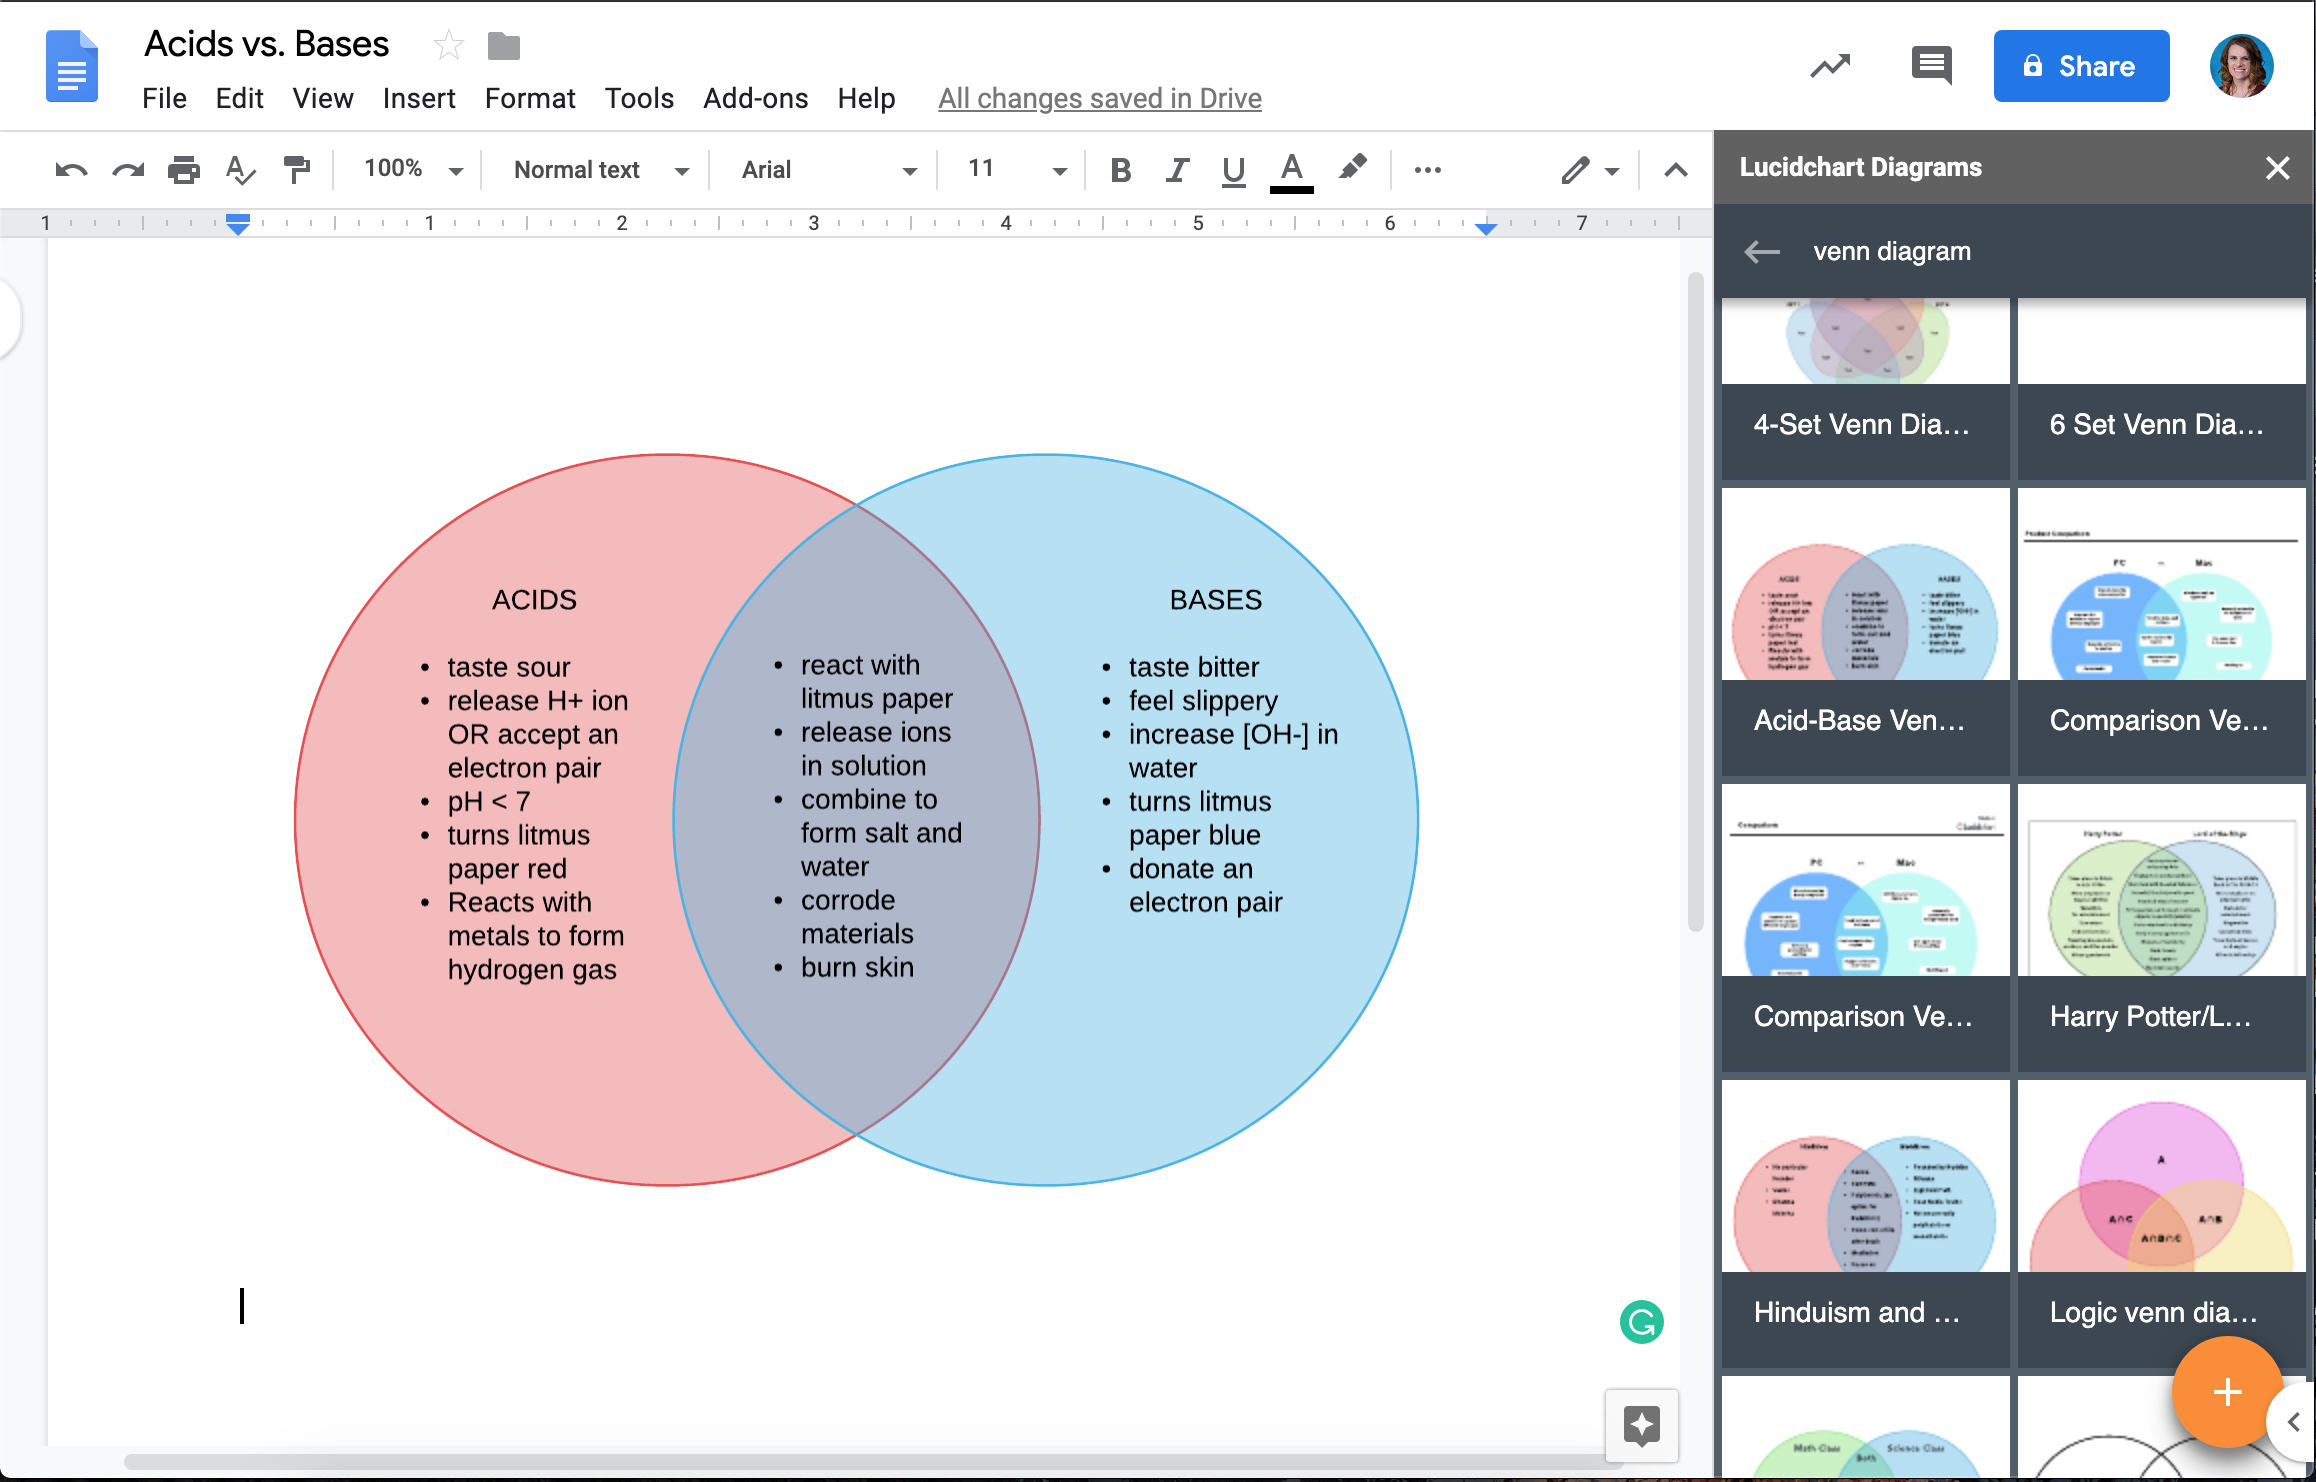
From your Google Doc, select Extensions > Add-ons and select Lucidchart.
-
Choose your Venn diagram from the list in the right-hand sidebar. Click +.
-
A preview of your selection will pop up. Click Insert.
How to create a new diagram in Google Docs with the add-on
-
Open a Google Doc.
-
Select Extensions > Add-ons. Navigate to Lucidchart and choose Insert diagram.
-
Select a template to customize or select a blank document.
-
Edit the template or drag and drop shapes to create your Venn diagram within Lucidchart.
Go back to your Google Doc. Using the Lucidchart add-on, select your newly created Venn diagram, and click + to preview and insert it.
Option #2: Use Google Drawings to make a Venn diagram in Google Docs
While it’s easier in Lucidchart, you can also build your Venn diagram natively in Google Docs through Google Drawings.
-
Open a Google Doc.
-
Select Insert > Drawing > + New.
-
Use the shape icon to add circles, and add text boxes to complete your Venn diagram.
-
Click Save and close.

How to create a Venn diagram in PowerPoint
In just a few steps, you can also create a Venn diagram in PowerPoint.
-
Open a new presentation. Navigate to the slide where you’d like the diagram.
-
Go to the Insert tab and click on the SmartArt icon.
-
Select a Venn diagram option and click OK.


How to format your Venn diagram in PowerPoint
Add text
Once you have selected the SmartArt Graphic that you want, a dialog box will popup to add text to your Venn diagram. Fill out the text fields for each circle in the bullet point list.

Style your Venn diagram
Right-click one of your Venn diagram circles. Select Format Shape. This will bring up a right-side panel with formatting options for both the text and the shape. Try changing the color—we switched our top circle to red.

Change the design
The standard layout can be spruced up; just click the Design tab. Here, we’ve kept the first theme, but changed the background to the third variant, with a black background, white text and circle outlines, and different shades for our circles.

Here’s what the final Venn diagram designed in PowerPoint looks like:

Let’s say that rather than a PPT file, we want to save our Venn diagram as a PNG image. You can do this by going to File > Export > Change File Type.
How to make a Venn diagram in Excel
The steps for making a Venn diagram in Excel are similar to those for making one in PowerPoint.
-
Open a new Excel worksheet.
-
Write down a list of each category you want to capture in the spreadsheet columns.
-
Navigate to the Insert tab, then click the SmartArt icon.
-
Choose the Venn diagram template that you want to use.

How to format your Venn diagram in Excel
Add Titles
To add titles, simply enter the text into the menu that appears after choosing your Venn diagram template. You can then format your titles just like normal text, changing the font, size, color, and much more.

Add Circles to Venn diagram
Adding circles to your diagram is useful if you want to compare more variables. This can be done very easily by following these steps:
-
Click into the diagram
-
In the design tab, click “Add Shape”
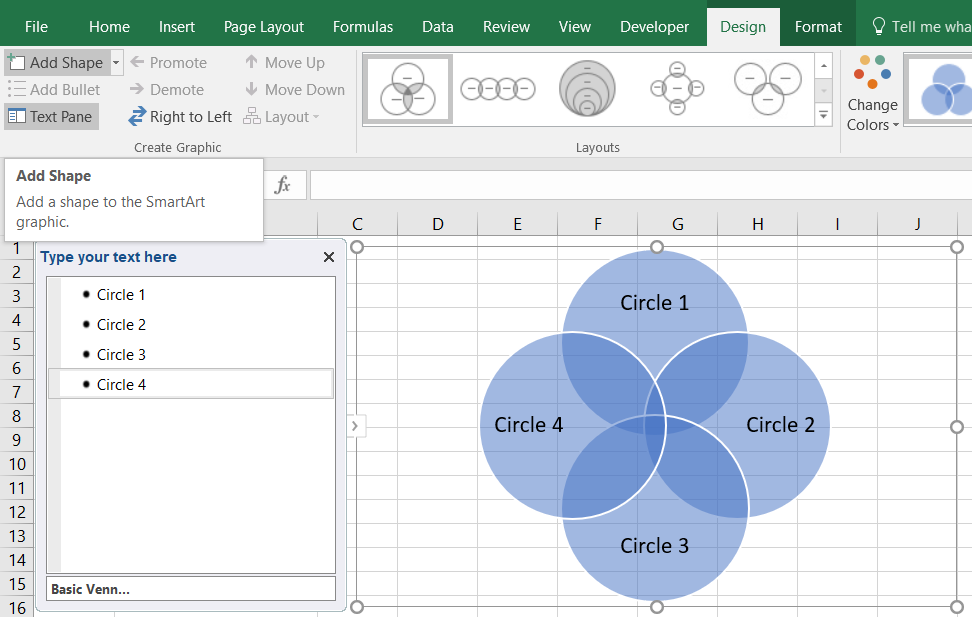
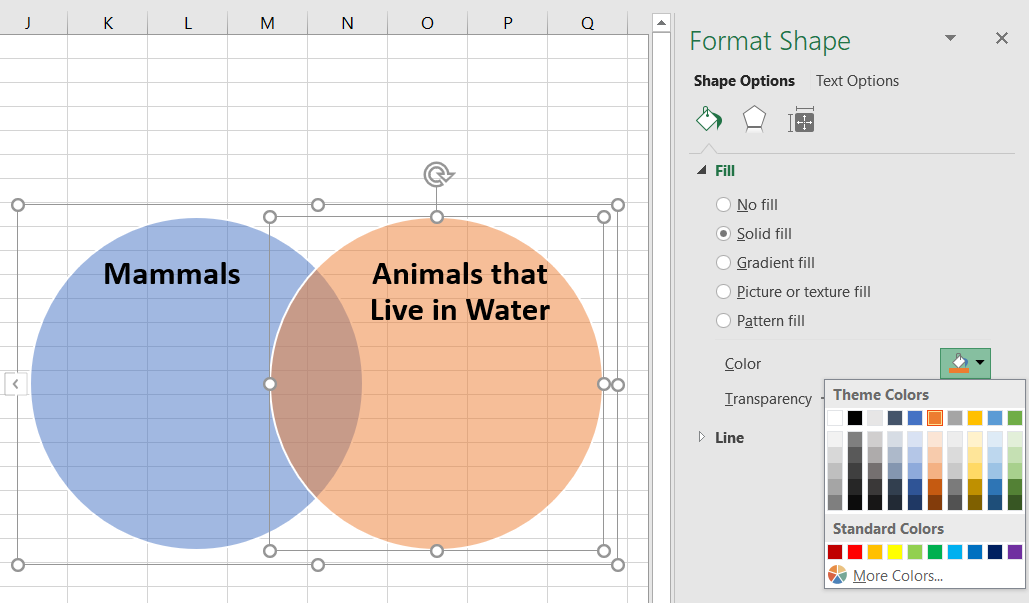
Circles can be deleted by clicking on the shape, and pressing the Delete key. We went ahead and deleted the third circle, and added the titles “Mammals” and “Animals that Live in Water” to our two circles.

Style Your Venn Diagram
To style your circles, right-click on one of them and select Format Shape. Then, change the color in the menu that will appear on the right of the window—we switched the second circle to orange for our example.
Add Content to Circles
Now that you have formatted your Venn diagram how you want, you’re ready to add content to the circles. Follow these steps to add text to your Venn diagram:
-
To include additional text in your diagram, you’ll need to draw text boxes onto the circles.
-
After drawing the text boxes, fill in these boxes with the lists that you already made (see step #2 at the beginning of this tutorial).
-
In this example, we’ve put “Mammals” on one side, and “Animals that Live in Water” on the other. Animals that are both mammals, and water animals occupy the middle, overlapping area of the diagram.

- Complete the diagram by adding all of your text to the appropriate circles.

If you decide to change the style of your diagram, just return to the Design tab to add circles or modify the structure. Be careful, though; the text you’ve added will not automatically snap to shapes and you may end up with an odd-looking diagram.
How to make a Venn diagram in Word
There are two ways to add a Venn diagram to a Word document.
Option #1: Use Lucidchart to add a Venn diagram directly to Microsoft Word
While Microsoft Word works well for creating text-based reports and papers, it lacks the functionality you need to create powerful imagery and diagrams. Luckily, Lucidchart solves the problem by fully integrating with Microsoft.
How to install the Lucidchart add-in for Word
To start, you’ll need to download the Lucidchart add-in for Word.
-
Open a Microsoft Word document.
-
From the toolbar across the top of the editor, click File.
-
Select Get Add-ins.
-
Click More Add-ins.
-
Search “Lucid” in the add-ins store.
-
Choose the Lucidchart add-in and click Add.
-
Follow the prompts to finish the setup.
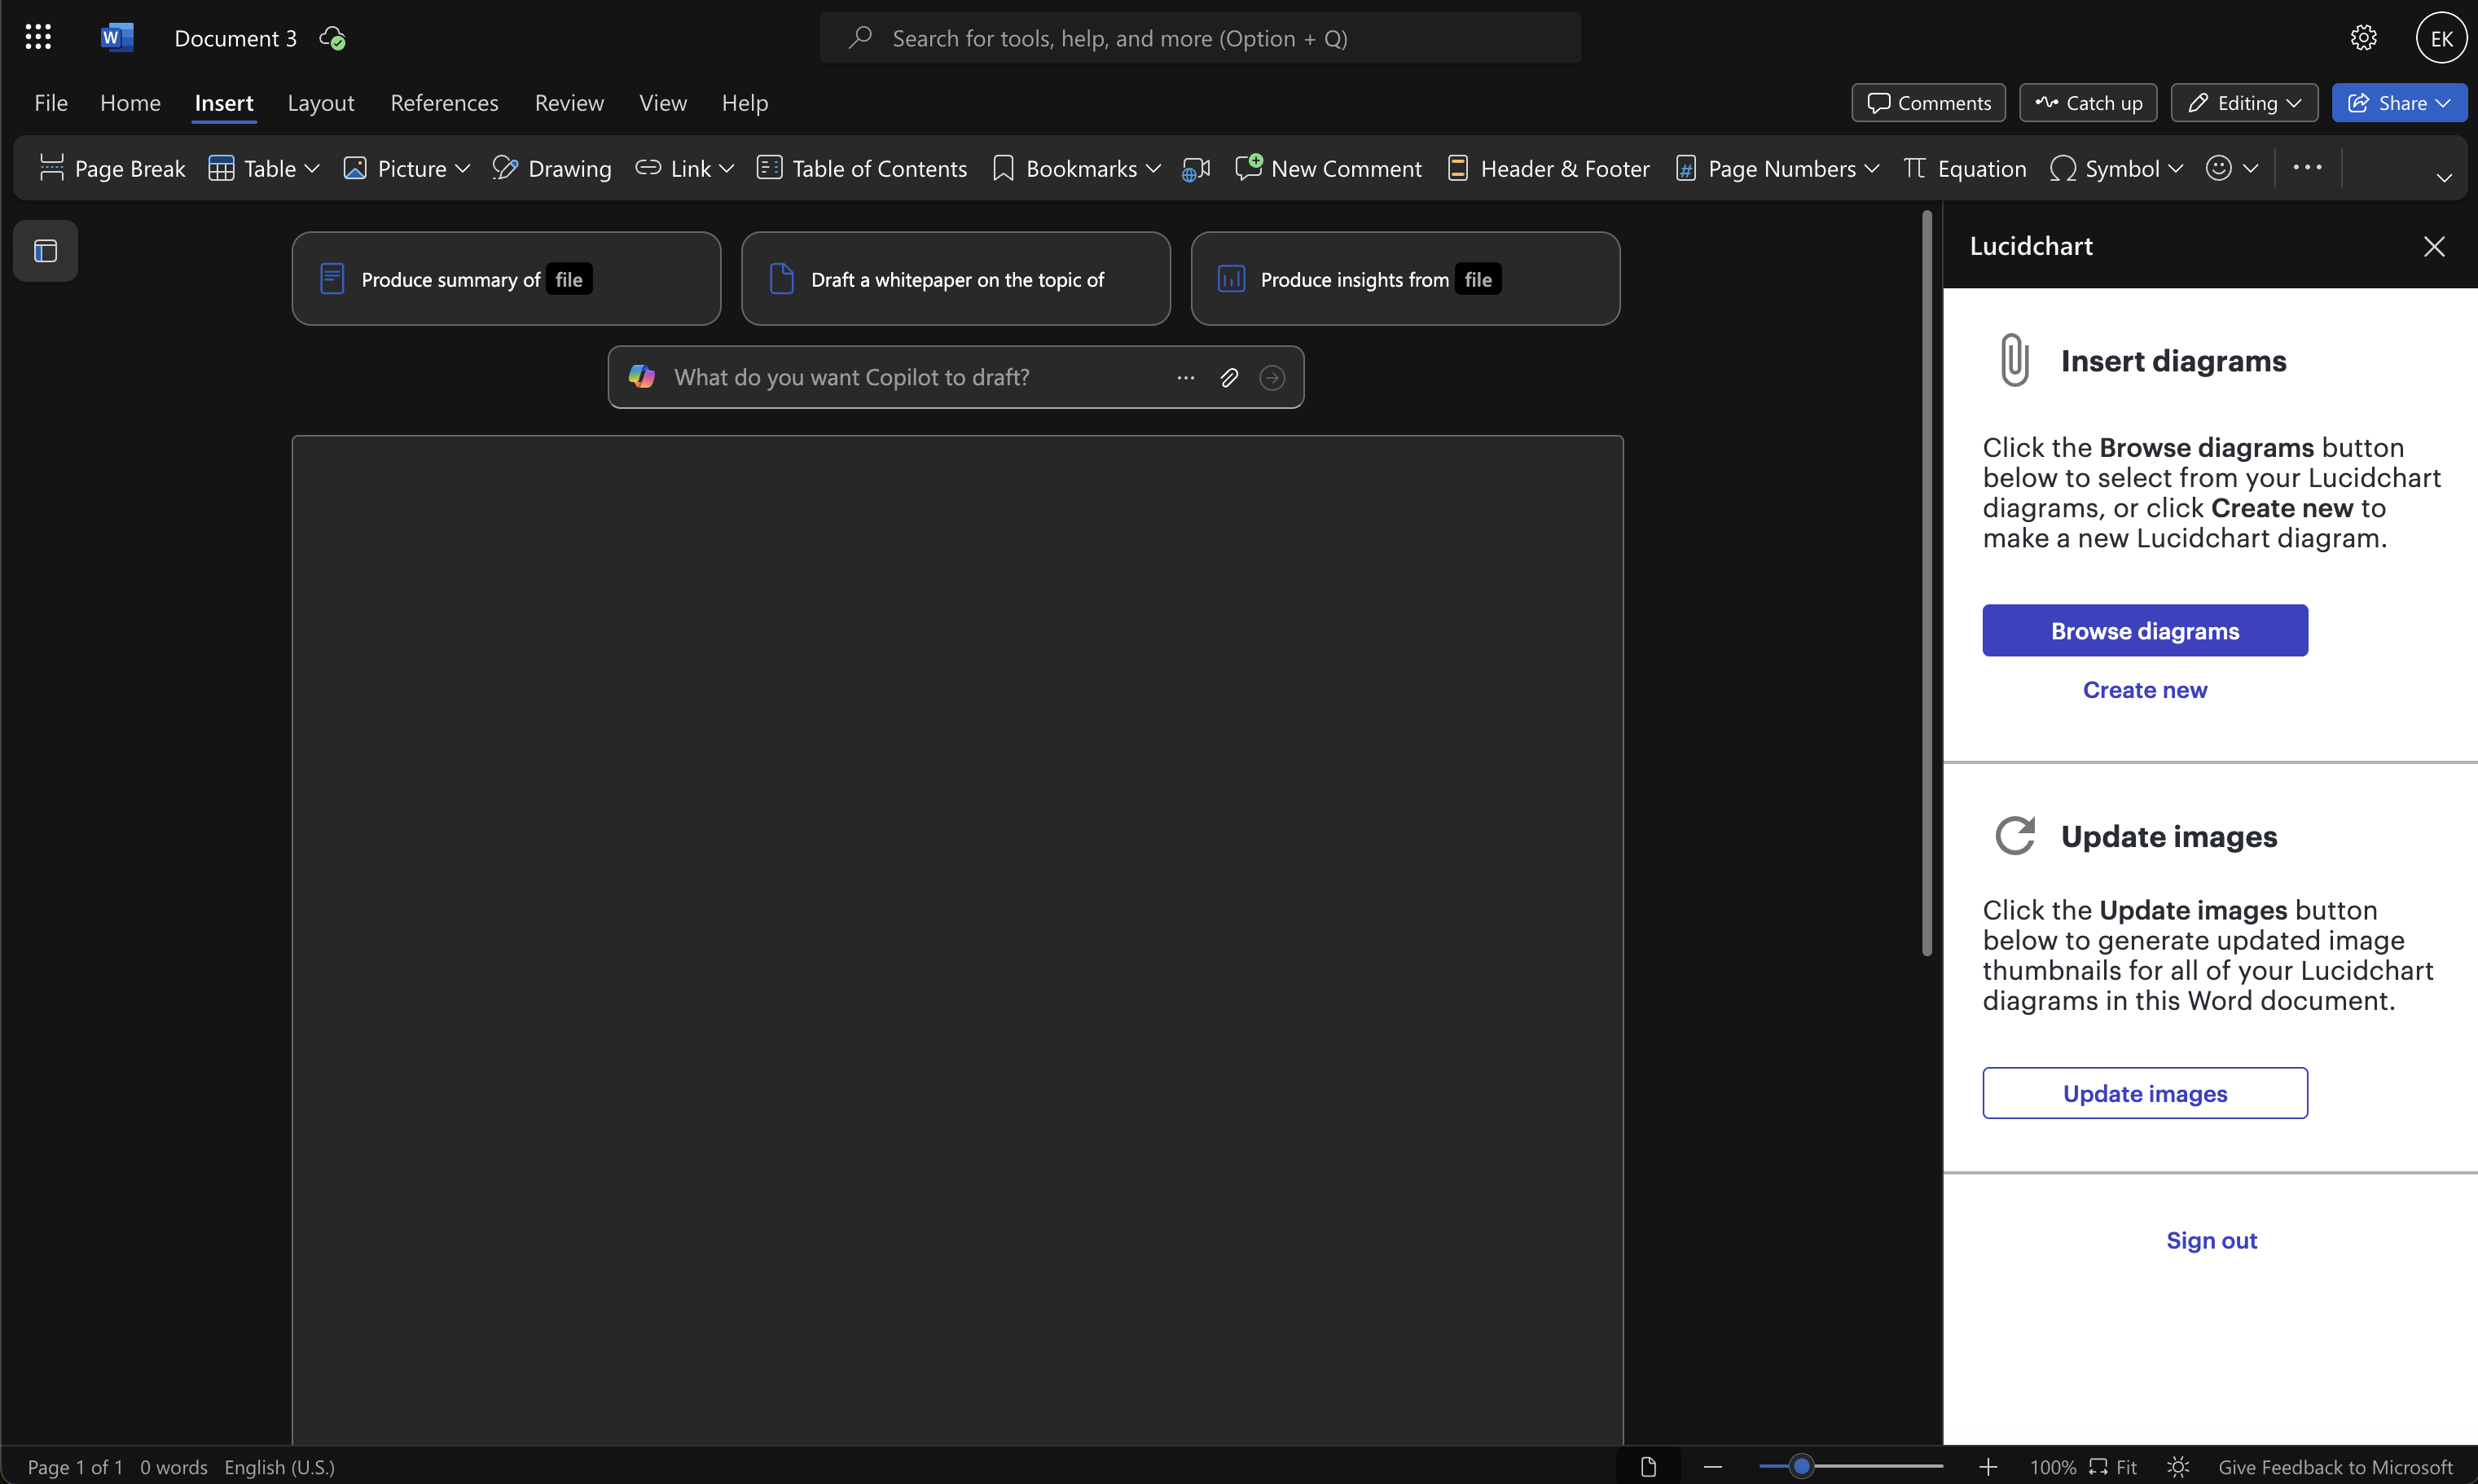
How to insert a Venn diagram into Word with the add-in
To insert a Venn diagram you’ve created as a high-resolution image into Word, follow these steps:
-
Open a Microsoft Word document.
-
From the toolbar area across the top of the editor, click Insert.
-
Click My Add-ins.
-
Select the Lucidchart add-in.
-
Log in to Lucid if prompted.
-
From the panel that appears, select the diagram you’d like to insert.
Option #2: Make a Venn diagram in Word using the shape library or SmartArt
To manually make a Microsoft Word Venn diagram, you will have to use either the shape library to build it out or SmartArt. While these options work, they both offer fewer personalization and formatting options than Lucidchart and are more difficult to make.
How to make a Venn diagram in Word using the shape library
-
In Word, go to the Insert tab on the toolbar, and in the Illustrations section, select Shapes. A drop-down menu will appear.
-
Add shapes and lines from the shape library to build your Venn diagram.
-
Add text by returning to the Insert tab and choosing Text Box.
-
Save your document.
How to make a Venn diagram in Word using SmartArt graphics
-
In Word, go to the Insert tab and select SmartArt in the Illustrations section. A pop-up window will open.
-
Go to the Relationship tab and select a Venn diagram layout. Click OK.
-
Click [Text] in the Text pane to add text. You can also add a Text Box from the Insert tab.
-
Format as desired with colors, sizes, and more.
-
Once finished, save the document.
How to make a Venn diagram in Lucidchart
Lucidchart has several useful features that you won’t find in other tools, allowing you much more flexibility to easily create professional-looking Venn diagrams.
Follow these simple steps to start on your intuitive diagrams:
1. Sign up for a free Lucidchart account
You’re only a click and an email address away from a new Lucidchart account.
2. Add shapes or use a Venn diagram template
In Lucidchart, there are a few ways to build a Venn diagram. You can either drag and drop circles to build one manually, or you can get a head start with one of our powerful templates.
Create one manually by adding shapes
Make sure you have the correct shape libraries open by clicking the shapes button on the left toolbar, selecting More shapes, and selecting the Venn diagram library.
When you’re ready to begin, just drag a shape from the toolbox on the left and drop it onto the document.
Create one with a template
-
In Lucidchart, on your My documents page, click + New and select Create from template.
-
Type “Venn diagram” into the search bar. Choose the template you want to use.
3. Style your Venn diagram
Give your Venn diagram a personal touch by adding custom styles. You can change the colors, border styles, border thickness, and much more.
-
For quick edits, right-click a shape. A menu will appear with popular editing options.
-
To move a shape, click and drag. Drag from an edge or corner to resize, and click and drag the handle icon to rotate. To move multiple shapes, select them by holding down Shift as you click each object, and then drag as needed.
-
From the formatting bar, you can choose options for different font sizes, alignment, fill color, and gradients.
No matter which platform you choose, a Venn diagram remains a classic yet valuable tool for teams to compare items or categories. While every method we’ve covered will get the job done, the choice is ultimately yours. While Word and Google are fine for basic needs, consider Lucidchart for intuitive, powerful features that other platforms can’t match. No matter which path you take, it’s time to start visualizing connections.