
Every time you hear Lucidchart mentioned, you inevitably hear the same (but true!) buzzwords: Easy to use. Collaborative. Visualization.
But you might be wondering: What can it actually do for me?
I have great news! Lucidchart makes it easier than ever to visualize your progress, determine if you’ve met performance goals or KPIs, and share insights with your managers and co-workers, all the while staying user-friendly.
Let’s learn how to put together a dynamic dashboard using advanced features such as data linking and dynamic shapes.
1. Gather information
When I’m starting a dashboard, the first thing I do is determine what information I want to display. This information will dictate the structure of the dashboard and what information I will need to import into the document. Consider:
- Who is the target audience for the dashboard?
- Am I planning on sharing it with my manager (maybe around bonus time, who can say) to show how well my year has gone?
- Am I keeping it for myself to make sure I’m hitting the targets I need to hit? Or am I going to share it with my team members to gain insight into who might need additional support?
Once I’ve determined the information I want to visualize, the fun can really start.
As an example throughout this article, I’ve decided to adopt the persona of a sales rep, and the information I want to display is quota attainment by month. Since I’m a solutions engineer, I decided to engineer a solution to the problem of not actually having any real sales data by generating a spreadsheet with realistic (but fake) data about my quota attainment.
2. Import data
Now that I have my spreadsheet, I can import it into Lucidchart. There are a ton of different ways to get the data into the diagram, but a simple way is to go to the Data tab to the left of the document and hit the “Link Data” button at the bottom of the screen.
From there, you can select the import source and data you’d like to import. My favorite source is Google Sheets because Lucidchart has a built-in integration that refreshes the data automatically. Instead of re-uploading a spreadsheet with new information, I can just change the data on the spreadsheet, and it will update in Lucidchart.

VIDEO TUTORIAL
Walk through the process of linking data from Google Sheets, Excel, or a CSV.
Watch nowYou’ll be asked to select the header row for your spreadsheet. This is the row that gives a description of what its column actually contains and makes it easier for you to reference the data in the column.
Then you are asked to select a column that contains unique information. This step isn’t strictly required, but it is useful when you start to get into more granular data control. Pro tip: If your data doesn’t have a unique ID column, it’s easy to add a column called “Unique ID” and sequentially number all the rows.
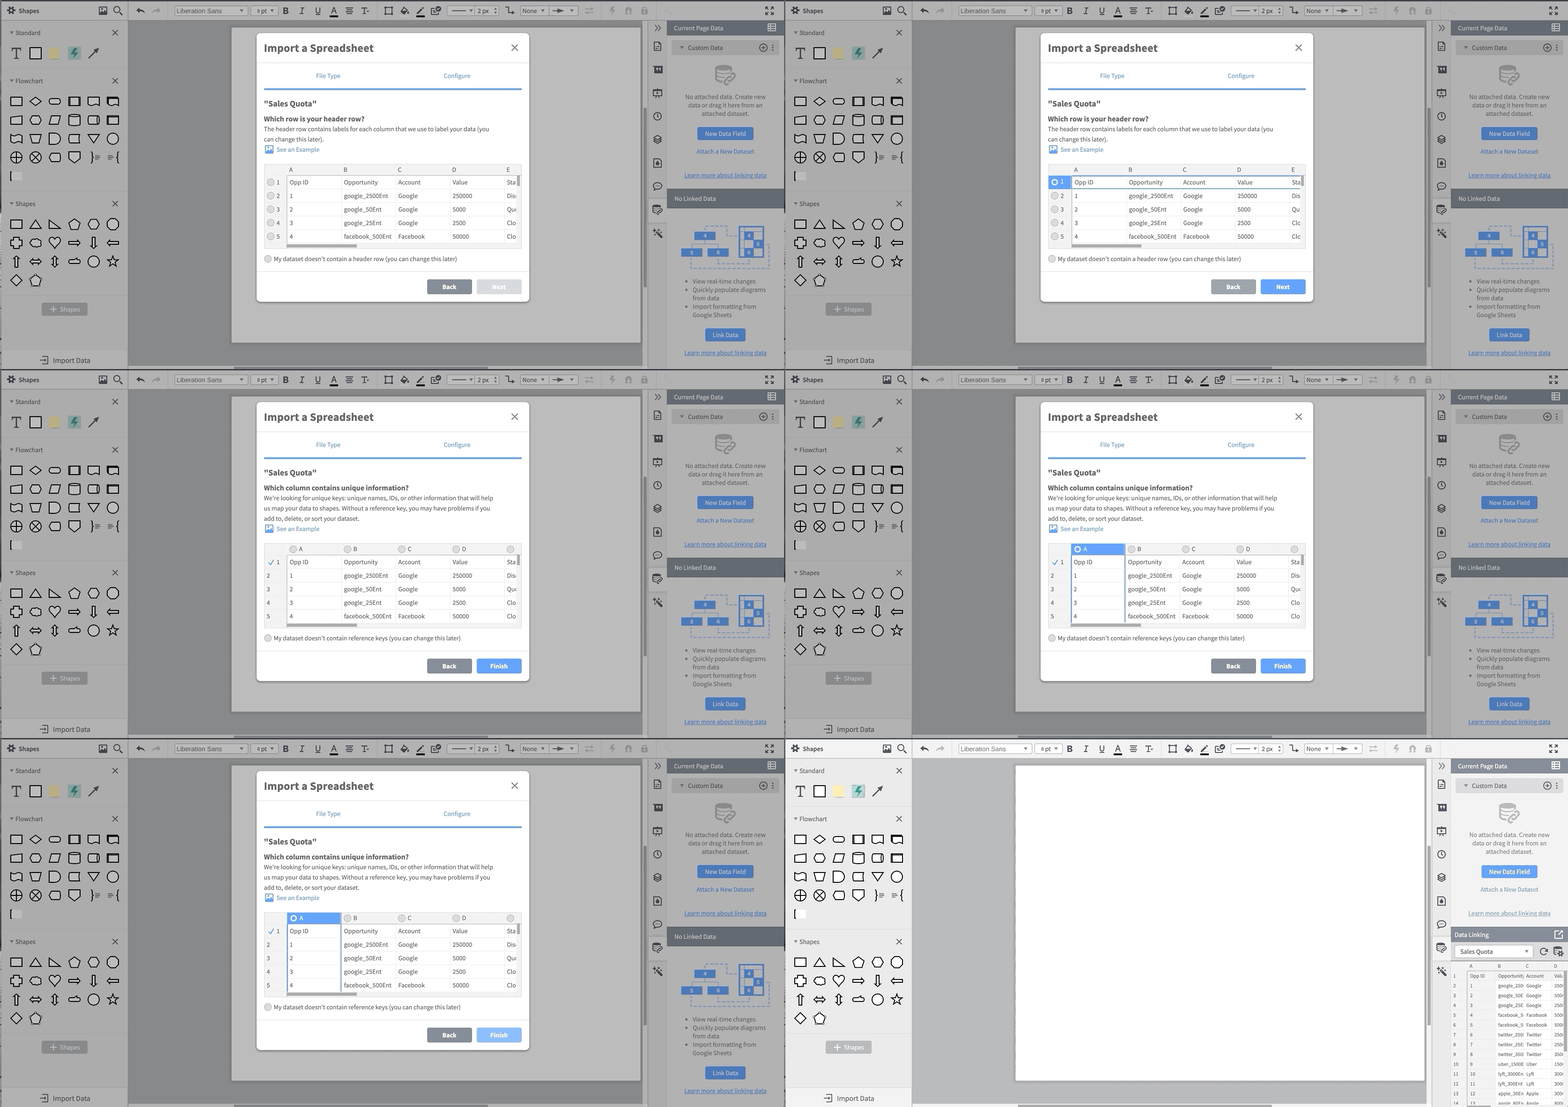
Once you complete these steps, you can see the linked data in the data panel. If you imported multiple sheets, you can change which data you’re viewing by using the drop-down menu.
3. Add data to specific shapes
From here, you can start associating data with specific shapes. The dynamic shape library is a great way to display data because these shapes will change based on the data that is associated with them.
For my quota attainment, I decided to use a dynamic progress bar. I like to attach my data to the shape before I set up all of my equations and conditional formatting for a shape. It’s more than possible to set up the formulas first, but I think attaching the data first makes troubleshooting a little bit easier.
One of my very wise engineering professors told me, “Emily, you need to work smart, not hard.” In this instance, it is easiest to get one shape formatted exactly how you want, then make however many copies you need and then simply drag and drop the correct data onto the shape.
Since I’m making a chart of quota attainment by month, I decided to start with January. You’ll notice when a dynamic shape is first put onto the page, it has some data fields intrinsically associated with the shape. The two highlighted places are where you can change the shape properties.

I usually pick the colors so I can make sure my dashboard falls within my color palette. (Much better.) I then pick all of the other information I would like to display underneath each month. I drag out and format a text box for month, % quota attainment, and a triangle that I will conditionally format to only be visible underneath the current month.

Here is the point where I will start adding the imported data. First I select all the shapes and group them into a single shape using the group function (Cmd+G or Ctrl+G). Now that I have a single shape, I drag the row of data that I want associated with that specific shape by clicking the row number on the left of the data tab and drop it onto the shape.
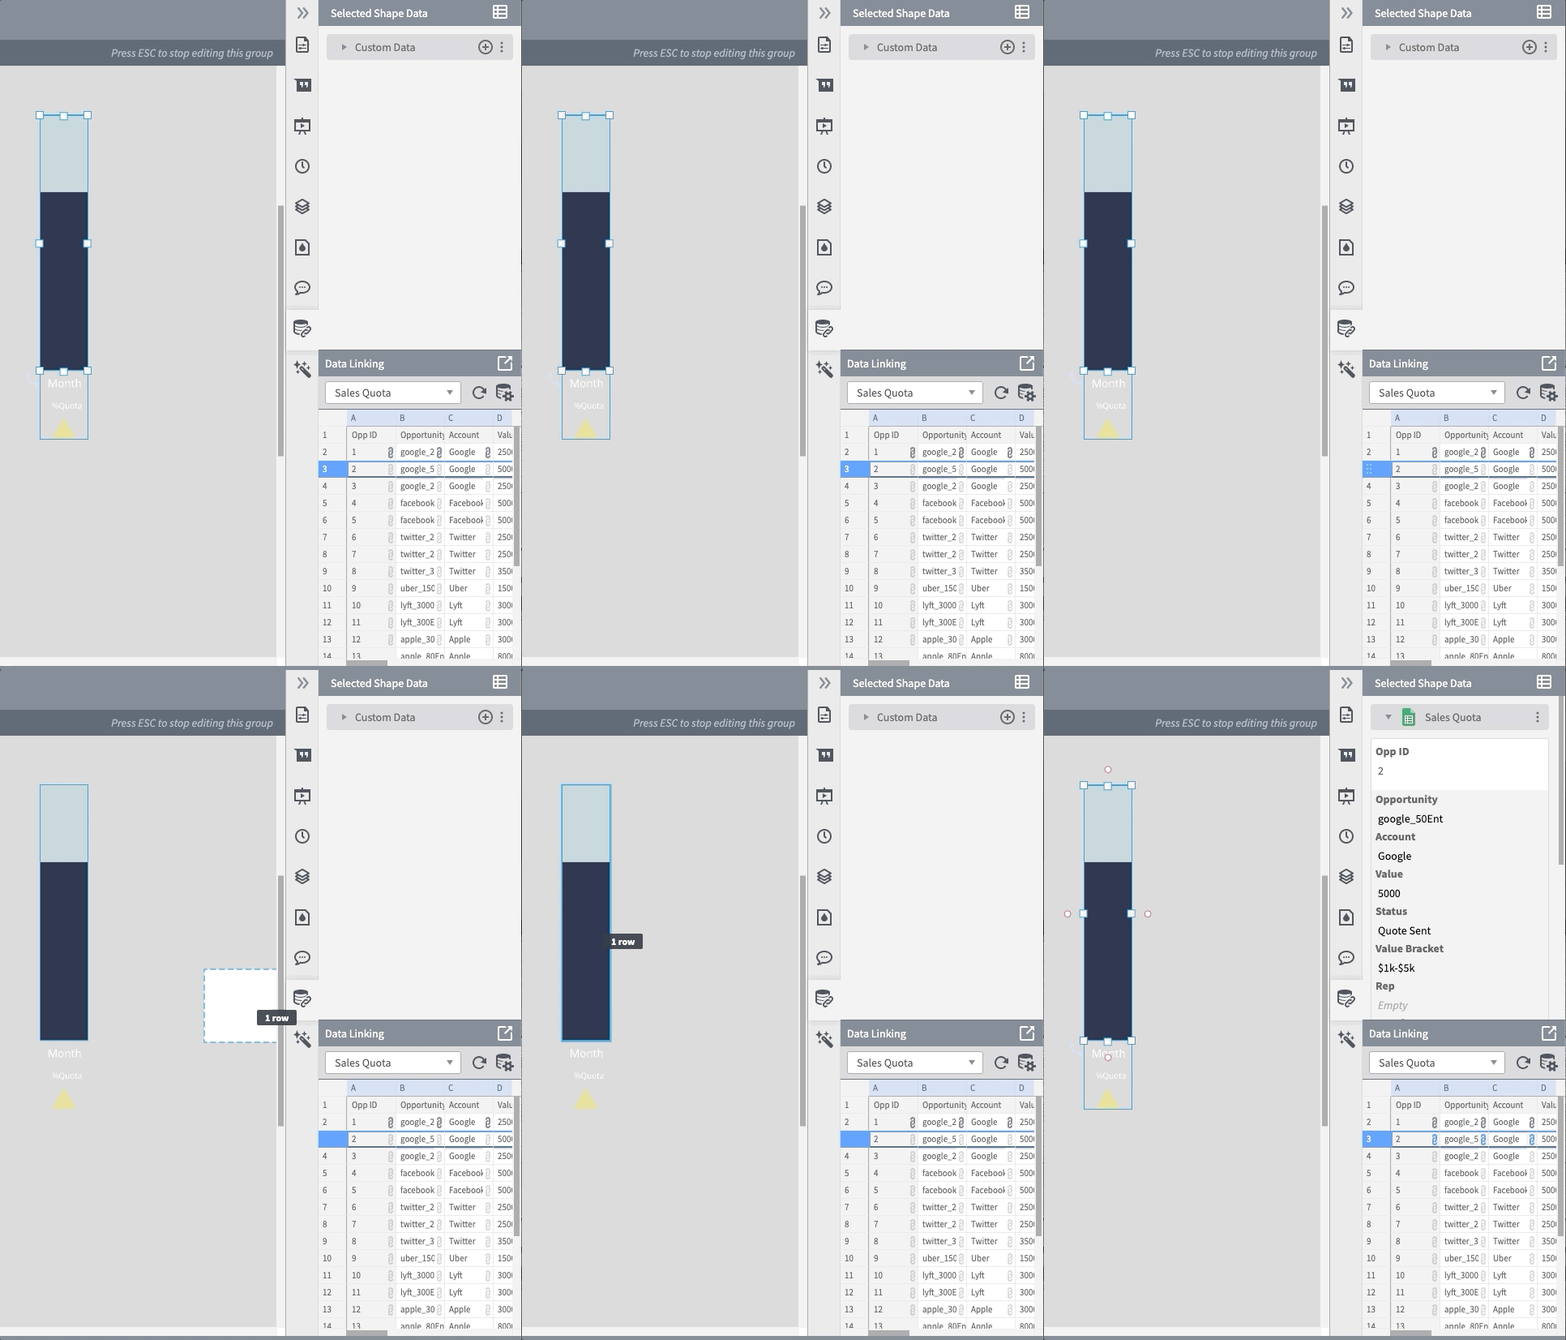
We’ve done it! We’ve linked the data! Now all we have to do is choose which data to display where.
4. Display shape data
Let’s start with the progress bar. First, click into the data panel for the dynamic shape. We have to set the minimum and maximum values of the progress bar. 0 is almost always the minimum, so we can leave that one alone. The maximum should be the upper limit of whatever data you would like to display.
I’m going to make the maximum my goal quota for the month. I know what you’re thinking: But Emily, my quota changes every month! Fear not, my friend. We can use a formula to automatically use whatever quota you have in your spreadsheet. Since the column in my spreadsheet that tells me my quota is called “Quota,” I will use the formula =parent.” Quota”. Note: Formulas are case-sensitive.

There are a few different ways to reference data in Lucidchart: See our Help Center for a tutorial on how to use formulas.
In this case, I used the “parent” reference because the shape data I’m referencing is associated with the group shape. I have to call the parent data. If I had dragged the data directly onto the dynamic shape, I could have used the “this” or “@” reference.
And now we have the maximum all set!

Now it’s time to move on to the value that we want to display.
Now, if we were only doing one month, it would be exactly the same as setting a maximum, just substituting the “Quota” for “Closed.” However, since it will be a full calendar year of data, and we want the months not to give an error message or do anything funky, we’re going to do something a little fancy: We’re going to write *gasp* an if statement.
What are the two options for our if statement?
- If the month is in the future, we know there is no data in the spreadsheet about quota attainment for that month. So if the cell is empty, we want the quota to display 0.
- If there is quota data in the cell, we want it to display that data.
The way if statements work is your first pass in which statement you’d like evaluated. In this case, we want to know if there is any data in the “Closed” column associated with this shape. You then pass in what you would like to happen if the statement is true, followed by what you would like to happen if the statement is false.
So, in this example, our if statement will look a little something like this:
=IF(ISEMPTY(parent.”Closed”), 0, parent.”Closed”)
We first ask if the cell is empty (ISEMPTY(parent.”Closed”), and say if it is empty we want to go ahead and say the value is 0, and if it isn’t empty to display how much was closed that month. Now we can see that thanks to my random number generator in the spreadsheet, I met my quota for January.
Next, I’m going to make sure the month and quota % are displayed below the progress bar.
The way we can do this is to make a custom data field by clicking the little plus icon on the right side of the custom data bar. Now we need to pull the monthly data from the parent shape, just like we pulled the data for the progress. Since the column that contains the month information is called “Month” in the spreadsheet, the function is =parent.”Month”

Now that I have the correct month associated with my shape, we get to display it. Luckily, it’s very easy—you just have to click the +T button on the right when you hover over the shape data.
And now we have the correct month below the progress bar!
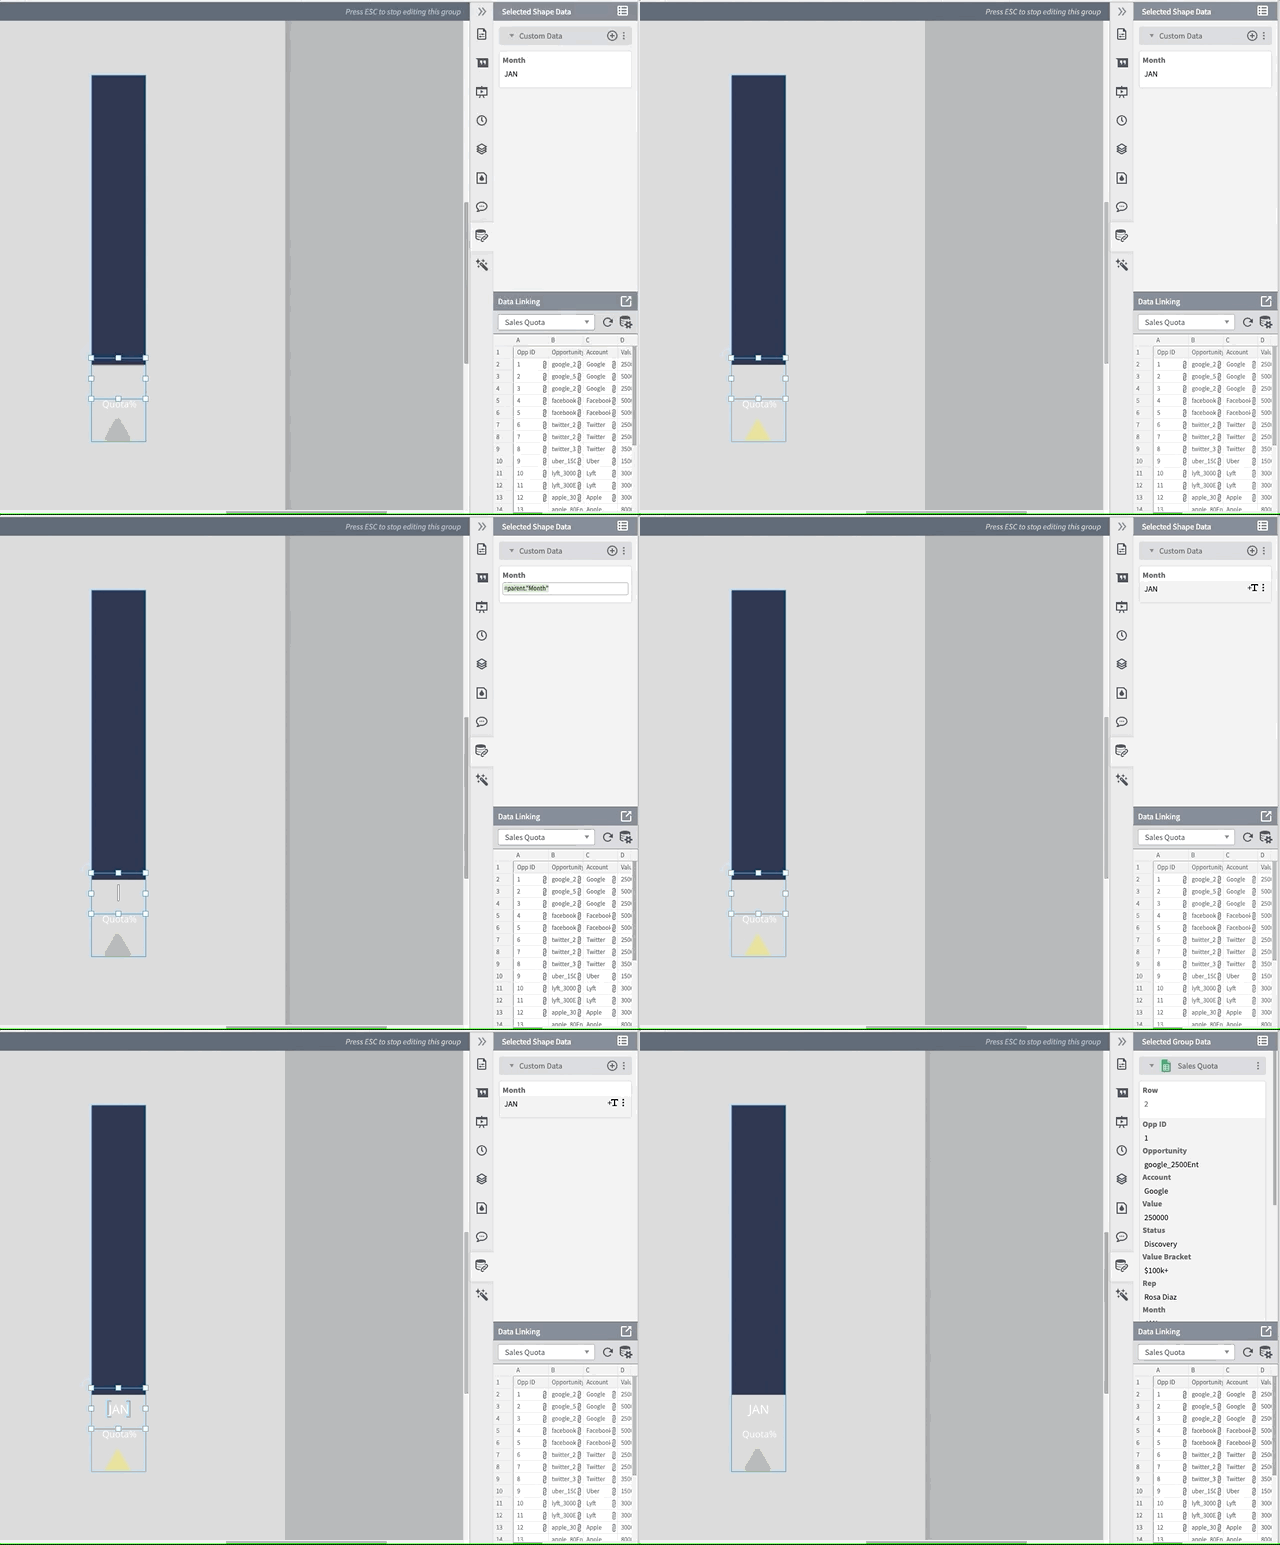
Now, we do the same thing, but with the quota percentage. Since Lucidchart can do most mathematical operations, I’m going to do the percentage calculation in the formula bar. Since we’re going to run into the same empty problem we did with the quota display, we’re going to write another if statement.
The first part of this if statement is the same as the last if statement: We want to know if the cell is empty or not. If the cell is empty, I want it to display a dash to indicate that the month hasn’t happened yet. If the cell is not empty, I want it to display the percentage of quota attained. When we put all that together, we get:
=IF(ISEMPTY(parent.Closed), "-", ASPERCENT(parent."Closed"/parent."Quota"))
This is what it should look like in the custom data field.

And now we have the quota percentage displayed below the progress bar!
5. Add formulas for conditional formatting
The last step before we start copy-pasting without abandon is to add the data for conditional formatting. I have two rules in mind: First, I would like to see at a glance if my quota percentage is 100% or higher. Second, I would only like the indicator triangle to appear under the current month.
We already have data we can use for the first rule (the quota percentage), but we’ll need to add a data field to the triangle. I’m going to call it “CM” for current month, and it will look up the current month column from the parent data and return a “Yes” or “No.”
The way we do this is—you guessed it—another if statement! The question we have this time is “Is it the current month?” and we would like the formula to return “Yes” if its true and “No” if its false. The if statement will look like this:
=IF(parent."Current Month" = parent."Month", "Yes", "No")

We did it! We can now start copy-pasting.
I made 12 copies of my shape and used the “distribute” function to make sure they are all lined up nicely.

Now, I can take the corresponding row and drop that data into the corresponding month, just like we did with the first row of data. It will ask you if you’d like to replace the data set, and you want to pick “Replace.” Then the shape will automatically update with the data from the correct month!
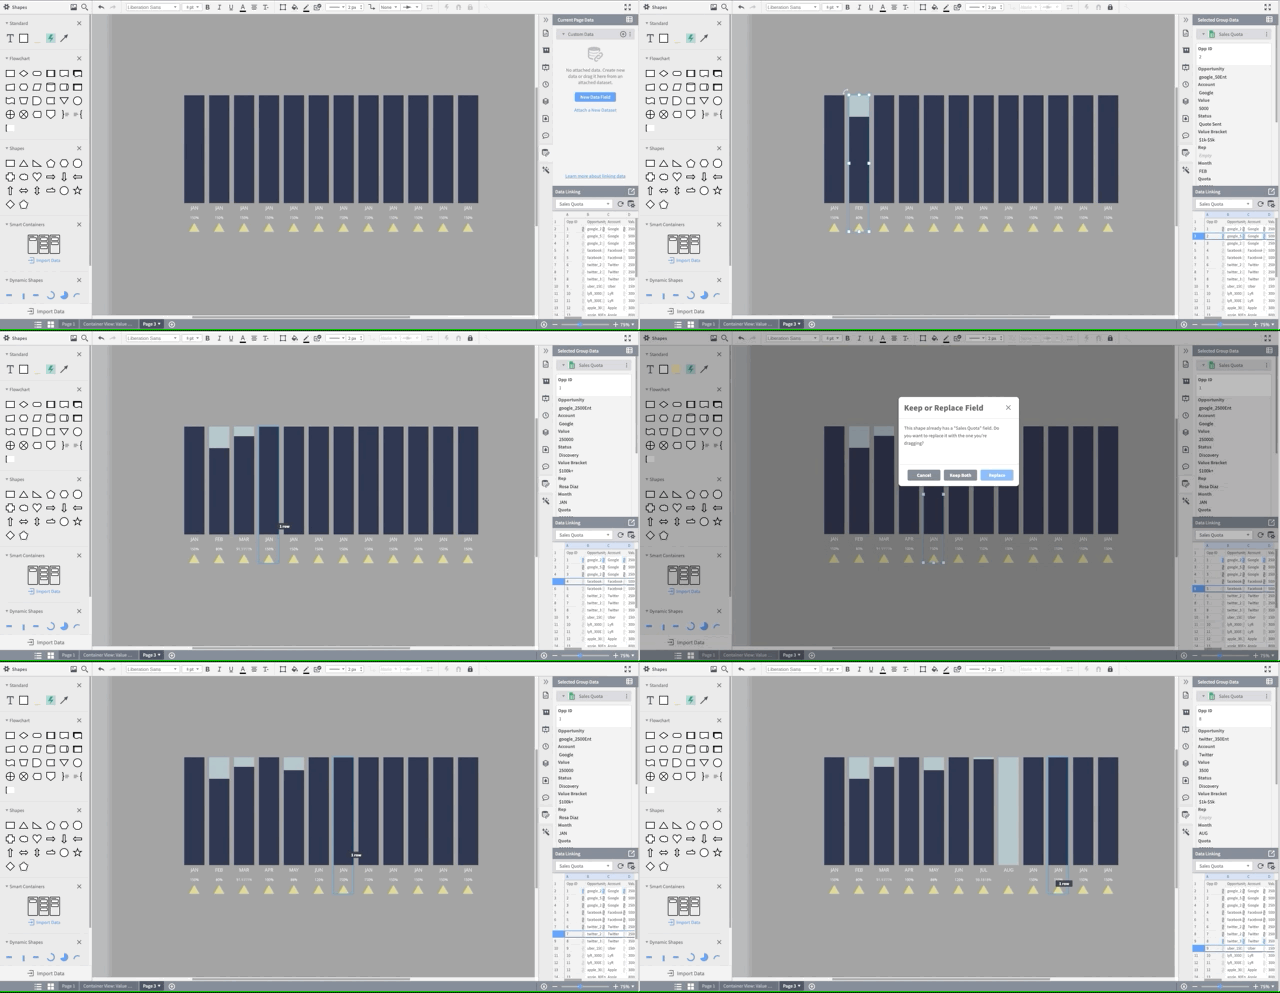
And now we have a nice visual display of quota attainment by month.
The last step (hooray!) is the conditional formatting rules.
To learn more about conditional formatting in Lucidchart, check out our video tutorial.
Watch now6. Set rules for conditional formatting
Now you can create conditional formatting rules to change a shape’s format or attach icons that help you interpret your data at a glance. In this example, I want to quickly be able to see:
- What month it is using the triangles at the bottom of the chart
- If my quota was met
For the month indicator conditional formatting rule, click the wand on the right panel of the document and click “Create new rule.”
There are many different ways to use conditional formatting to accomplish this particular task, but I’m going to use the “Shape Data” drop-down menu. Since we want all the triangles with the “No” property attached to be invisible, keeping only the current month’s triangle visible, I’m going to select the “CM” custom data field from the data field drop-down menu.
Then I can select the “contains” option and have “No.” I could have also selected “Does not contain” and typed “Yes” and gotten the same result.
I now select what properties I want that shape to display. Since we want it to be invisible, I’m going to check the “fill” box and select an empty fill pattern. Now only the current month’s triangle is displayed.
You have to make sure that the rule is applied to the shapes that you want to be affected by the rule. In this case, I’m not using the CM data property anywhere else on the page, so I just applied the rule to the entire page.
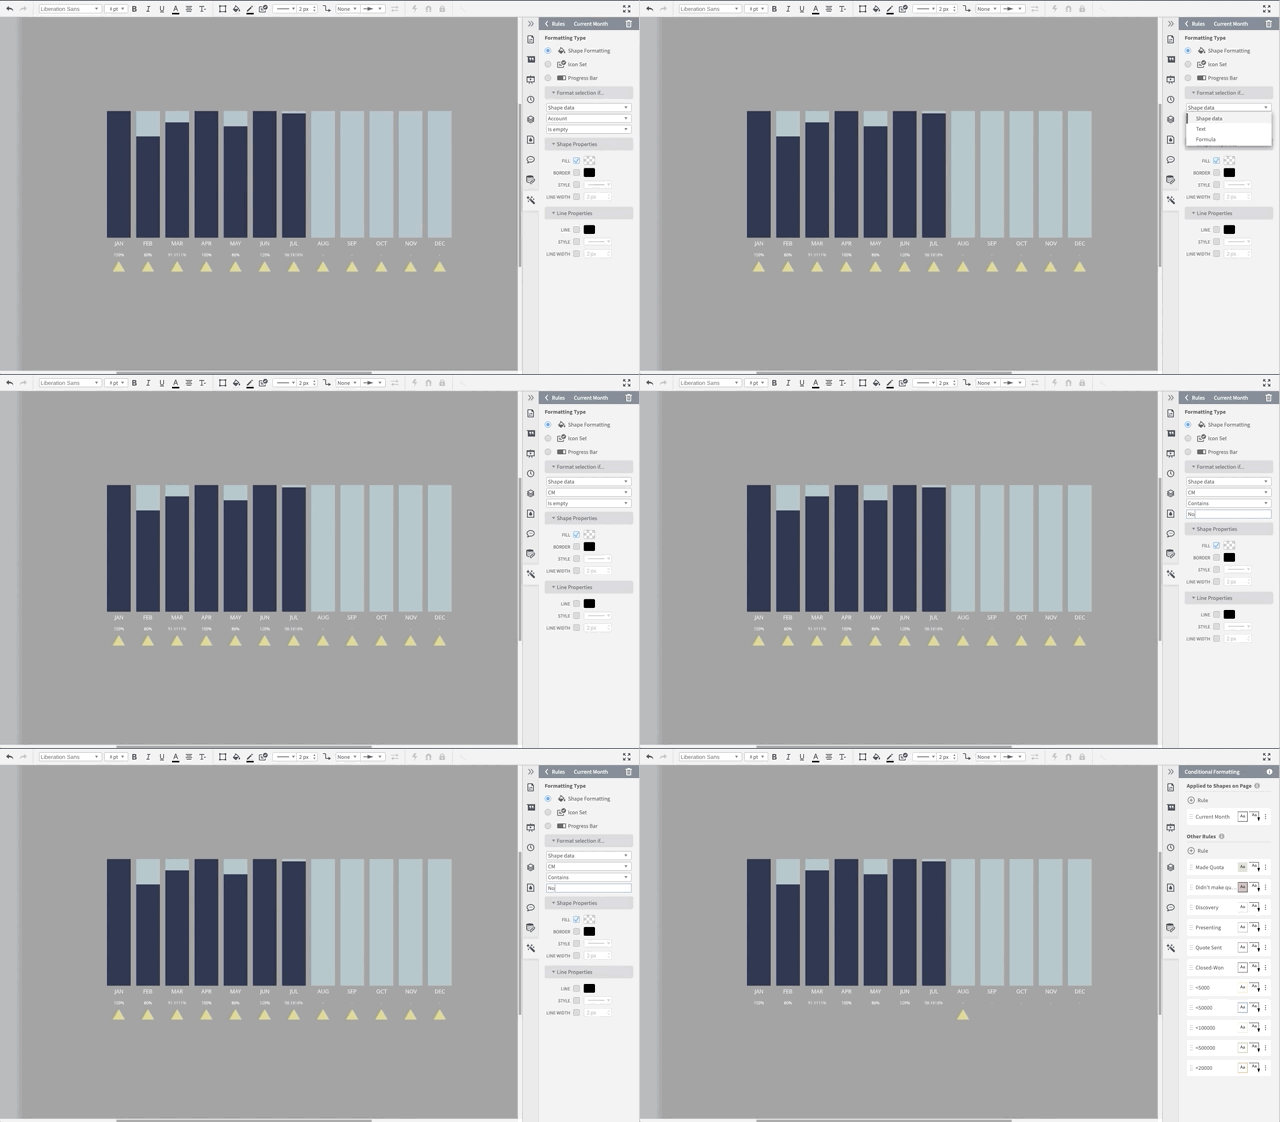
I also would like to quickly see if I exceeded my quota, so I’m going to create another conditional formatting rule called “Made Quota.” Again, there are many different ways to pass in the conditions to trigger the formatting rule, but shape data is the most straightforward. The data field we’re looking for is “Percent of Quota,” and we want it to be “greater than or equal to 1.” Why greater than 1 and not 100%? Lucidchart is simply displaying the decimal value as a percentage, so 1 = 100%.

I decided I wanted the formatting to be noticeable, but not intrusive, so I selected to fill the shape at a very low opacity and give it a light and thin border. And after I save the rule and apply it, I can quickly see that I met or exceeded my quota in January, April, and June.
Now, I also want to quickly be able to see if I didn’t meet my quota. Since the “Did not meet Quota” rule and the “Met Quota” rule are so similar, I’m going to duplicate the “Met Quota” rule and just change a couple of small things. You can do this by clicking the three dots to the right of the rule and selecting “duplicate.”

Now all I have to change is “greater than or equal to” to “less than” and change the fill color.
And now I have a functioning dashboard! Here is a video of the dashboard in action:
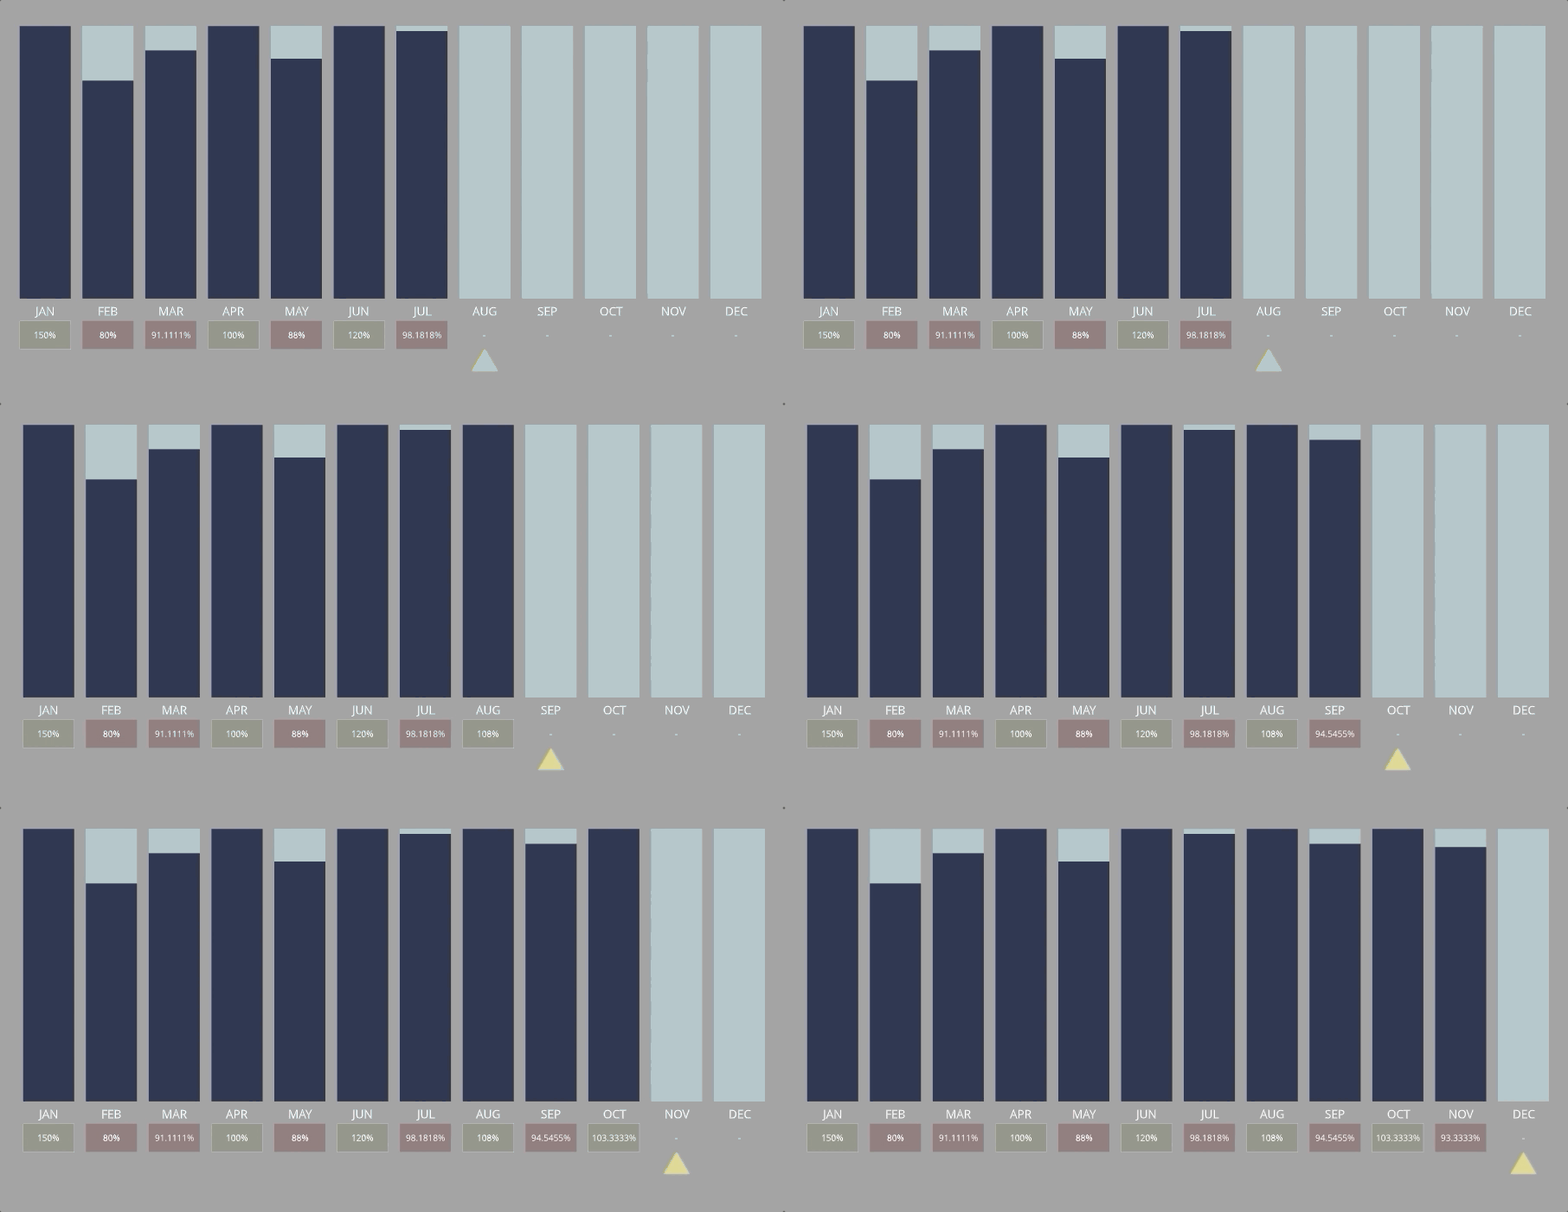
Now I have a way to quickly comprehend a lot of information about my sales performance, and it will update automatically when I update my quota attainment spreadsheet. Jump into Lucidchart and build your own dashboard that can help you see more, know more, and do more with your data.
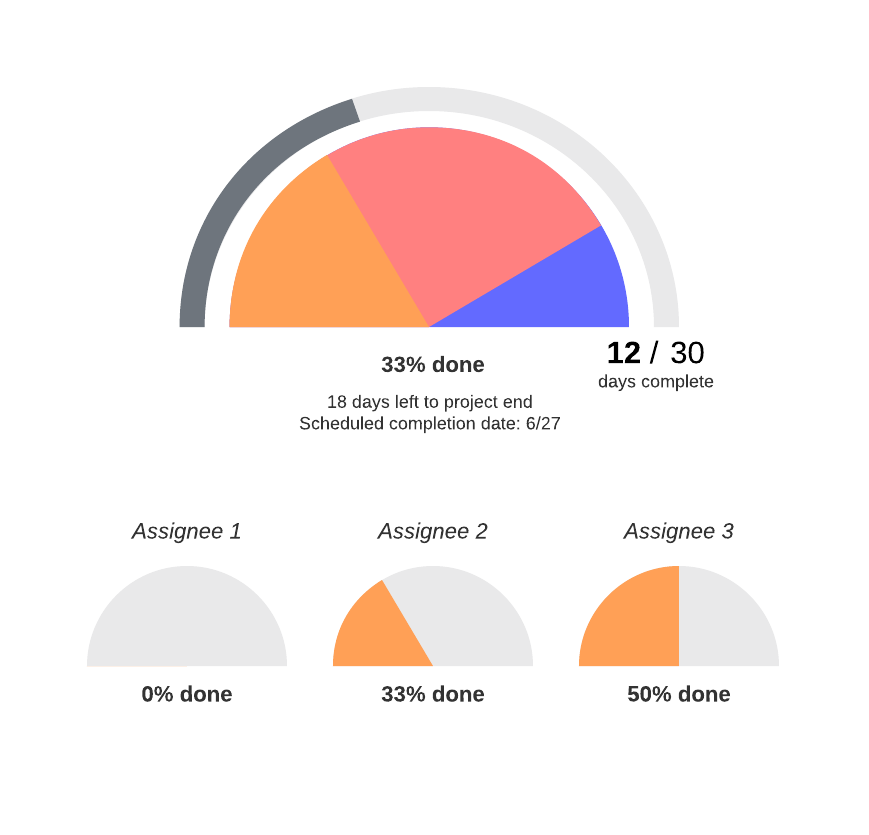
Dashboard Template
Ready to make your own dashboard? Get started faster with our template, featuring dynamic shapes and linked data.
Open now