Intelligence has taken the technology industry by storm. In fact, 92% of companies plan on increasing their investment in AI within the next three years.
In the visual collaboration space, companies are jumping on this trend in the form of generative AI. This technology is incredibly valuable during ideation, but it barely scratches the surface of what’s possible when introducing intelligence into collaboration.
Collaboration solutions only now experimenting with intelligence have missed opportunities to increase productivity, aid decision-making, and save time at every stage of work—beyond ideation.
Lucid is different. We’ve been building with intelligence in mind for over a decade. While other collaboration solutions only focused on simple sticky notes and arrows, Lucid was building advanced automation and data visualization capabilities. We know how vital intelligence is for moving into action, and now our solution delivers the most powerful combination of an easy-to-use interface with deep, technical capabilities.
Don’t get us wrong: We’re just as excited about the possibilities of generative AI as the next company. But we view this as an extension of our already intelligent solution—a way to further power effective collaboration and help teams build. Let’s uncover what’s unique about Lucid’s intelligence and how it benefits teams across the business.
Benefits: Why does intelligence matter in visual collaboration software?
Visuals are a powerful way to communicate ideas clearly and reach a shared understanding—and intelligent visuals are even more powerful. By adding automation and data to visual collaboration, teams can unlock new insights and gain clarity faster than ever.
An intelligent visual collaboration solution:
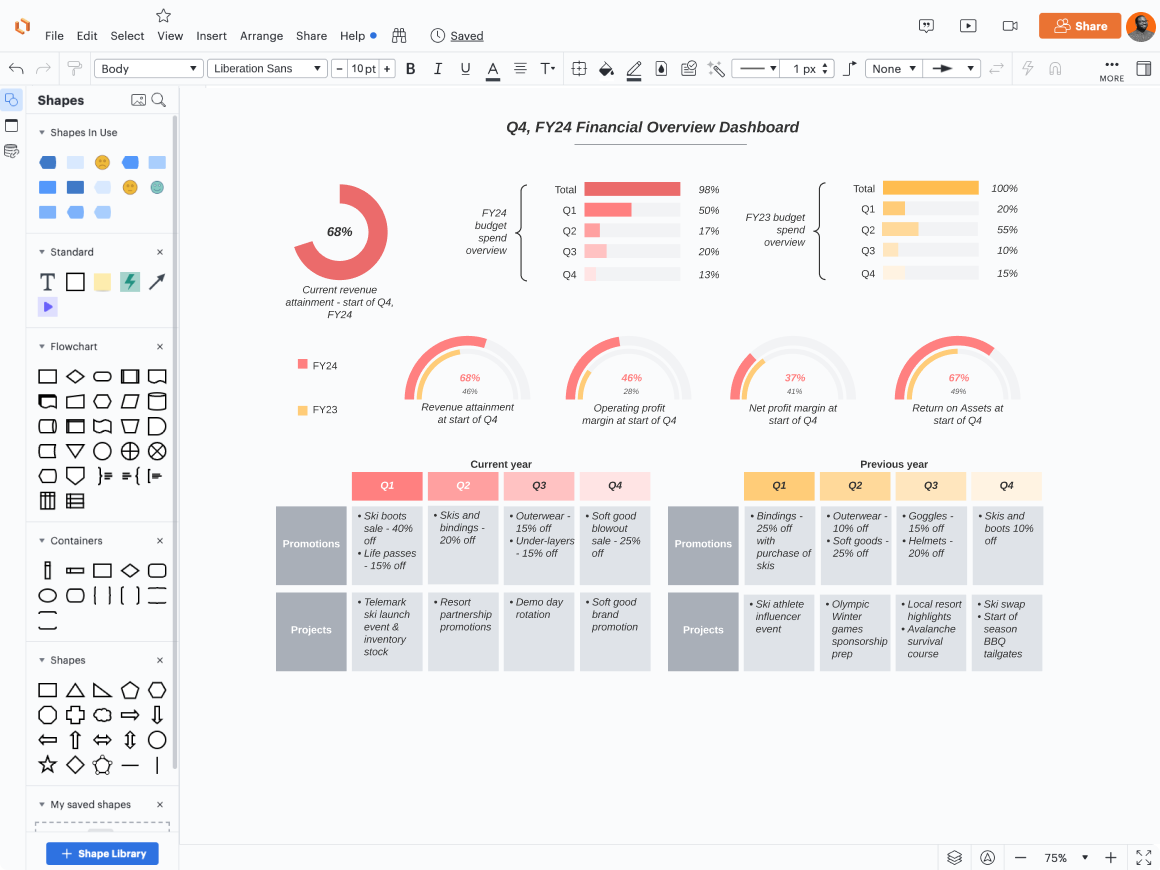
- Makes data more accessible across the organization: By taking data out of hard-to-understand formats like spreadsheets and turning it into visuals, teams across the business can easily make sense of complex information.
- Saves time that can be spent on higher-impact activities: With an intelligent solution, teams can spend less time manually creating diagrams or interpreting visuals and more time on collaborative work like problem-solving and creative brainstorming.
- Helps teams continually innovate: Intelligence helps teams identify trends in their data, areas of concern or interest, and opportunities for improvement—and with dynamic visuals synced with a system of record (like Google Sheets, Jira, and more), teams can ensure they’re taking action based on the most up-to-date information.
- Provides clarity around priorities: An intelligent visual collaboration solution takes the guesswork out of decision-making. It can help teams identify trends and align around what’s most important to the business.
- Helps with tool consolidation: Since intelligent solutions serve every team’s use cases—from brainstorming and planning to diagramming complex systems, processes, and architecture—businesses don’t have to purchase a separate platform for different needs. As a result, it’s easy to consolidate tools and reduce unnecessary spend.
What makes a visual collaboration solution “intelligent” anyway?
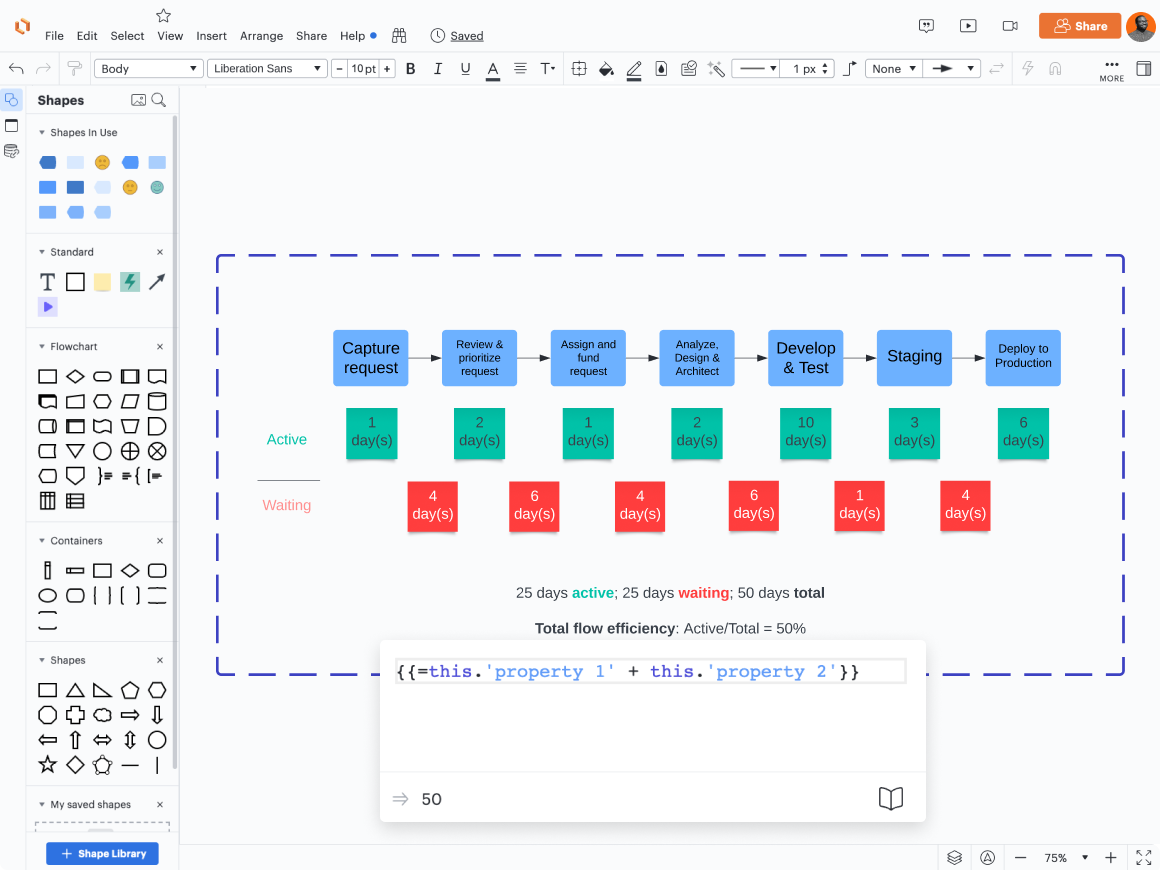
Artificial intelligence is only part of what makes Lucid’s solution intelligent. When we talk about Lucid’s intelligence, we’re talking about the ability to apply data and automation across the entire lifecycle of work—from overlaying data on processes to automatically aggregating opinions. Here are a few examples of what you can do with Lucid’s intelligence.
Automatically create visuals from outside data sources
While basic diagramming tools offer visual creation, intelligent diagramming introduces the ability to link visuals to data—something Lucid supports with unmatched depth.
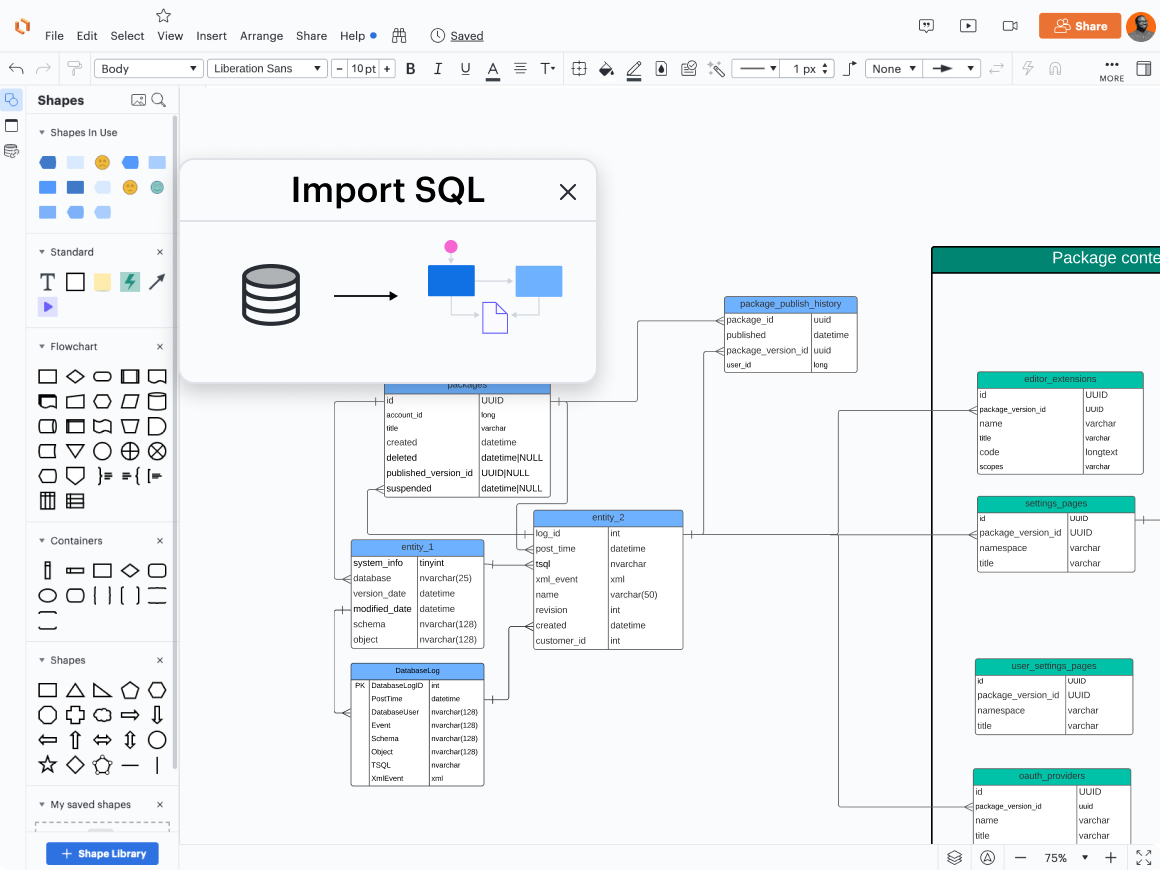
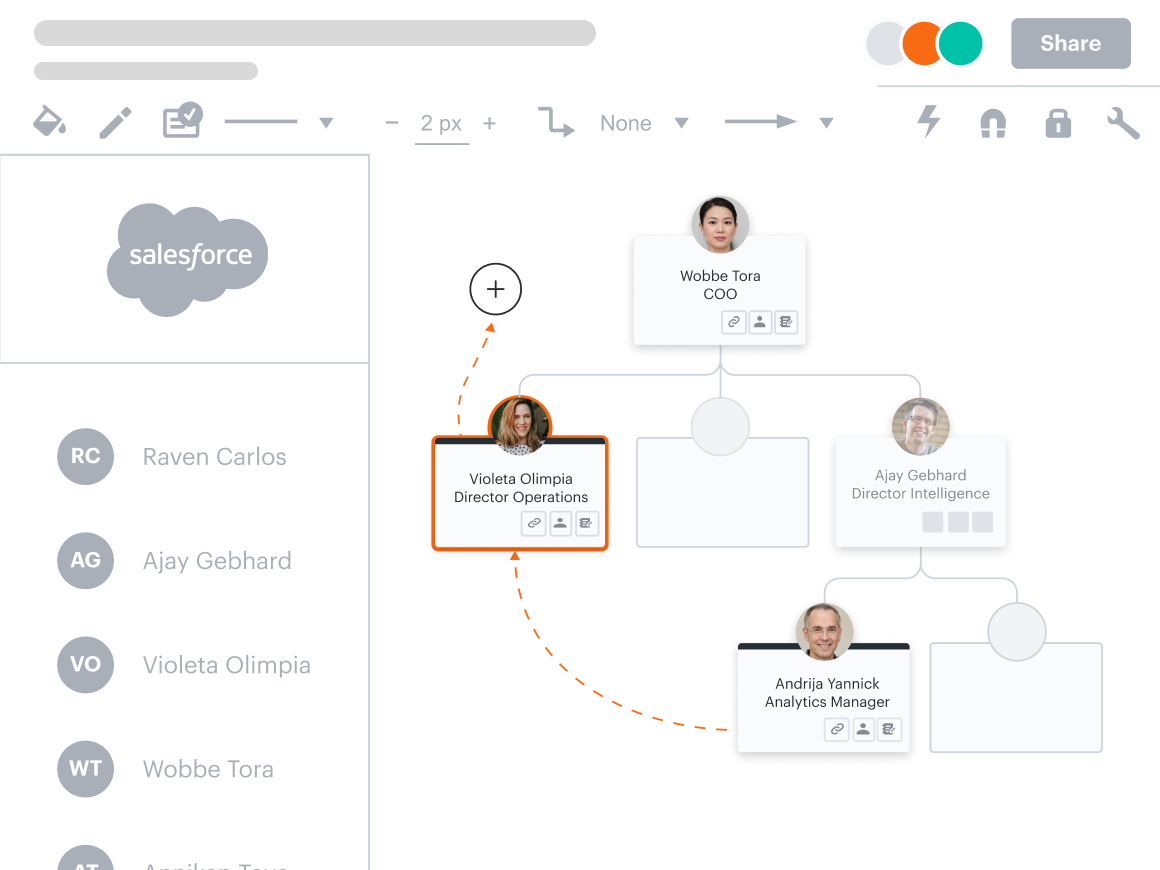
With Lucid, you can automatically import data directly from where it lives—whether that's static or cloud-based spreadsheets, CRMs like Salesforce, an HRIS, or another system of record—into Lucid to create diagrams nearly instantaneously. A few of the most common (and useful) diagrams teams generate automatically in Lucid are:
- Entity-relationship diagrams
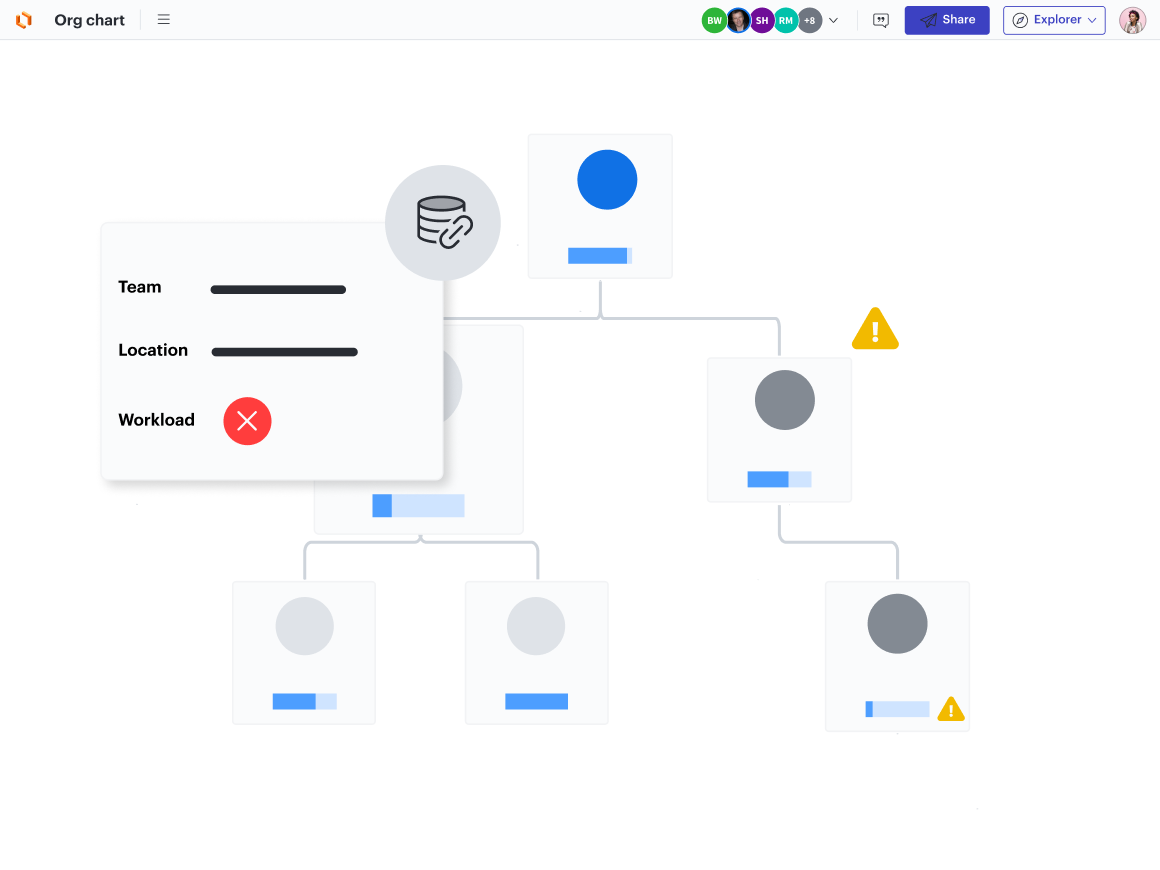
- Org charts
- Salesforce account maps
- UML sequence diagrams
- Architecture diagrams (using the Cloud Accelerator to visualize AWS, GCP, Azure, or custom hybrid architectures)
With Lucid, it’s easy to keep the data in your visuals up to date. If your data comes from Google Sheets, any change you make to your spreadsheet will automatically sync to Lucid. If your data originates in a CSV file or Excel spreadsheet, you can simply replace the data set with the most recent data.