
They say a picture is worth a thousand words, but when it comes to communicating a process, it’s worth so much more. Visuals can simplify complex ideas and systems, promoting greater clarity and alignment than reading plain text alone. Why? Because humans are drawn to colors, patterns, and images that tell a story.
In this blog post, we will dive into what a process infographic is, why it is beneficial, and how to create your own. Plus, we’re sharing free Lucidchart process infographic templates to help you design powerful, wow-worthy visuals.
What is a process infographic?
Simply put, a process infographic is a visual representation of the steps and stages of a process or system. They include text, images, colors, and other elements to clarify complexities. Process infographics are used in various fields, including medicine, food services, engineering, marketing, construction, and more.
You encounter process infographics more often than you might realize. Think about the safety card tucked into the seat pocket on an airplane. It uses simple visuals to illustrate how to evacuate the aircraft safely. These visuals can be universally understood across different languages and cultures.
Another example could be the new espresso machine you just bought. While it came with a 15-page manual, the quick-start graphic likely showed you how to set it up and start brewing in minutes.
In the workplace, infographics are everywhere, explaining company strategy, providing step-by-step instructions, or serving as a visual guide for products.
Process infographics simplify complex information across teams and industries, making it more accessible and efficient to get the context you need.
Benefits of a process infographic
Using process infographics to convey ideas, streamline procedures, and simplify complexities comes with several benefits. When we communicate visually, we can:
-
Synthesize ideas quickly.
-
Communicate efficiently across teams and departments.
-
Gain a high-level and detailed understanding of a system.
-
Achieve alignment.
-
Capture the attention of our audience more effectively.
-
Improve clarity.
Creating a process infographic in Lucidchart
Using Lucidchart is an easy and efficient way for anyone to create stunning process infographics. Aside from being user-friendly, our infographic maker comes with a host of other features, such as:
-
Real-time collaboration
-
Unique shape libraries
-
Multiple sharing options
-
Templates
The great news is that you don’t have to be a designer to create a process infographic. With the right tools, you can craft stunning visuals that simplify complex ideas and look polished and professional–no design skills required!

Not a designer? No problem! Learn how to design compelling visuals with our free, self-paced webinar.
Go nowProcess infographic templates
Lucidchart offers infographic templates that are visually engaging and easy to use.
Here are a few of our top templates to help you create a process infographic for almost anything.
4-topic infographic: Showcase four key elements of a system or process with this infographic process template. Colorful shapes and icons make it easy for your audience to grasp the big picture.
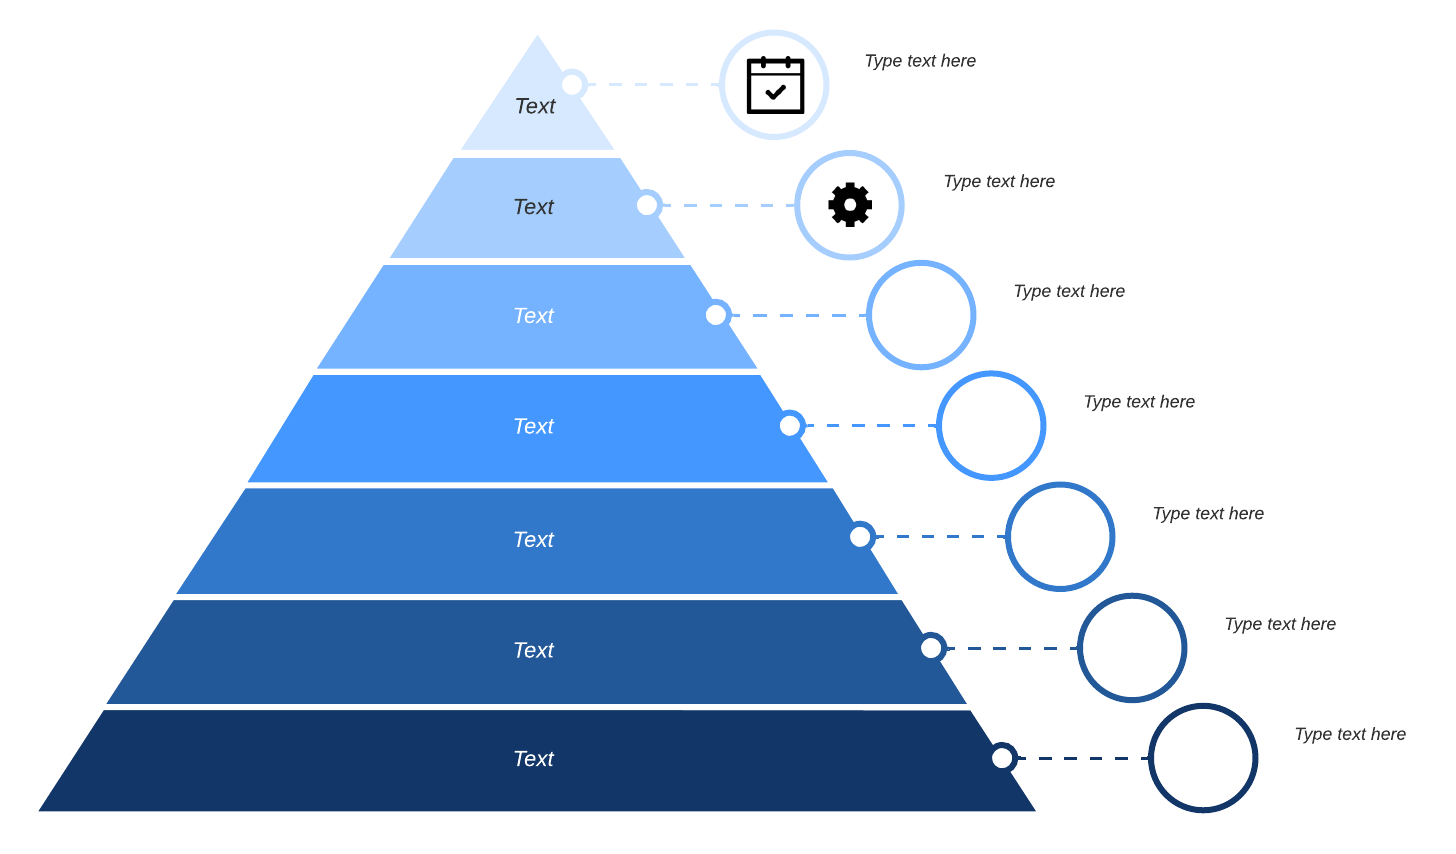
Pyramid with additional info: Organize ideas in a hierarchical way with our pyramid template. Show a high-level overview using icons and titles and go into detail within each layer of the pyramid.
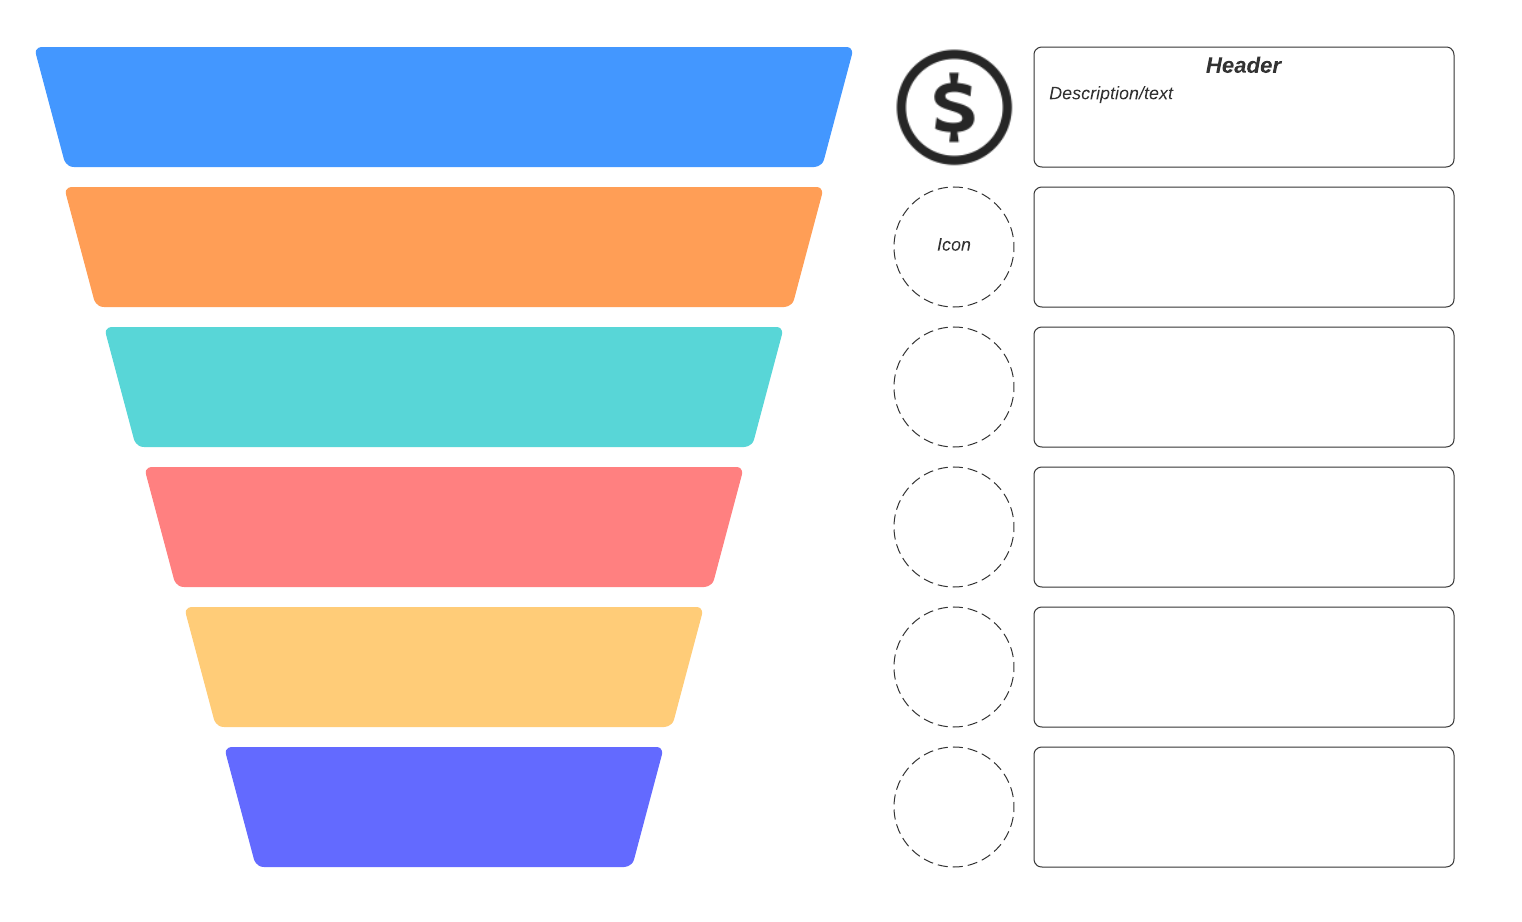
Infographic funnel: Illustrate the progression of a process with this funnel template. It’s perfect for explaining business strategies, workflows, or anything else!
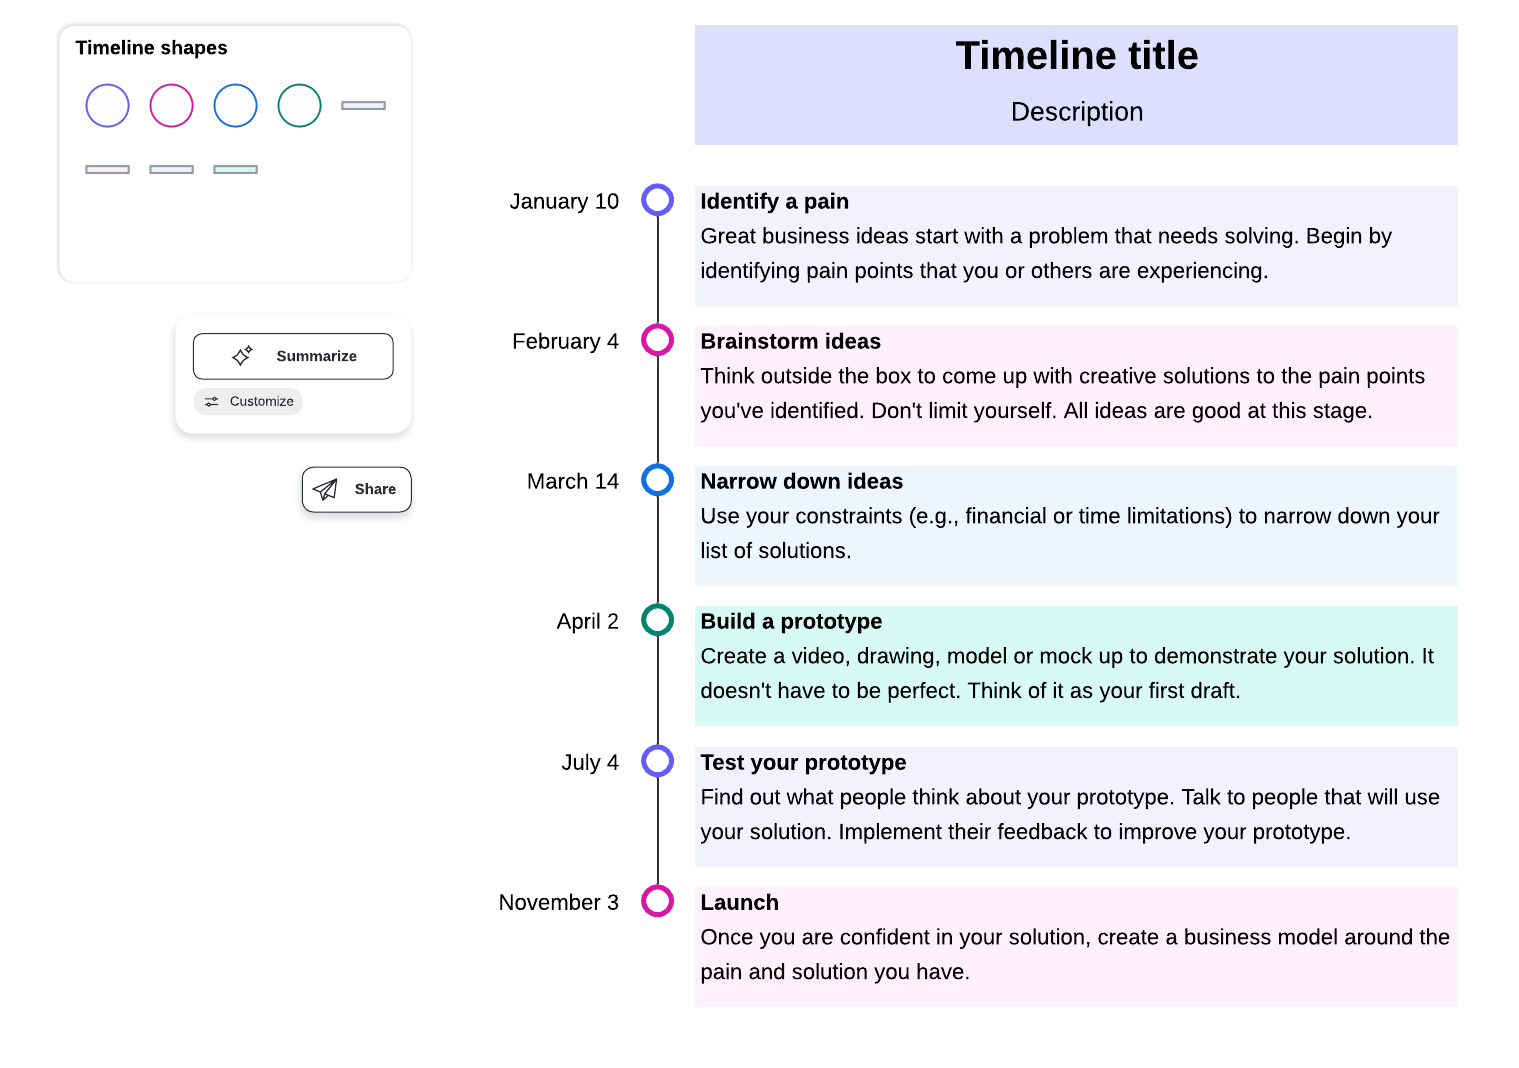
Vertical timeline: Map the chronology of events, project phases, or milestones with this vertical timeline. Add color and timeline shapes to differentiate events. Keep your team organized and aligned with a strong visual.
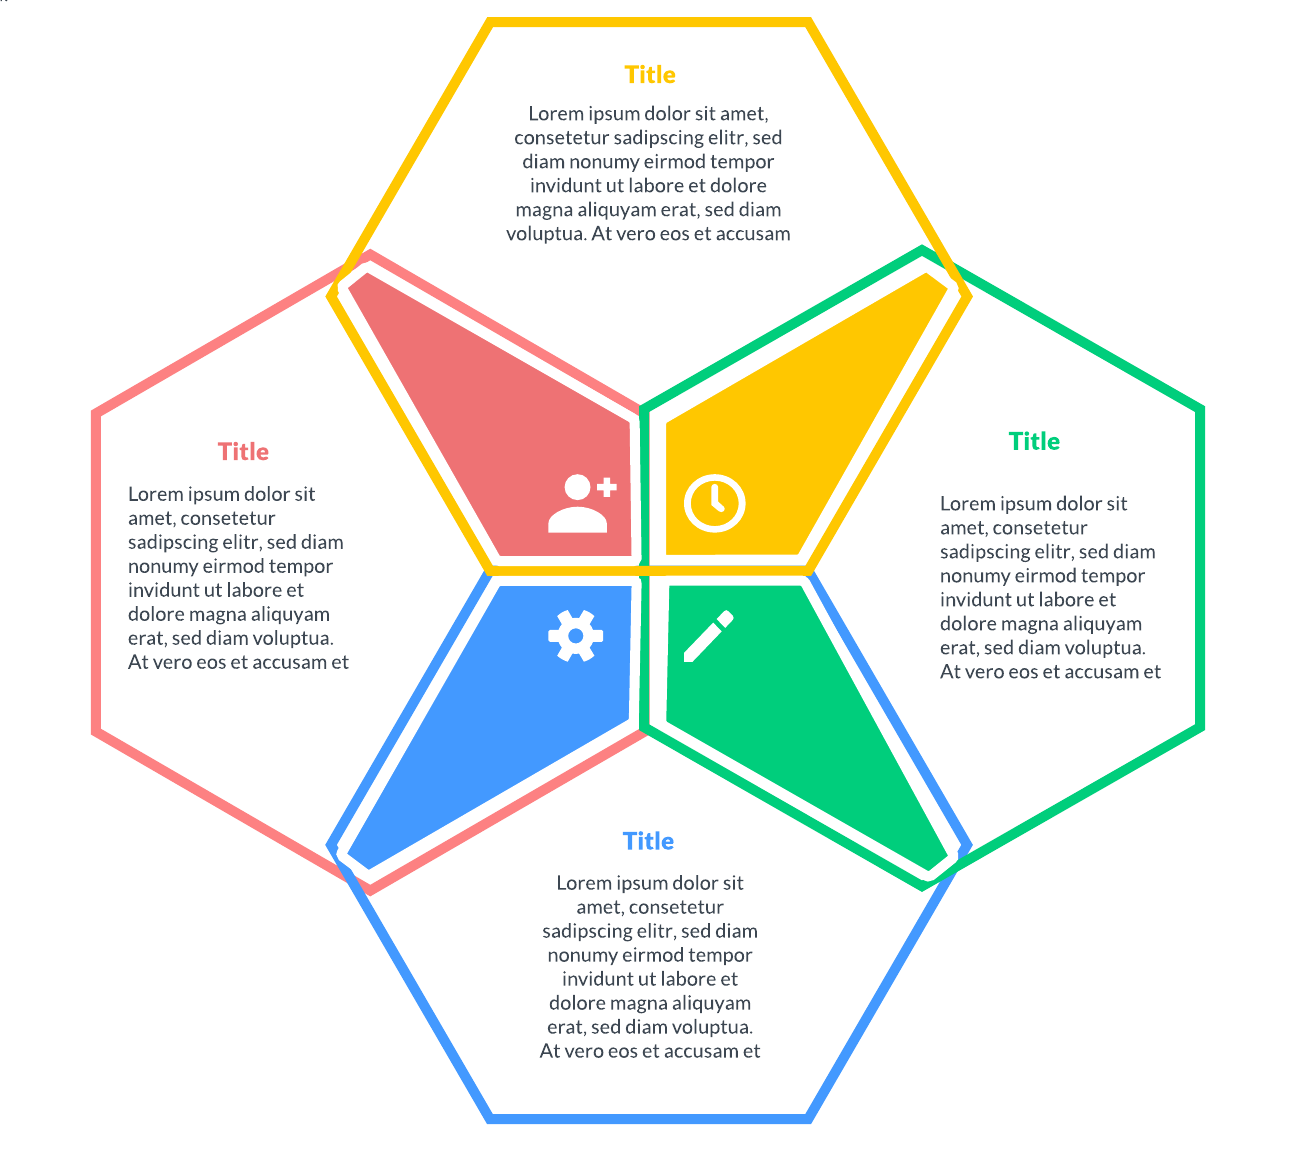
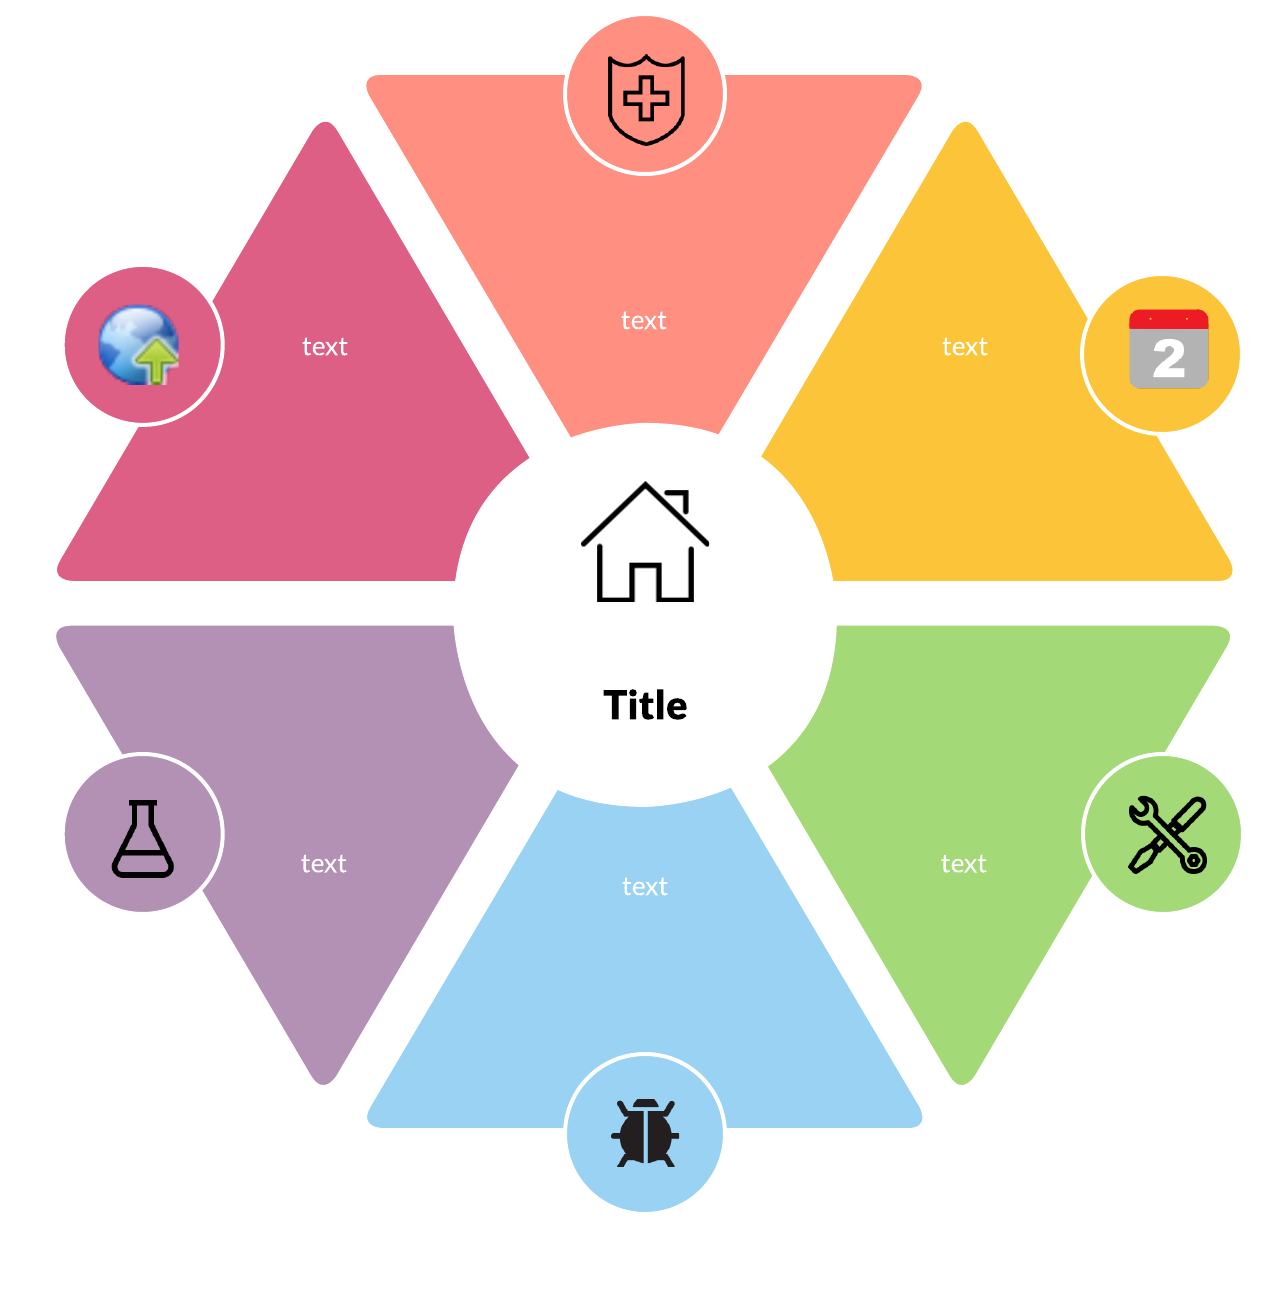
Hexagon infographic: Use the hexagon infographic template to illustrate how elements of a process or system are connected. Need more space? Simply copy and paste shapes to expand your infographic and add more detail.
DIY infographic process
If you prefer the manual route, here’s how to create a process infographic without a template in Lucidchart.
Step 1: Choose one process
A process infographic is supposed to simplify a topic, so focus on highlighting just one process to avoid confusing your audience.
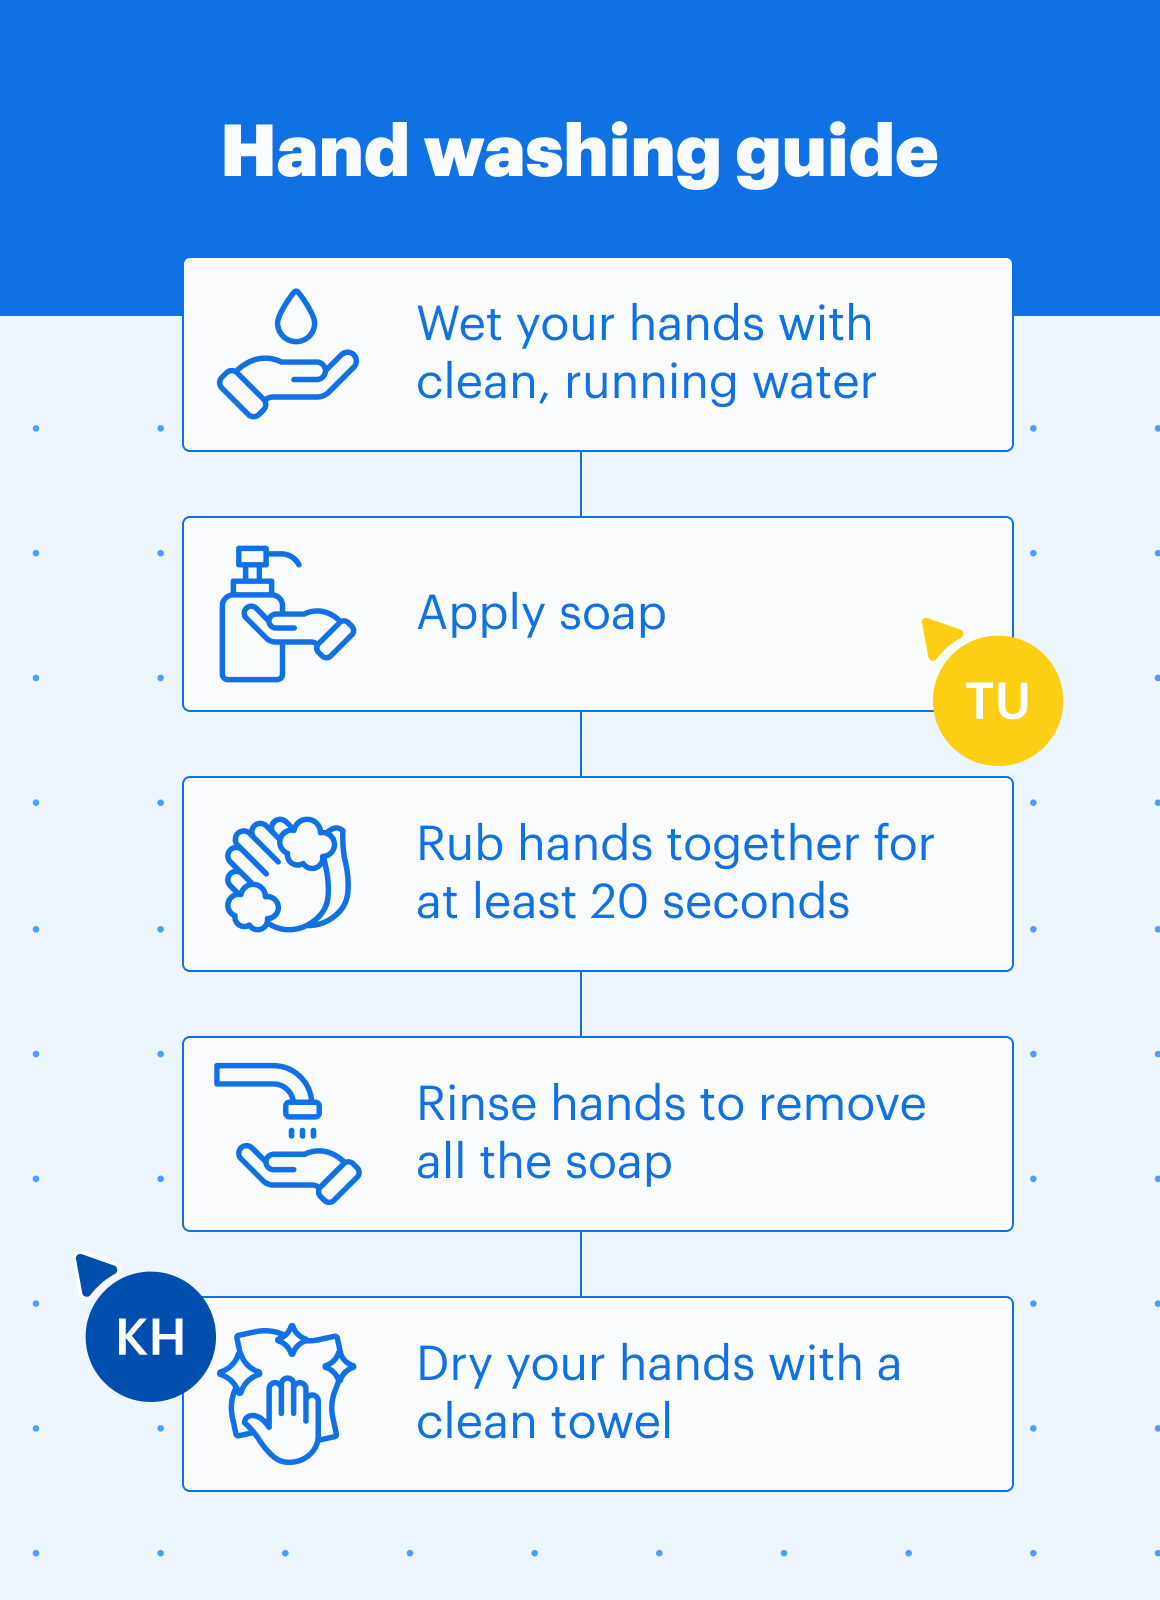
For example, say you’re a superintendent and want to make infographics for your school restrooms teaching about proper handwashing. Stick to the handwashing process and avoid mixing in related topics, like the benefits of handwashing or other hygiene practices, to keep your message clear and effective.
Step 2: Consider your audience
Before designing your infographic, consider your audience. Are these highly skilled executives or second graders? It’s easy to overlook details that seem obvious to you, but it’s usually better to over-explain than risk leaving important information out.
Step 3: Organize each step
As you map out your infographic, think about where you want your audience to begin in the process. Go through the process step by step and write it out so you can clearly visualize it and ensure you aren’t leaving anything out.
Step 4: Experiment with different layouts
Try presenting your information in different layouts. Does your process look better as a timeline, or a pyramid or something else? Use our infographic templates above if you aren’t sure.
Step 5: Check for errors and edit
Always proof your infographic. A good way to tell if your infographic is effective is to show it to a few people and get their feedback. Can they follow along to get the desired result?
If your students start drying their hands before using soap, it's in everyone’s best interest to rework the design.
Step 6: Share
Whether you are laminating your infographic and hanging it in school restrooms, or sharing a complex process with the C-suite, your infographic was made to be seen by others. If you are sharing digitally, there are lots of options in Lucidchart for sending your infographic out.

Ready to make a process infographic? Get started in Lucidchart for free.
Sign up free