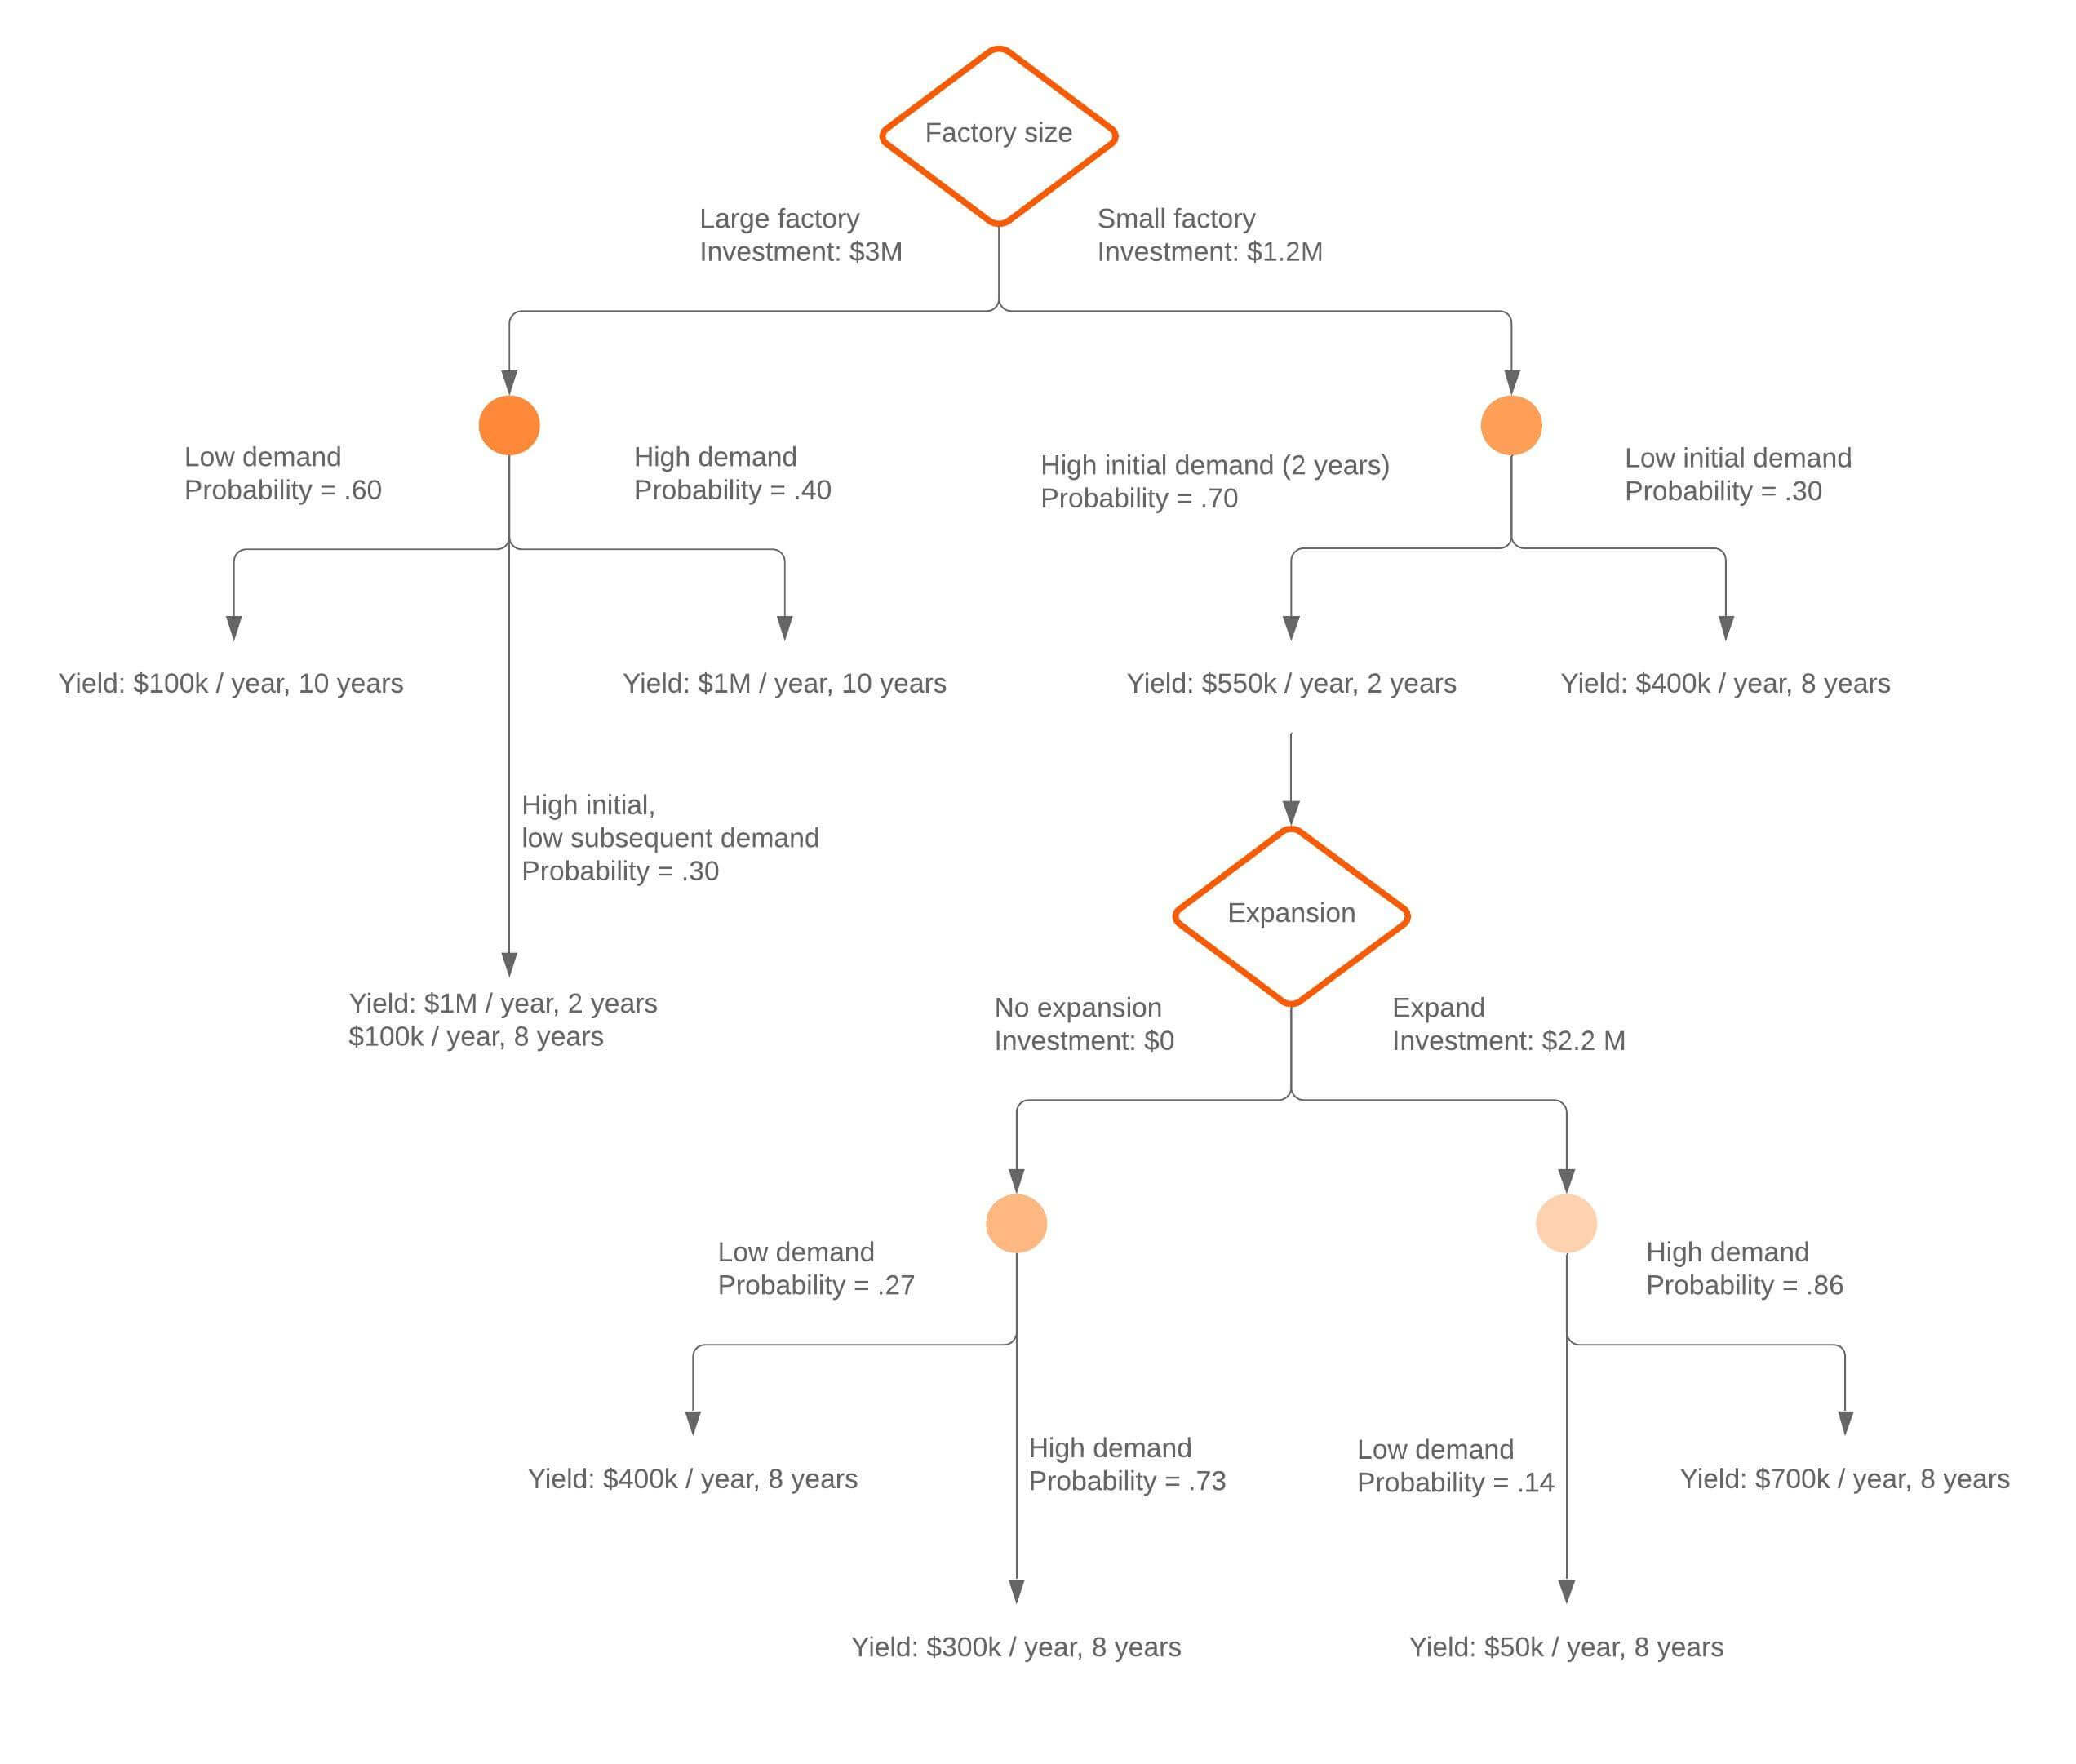
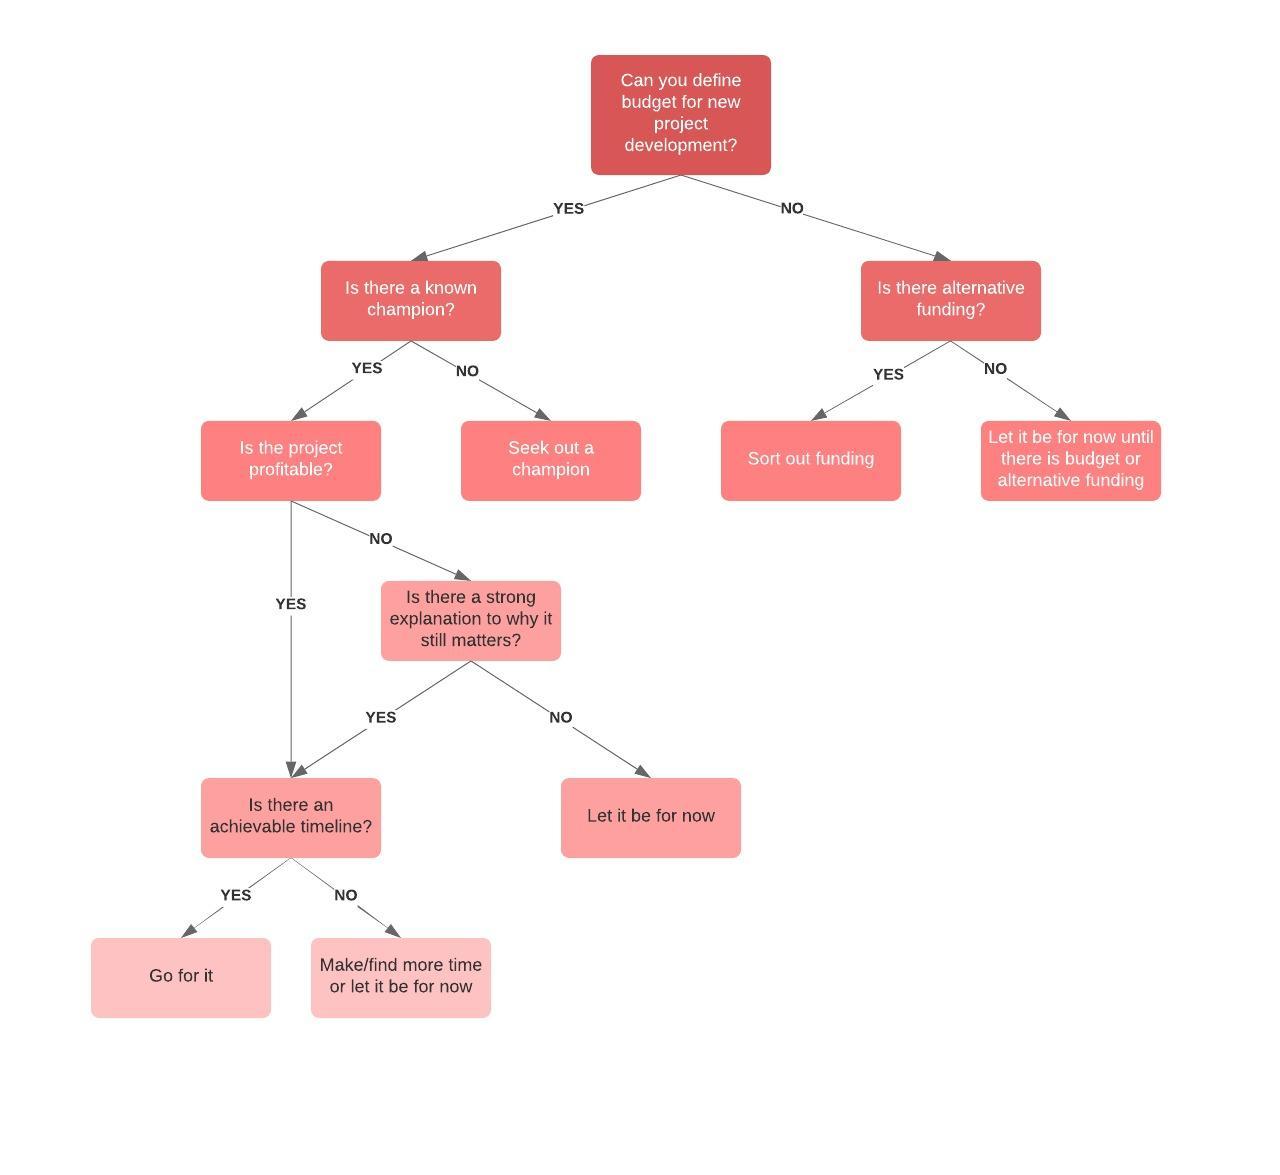
A decision tree is a map of possible outcomes in a series of related choices. Each outcome leads to additional nodes, which branch off into other possibilities and give it a tree-like shape.
A decision tree can be used either to drive informal discussion or to map out an algorithm that predicts the best choice mathematically. It enables individuals or organizations to weigh possible actions based on their costs, probabilities, and benefits.

Decision tree tutorial: How to build your own with Lucidchart
Tutorial on how to build a decision tree with Lucidchart
Decision tree symbols
Before making a decision tree, it's helpful to know some of the common symbols.
A chance node, represented by a circle, shows the probabilities of certain results.
A decision node, represented by a square, shows a decision to be made.
An endpoint or terminal node shows the final outcome of a decision path.
Branches connect nodes, indicating possible outcomes or actions. If the branch has two small lines cutting through it, this indicates a choice that was not selected.
Decision trees can also be drawn with flowchart symbols, which some people find easier to read and understand.
You may also see decision trees described with additional symbol names that map to the same underlying roles (decision, test, connection, and outcome).
| Shape | Name | Meaning |
|---|---|---|
 | Decision node | Indicates a decision to be made |
 | Chance node | Shows multiple uncertain outcomes |
 | Alternative branches | Each branch indicates a possible outcome or action |
 | Rejected alternative | Shows a choice that was not selected |
 | Endpoint node | Indicates a final outcome |
How to draw a decision tree
To draw a decision tree, first pick a medium. You can draw it by hand on paper or a whiteboard, or you can use decision tree software. Whatever your method, here are the steps to follow:
1. Start with the main decision or root node. Draw a small box to represent the ultimate decision you’re trying to make, then draw a line from the box to the right for each possible solution or action. Label them accordingly.

2. Add chance and decision nodes to expand the tree as follows:
-
If another decision is necessary, draw another box.
-
If the outcome is uncertain, draw a circle to represent a chance node.
-
If the problem is solved, leave it blank (for now).

From each decision node, draw possible solutions. From each chance node, draw lines representing possible outcomes. If you intend to analyze your options numerically, include the probability of each outcome and the cost of each action.
3. Continue to expand until every line reaches an endpoint, meaning there are no more choices to be made or chance outcomes to consider. Then, assign a value to each possible outcome. It could be an abstract score or a financial value. Add triangles to signify endpoints.

As you expand the tree, it helps to keep your evaluation criteria consistent across options so you can compare branches fairly. For example, if you ask whether one option will be easy to implement, you should apply the same question to the other options.
Once you've got the basic layout of a decision tree complete, you can add values to each line to garner more intelligence. Here's how to do it:
-
Look at each line and add an amount to each.
-
To analyze your options numerically, add an estimate for the probability of each outcome. When adding percentages, all the lines from a single node need to equal 100. If you're using fractions, they need to add up to one.
-
Assign a possible amount to each triangle at the end of the branches.
-
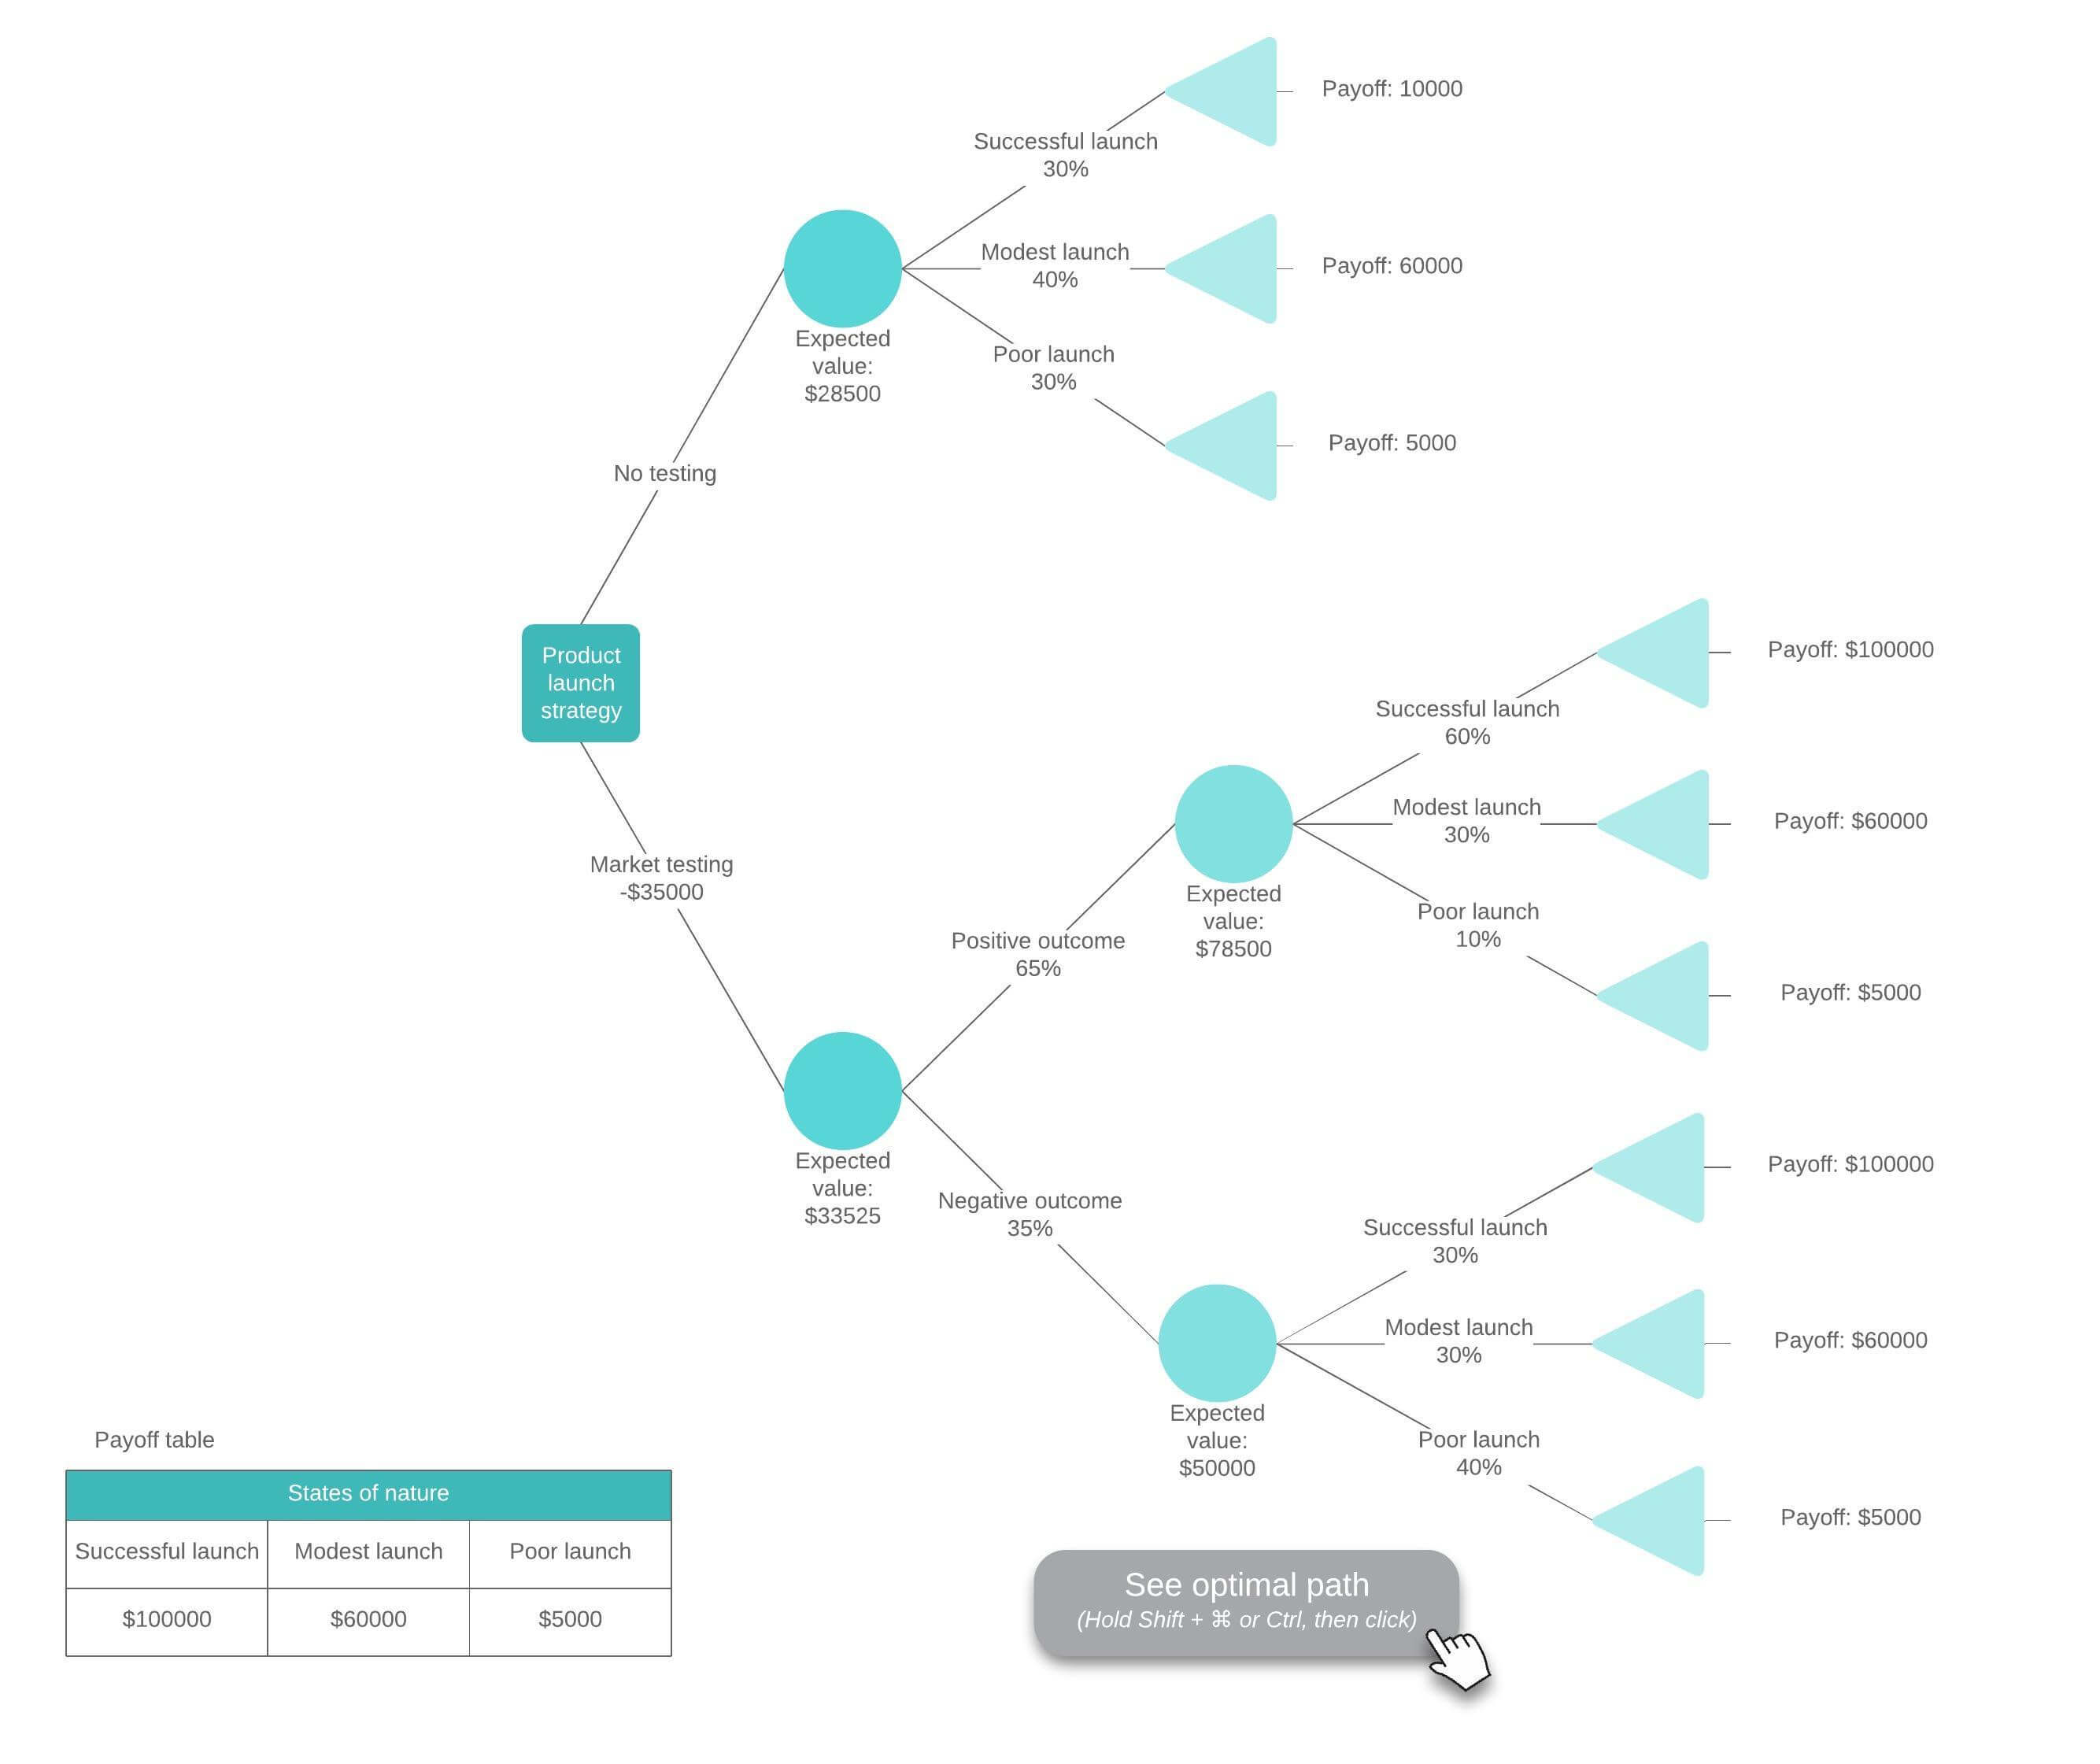
Multiply the result by the percentage probability for each end branch in that outcome and subtract the cost of that course of action. You'll end up with an estimate of what that particular outcome could yield.

Note: If you have a large tree with many branches, calculate the numbers for each square or circle and record the results to get the value of that decision. Start on the right side of the tree and work towards the left.
Decision tree analysis example
By calculating the expected utility or value of each choice in the tree, you can minimize risk and maximize the likelihood of reaching a desirable outcome.
To calculate the expected utility of a choice, subtract the cost of that decision from the expected benefits. The expected benefits are equal to the total value of all the outcomes that could result from that choice, with each value multiplied by the likelihood it will occur.
When identifying the most desirable outcome, it's important to account for the decision-maker's utility preferences. For instance, some may prefer low-risk options while others are willing to take risks for a larger benefit.
When you use your decision tree with an accompanying probability model, you can calculate the conditional probability of an event, or the likelihood that it will happen if another event happens. To do so, start with the initial event, then follow the path from that event to the target event, multiplying the probability of each event.
In this way, a decision tree can function as a traditional tree diagram, which maps out the probabilities of certain events, such as flipping a coin twice. In some cases, when precise probabilities aren’t available, teams represent risk with degrees of probability (e.g., high/medium/low risk).

Advantages and disadvantages of decision trees
As data-driven visuals, decision trees provide a comprehensive view of outcomes and help reduce bias in decision-making. The advantage of decision trees is that they are:
-
Comprehensive: Decision trees allow you to look at all the possible outcomes of a choice, so you're able to better understand the risks and consequences of your decisions.
-
Visual: Decision trees don't rely on formulas. They're easy to understand, and you can easily share them with others for input, which can help you gain buy-in from stakeholders.
-
Adaptable: Just about every question can be answered using a decision tree, and they can be as simple or as complex as you'd like.
-
Bias-reducing: Decision trees help cut through emotions, letting you properly weigh the results of one decision against another.
-
Simple: Decision trees don't require gathering much data. If there are gaps in the data, you can identify where you'll need more information.
-
Time-saving: Depending on the complexity of the decision, a decision tree may be the fastest way to find a solution.
The main disadvantage of decision trees is their potential to become:
-
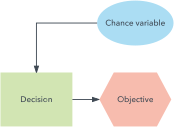
Overly complex: Even relatively simple questions can balloon into large diagrams that can result in errors or disingenuous outcomes, so it’s worth planning for complexity and keeping the tree readable as it grows. In such cases, a more compact influence diagram can be a good alternative. Influence diagrams narrow the focus to critical decisions, inputs, and objectives.
-
Error-prone: Another practical limitation is that early mistakes can cascade through the rest of the model, affecting downstream branches and conclusions. Watch out for chain reactions: If you've tested a question early on in your tree and later realize you made a mistake, all branches and nodes will need to be updated. That's why it's best to use cloud-based software to design your tree so you can easily make changes.
Remember that decisions are based on expectations, and decision trees don't plan for all variables (for instance, your business having to become fully remote due to a pandemic). While decision trees are great for helping make better decisions, they're only as good as the information you have to work with.
Decision trees in machine learning and data mining
A decision tree can be used to help build automated predictive models, which have applications in machine learning, data mining, and statistics. Known as decision tree learning, this method takes into account observations about an item to predict that item's value.
In these decision trees, nodes represent data rather than decisions. This type of tree is also known as a classification tree. Each branch contains a set of attributes, or classification rules, that are associated with a particular class label, which is found at the end of the branch.
These rules, also known as decision rules, can be expressed in an if-then clause, with each decision or data value forming a clause, so that, for example, "If conditions 1, 2, and 3 are fulfilled, then outcome x will be the result with y certainty."
Each additional piece of data helps the model more accurately predict which of a finite set of values the subject in question belongs to. That information can then be used as an input in a larger decision-making model. Sometimes the predicted variable will be a real number, such as a price. Decision trees with continuous, infinite possible outcomes are called regression trees.
For increased accuracy, sometimes multiple trees are used together in ensemble methods:
- Bagging creates multiple trees by resampling the source data, then has those trees vote to reach consensus.
- A Random Forest classifier consists of multiple trees designed to increase the classification rate
- Boosted trees that can be used for regression and classification trees.
- The trees in a Rotation Forest are all trained by using PCA (principal component analysis) on a random portion of the data
A decision tree is considered optimal when it represents the most data with the fewest number of levels or questions. Algorithms designed to create optimized decision trees include CART, ASSISTANT, CLS and ID3/4/5. A decision tree can also be created by building association rules, placing the target variable on the right.
Each method must determine the best way to split the data at each level. Common methods for doing so include measuring the Gini impurity, information gain, and variance reduction.
Using decision trees in machine learning has several advantages:
-
The cost of using the tree to predict data decreases with each additional data point.
-
Decision trees work for either categorical or numerical data.
-
They can model problems with multiple outputs.
-
They use a white box model (making results easy to explain).
-
A tree's reliability can be tested and quantified.
-
Decisions tend to be accurate regardless of whether they violate the assumptions of the source data.
But they also have a few disadvantages:
-
When dealing with categorical data with multiple levels, information gain is biased toward attributes with the most levels.
-
Calculations can become complex when dealing with uncertainty and many linked outcomes.
-
Conjunctions between nodes are limited to AND, whereas decision graphs allow for nodes linked by OR.
In data work, you’ll most commonly encounter two broad decision-tree diagram types—classification and regression—each suited to different kinds of outputs. Both are valuable systems, but they work a bit differently and have their own distinct uses.
With classification trees, you can sort objects, units, outcomes, and groups into categories. You can set up branches with characteristics that facilitate classification and provide at-a-glance delineation among categories. For example, you can use a classification tree with data mining to help sort different types of outcomes into categories.
Regression trees, rather than helping with classification, help with prediction. A regression tree uses continuous variables—which are obtained through measurement—to select branches (or nodes). In other words, you might use a regression tree to sort outcomes based on their probability of happening.
Why make a decision tree?
Decision tree diagrams are often used by businesses to plan a strategy, analyze research, and come to conclusions. Lenders and banks use decision trees to calculate the riskiness of loans and investment opportunities. They are also a popular choice for infographics, often appearing in magazines or shared on social media. The point is that decision trees can be used to evaluate just about any question or concern and visualize possible outcomes.
Common use cases for decision trees include:
-
Product planning: Which feature should we add first?
-
General business decisions: Should we keep the business remote or move headquarters?
-
Technology investment: Which CMS should we purchase?
-
Loan approval: Is this borrower a high credit risk?
-
Personal decisions: Which car should we buy?
Decision trees are particularly useful when you want a repeatable way to make the same kind of decision over and over or when you need a consistent set of criteria to reduce bias across cases.
Decision trees can also be valuable in user-facing contexts, where the “tree” becomes a guided experience for selecting an option or navigating a process. You can use a decision tree to provide a visual aid that represents many options alongside a justification for each. Using a decision tree as a model, you can build each option into a user-facing application. You could also use decision trees to visualize how a website works and how users will navigate through your site. Internally, you could develop decision trees that your organization can use. For instance, customer service or support agents can use decision trees to guide their interactions with clients.
If you’re deciding whether a decision tree is the right tool, it helps to check whether you’re framing a true decision (with actionable alternatives) rather than a purely informational question. So, for instance, an appropriate decision tree question would be "Should we build a new website or overhaul the existing one?" From there, you can start investigating the consequences of building or overhauling the website. An inappropriate decision tree question would be "Which soup is Jared's favorite?"
Getting started in Lucidchart
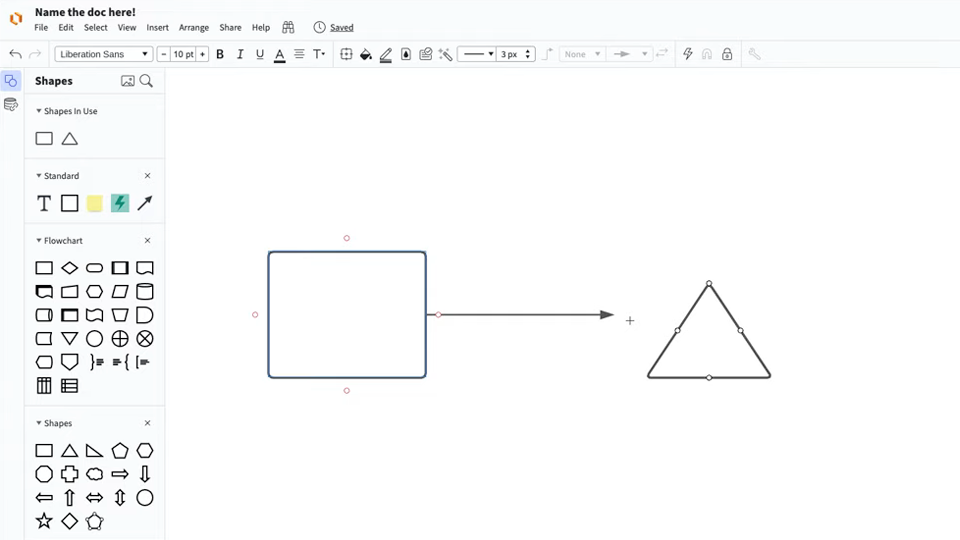
Master the basics of Lucidchart in 3 minutes
How to make a decision tree with Lucidchart
Let's use Lucidchart to make a decision tree for a product launch and decide whether it makes sense to invest in market testing first. There are only a few symbols (circle, square, line, and triangle) in a decision tree diagram, so we'll make one from scratch. Log in to your account (if you don't have one, sign up to try Lucidchart free) and follow the steps below.
1. Open a blank document
Start a blank document by clicking +New > Lucidchart > Blank document.
2. Adjust the page settings
Because decision tree diagrams can be large, it helps to change the page format to landscape. Click the dropdown to the right of Format to change the page orientation to Landscape or Portrait.
3. Name the decision tree diagram
Click on the title in the top-left corner of the screen and type the name of your diagram in the text box.
4. Start drawing the decision tree
Click and hold the rectangle under Shapes and drag it to the far left side of your document. Decision trees are drawn left to right, so place them as close to the margin as you can. Use the grid and ruler to align the rectangle where you want it. Type the decision in the rectangle. Use the text formatting options at the top of the diagram to change fonts, colors, and spacing.
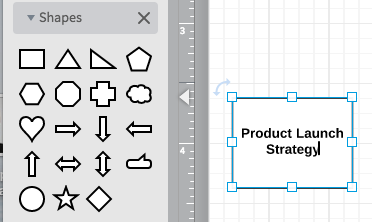
5. Add nodes
Click and drag a circle to the diagram to add the uncertain nodes. Use the grids to align the circles on the page. To adjust the circle's size, click on it, click on a blue square, and drag it to resize. Type the name of the uncertain outcome in the circle. You can add as many possibilities as you want, but you need a minimum of two options when starting a decision tree. Continue adding nodes to the decision tree until you reach the end outcome for each choice.
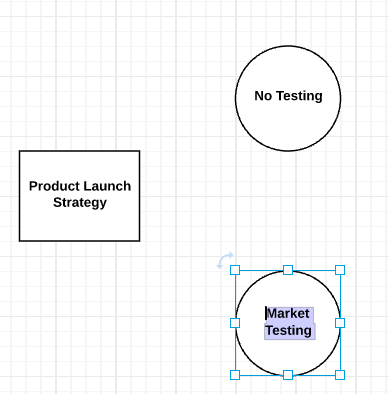
6. Add branches to the decision tree
To draw lines between the nodes, click on a shape and then drag a line out from one of the circles that appears to the next node. An arrow is automatically drawn between the two objects.
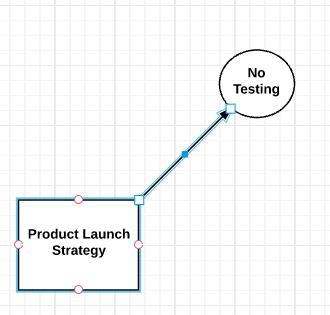
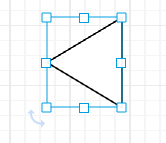
When you get to the end of a branch, where no other decisions are needed in that route, add a triangle to the end of that row.
7. Add probabilities and values to the decision tree
It's time to evaluate the decision tree, so you can estimate how much it's worth if a particular outcome occurs. Look at the circles and add estimates for the probability of each outcome. To add numbers to the diagram, click on the large T in the Standard options and drag it to the spot where you want to add an estimate.
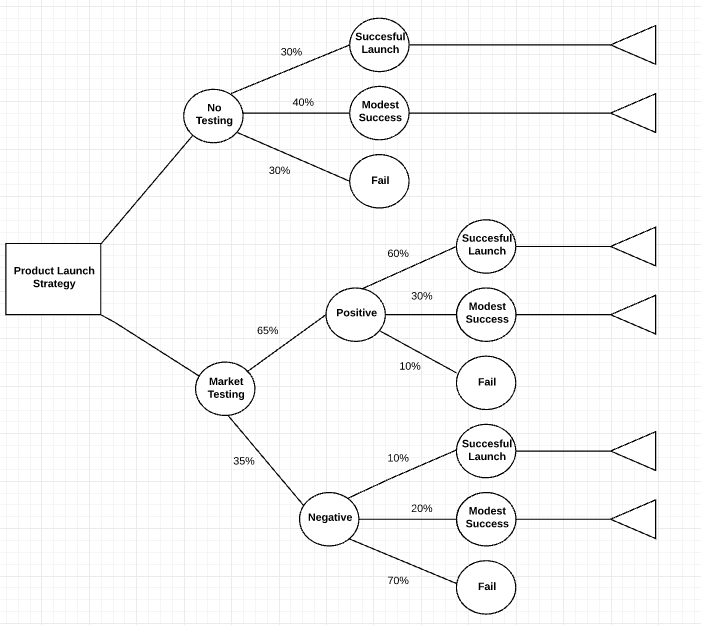
Percentages for each node should equal 100. If you're using fractions, each node should add up to one. Feel free to use existing data, if you have it. Next, add the cost of each option along the branch (decision line).
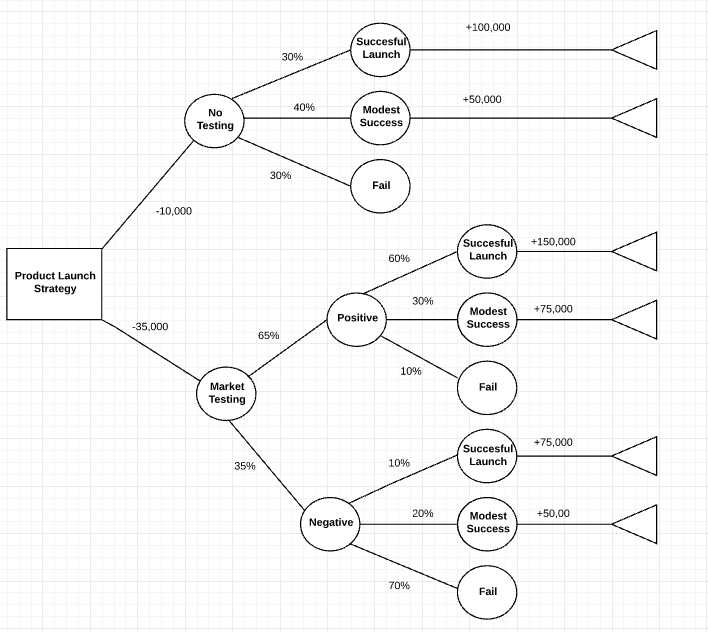
8. Calculate the value of each decision
Start on the right side of the tree and work toward the left. Subtract the cost of each decision from the expected benefits. Once calculations are complete, you'll clearly see which option will give you the biggest reward.
9. Add colors to the decision tree
Once you have the basic design of your decision tree complete, you can add colors by clicking on a symbol and then clicking the color-fill icon on the menu bar to choose a color.
10. Share your decision tree diagram
To share your decision tree diagram with collaborators, click the Share button in the top-right corner of the screen, and a pop-up will appear. Choose how you'd like to share the diagram and set the appropriate level of permissions.
Because decision trees can change as assumptions change, collaborative, cloud-based diagramming can make it easier to revise branches without having to rebuild the model from scratch.

Start a free Lucidchart account to create decision tree diagrams and make data-backed decisions.
Sign up free